Matplotlib Artists
Matplotlib is a comprehensive library for creating static, animated, and interactive visualizations in Python. At the heart of Matplotlib are the artists. Everything you see in a Matplotlib figure is an artist. This includes Text objects, Line2D objects, collection objects, and even the figure itself. Understanding how artists work is key to mastering how to customize your figures in Matplotlib.
This article will delve into the world of Matplotlib artists, providing a detailed guide on how to manipulate them for creating customized plots. We will cover a range of examples, each accompanied by complete, standalone Matplotlib code that you can run directly to see the artists in action.
Understanding Artists
In Matplotlib, an “artist” is essentially anything that can be drawn on the figure, which might include primitive shapes like lines, rectangles, and circles, or more complex collections of shapes. There are two main types of artists:
- Primitives: These are basic shapes like lines, rectangles (and squares), and circles.
- Containers: These include figures, axes, and axis, which can hold other artists.
Let’s dive into some examples to see how we can work with these artists.
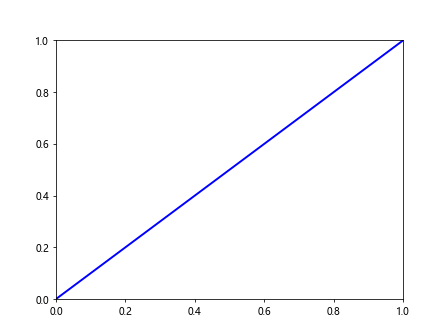
Example 1: Creating a Line2D Artist
import matplotlib.pyplot as plt
from matplotlib.lines import Line2D

fig, ax = plt.subplots()
line = Line2D([0, 1], [0, 1], lw=2, color='blue', label='how2matplotlib.com Line')
ax.add_line(line)
ax.set_xlim(0, 1)
ax.set_ylim(0, 1)
plt.show()
Output:
Example 2: Drawing a Rectangle
import matplotlib.pyplot as plt
from matplotlib.patches import Rectangle

fig, ax = plt.subplots()
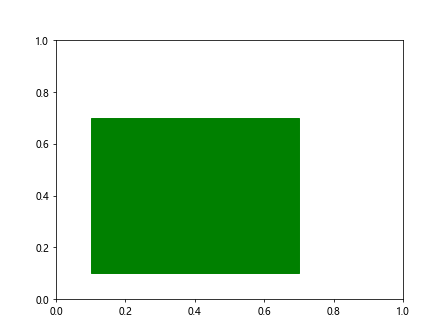
rect = Rectangle((0.1, 0.1), 0.6, 0.6, fill=True, color='green', label='how2matplotlib.com Rectangle')
ax.add_patch(rect)
plt.show()
Output:
Example 3: Adding Circles
import matplotlib.pyplot as plt
from matplotlib.patches import Circle

fig, ax = plt.subplots()
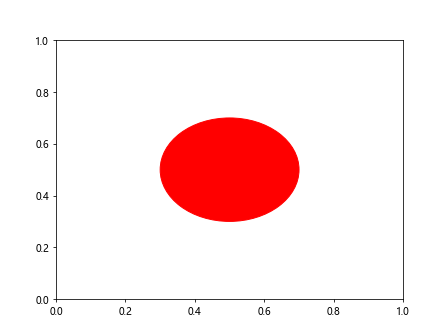
circle = Circle((0.5, 0.5), 0.2, color='red', label='how2matplotlib.com Circle')
ax.add_patch(circle)
plt.show()
Output:
Example 4: Using Text Artists
import matplotlib.pyplot as plt

fig, ax = plt.subplots()
ax.text(0.5, 0.5, 'how2matplotlib.com', fontsize=12, ha='center')
plt.show()
Output:
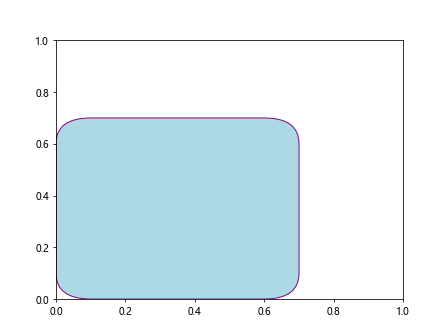
Example 5: Customizing Axes with Artists
import matplotlib.pyplot as plt
from matplotlib.patches import FancyBboxPatch

fig, ax = plt.subplots()
bbox = FancyBboxPatch((0.1, 0.1), 0.5, 0.5, boxstyle="round,pad=0.1", ec="purple", fc="lightblue", label='how2matplotlib.com Box')
ax.add_patch(bbox)
plt.show()
Output:
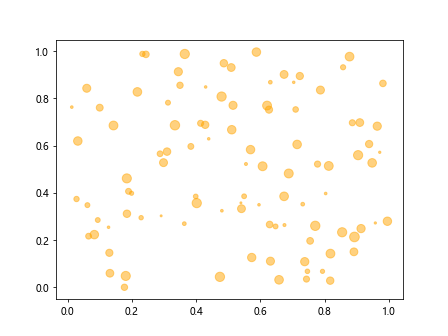
Example 6: Creating a Scatter Plot with PathCollection
import matplotlib.pyplot as plt
import numpy as np

x = np.random.rand(100)
y = np.random.rand(100)
sizes = np.random.rand(100) * 100

fig, ax = plt.subplots()
scatter = ax.scatter(x, y, s=sizes, color='orange', alpha=0.5, label='how2matplotlib.com Scatter')
plt.show()
Output:
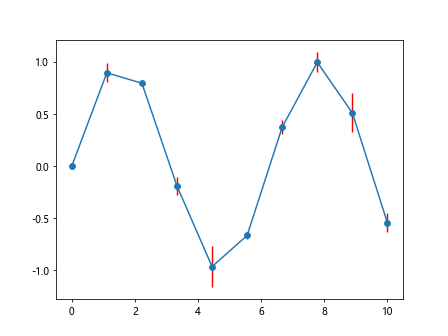
Example 7: Plotting with Error Bars
import matplotlib.pyplot as plt
import numpy as np

x = np.linspace(0, 10, 10)
y = np.sin(x)
errors = np.random.rand(10) * 0.2

fig, ax = plt.subplots()
errorbar = ax.errorbar(x, y, yerr=errors, fmt='-o', ecolor='red', label='how2matplotlib.com ErrorBar')
plt.show()
Output:
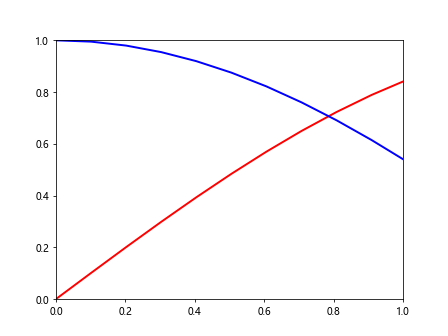
Example 8: Drawing Multiple Lines with LineCollection
import matplotlib.pyplot as plt
from matplotlib.collections import LineCollection
import numpy as np

x = np.linspace(0, 10, 100)
y1 = np.sin(x)
y2 = np.cos(x)

lines = [list(zip(x, y1)), list(zip(x, y2))]

fig, ax = plt.subplots()
line_collection = LineCollection(lines, colors=['red', 'blue'], linewidths=2, label='how2matplotlib.com Lines')
ax.add_collection(line_collection)
plt.show()
Output:
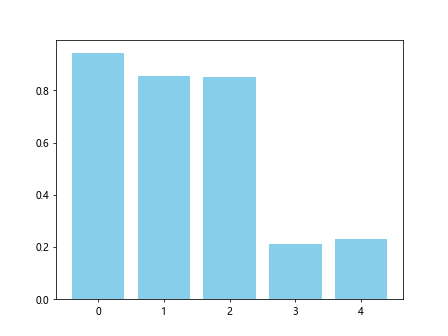
Example 9: Creating a Bar Chart
import matplotlib.pyplot as plt
import numpy as np

x = np.arange(5)
heights = np.random.rand(5)

fig, ax = plt.subplots()
bars = ax.bar(x, heights, color='skyblue', label='how2matplotlib.com Bars')
plt.show()
Output:
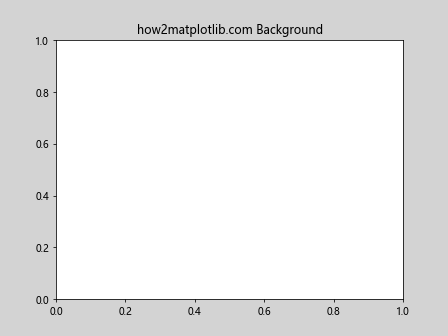
Example 10: Customizing the Figure Background
import matplotlib.pyplot as plt

fig, ax = plt.subplots()
fig.patch.set_facecolor('lightgrey')
ax.set_title('how2matplotlib.com Background')
plt.show()
Output:
These examples provide a glimpse into the flexibility and power of Matplotlib artists. By understanding and manipulating artists, you can create a wide range of customized plots and visualizations. Whether you’re working with basic shapes, text, or more complex collections, artists are the building blocks that allow you to bring your data to life in visually compelling ways.