Mastering Arrows in Matplotlib
Matplotlib is a comprehensive library for creating static, animated, and interactive visualizations in Python. One of the versatile features it offers is the ability to draw arrows. Arrows can be crucial for data visualization as they can indicate direction, show relationships, or highlight movements. This article will guide you through the process of mastering arrows in Matplotlib, providing detailed examples to enhance your plots.
Introduction to Arrows in Matplotlib
Before diving into the examples, it’s essential to understand the basics of drawing arrows in Matplotlib. The library offers several ways to draw arrows, but the most common methods are using the arrow() function and the FancyArrowPatch class. The arrow() function is straightforward and suitable for simple arrows, while FancyArrowPatch offers more customization options.
Drawing Simple Arrows
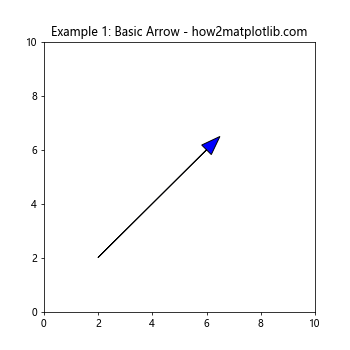
Let’s start with the simplest way to draw an arrow using the arrow() function.
Example 1: Basic Arrow
import matplotlib.pyplot as plt

plt.figure(figsize=(5, 5))
plt.axis([0, 10, 0, 10])
plt.arrow(2, 2, 4, 4, head_width=0.5, head_length=0.7, fc='blue', ec='black')
plt.title("Example 1: Basic Arrow - how2matplotlib.com")
plt.show()
Output:
Example 2: Multiple Arrows
import matplotlib.pyplot as plt

plt.figure(figsize=(5, 5))
plt.axis([0, 10, 0, 10])
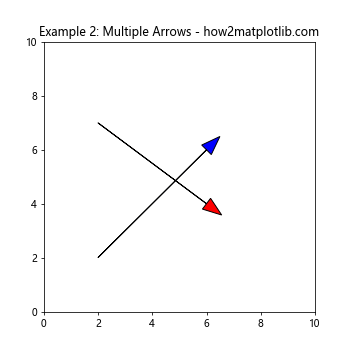
plt.arrow(2, 2, 4, 4, head_width=0.5, head_length=0.7, fc='blue', ec='black')
plt.arrow(2, 7, 4, -3, head_width=0.5, head_length=0.7, fc='red', ec='black')
plt.title("Example 2: Multiple Arrows - how2matplotlib.com")
plt.show()
Output:
Customizing Arrows
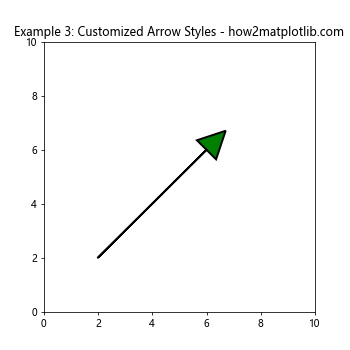
Moving beyond basic arrows, let’s explore how to customize arrows to make them more informative and visually appealing.
Example 3: Customized Arrow Styles
import matplotlib.pyplot as plt

plt.figure(figsize=(5, 5))
plt.axis([0, 10, 0, 10])
plt.arrow(2, 2, 4, 4, head_width=1, head_length=1, fc='green', ec='black', linewidth=2)
plt.title("Example 3: Customized Arrow Styles - how2matplotlib.com")
plt.show()
Output:
Example 4: Using Alpha for Transparency
import matplotlib.pyplot as plt

plt.figure(figsize=(5, 5))
plt.axis([0, 10, 0, 10])
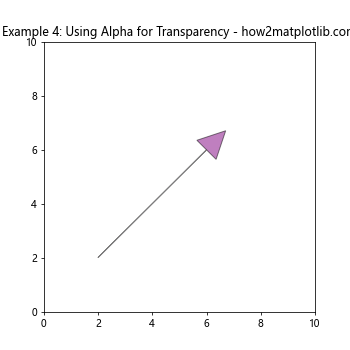
plt.arrow(2, 2, 4, 4, head_width=1, head_length=1, fc='purple', ec='black', alpha=0.5)
plt.title("Example 4: Using Alpha for Transparency - how2matplotlib.com")
plt.show()
Output:
Advanced Arrow Drawing with FancyArrowPatch
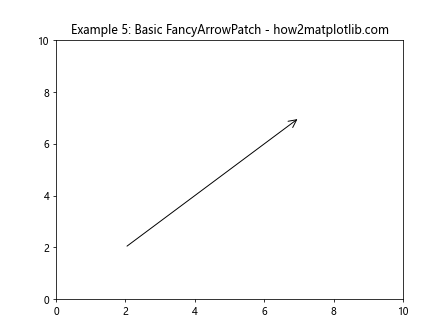
For more control over the appearance of arrows, the FancyArrowPatch class is the way to go. It allows for the creation of arrows with a high degree of customization.
Example 5: Basic FancyArrowPatch
import matplotlib.pyplot as plt
from matplotlib.patches import FancyArrowPatch

fig, ax = plt.subplots()
arrow = FancyArrowPatch((2, 2), (7, 7), arrowstyle='->', mutation_scale=20)
ax.add_patch(arrow)
ax.set_xlim(0, 10)
ax.set_ylim(0, 10)
plt.title("Example 5: Basic FancyArrowPatch - how2matplotlib.com")
plt.show()
Output:
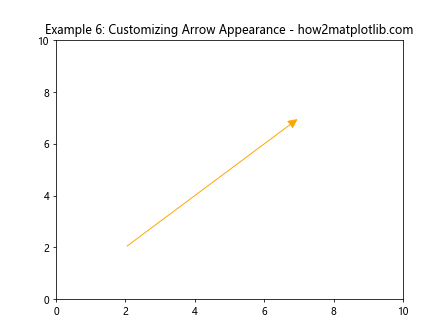
Example 6: Customizing Arrow Appearance
import matplotlib.pyplot as plt
from matplotlib.patches import FancyArrowPatch

fig, ax = plt.subplots()
arrow = FancyArrowPatch((2, 2), (7, 7), arrowstyle='-|>', color='orange', mutation_scale=20)
ax.add_patch(arrow)
ax.set_xlim(0, 10)
ax.set_ylim(0, 10)
plt.title("Example 6: Customizing Arrow Appearance - how2matplotlib.com")
plt.show()
Output:
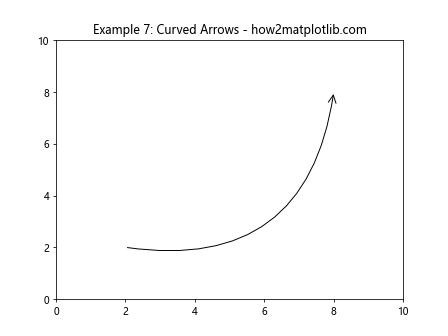
Example 7: Curved Arrows
import matplotlib.pyplot as plt
from matplotlib.patches import FancyArrowPatch

fig, ax = plt.subplots()
arrow = FancyArrowPatch((2, 2), (8, 8), connectionstyle="arc3,rad=.5", arrowstyle='->', mutation_scale=20)
ax.add_patch(arrow)
ax.set_xlim(0, 10)
ax.set_ylim(0, 10)
plt.title("Example 7: Curved Arrows - how2matplotlib.com")
plt.show()
Output:
Combining Arrows with Plots
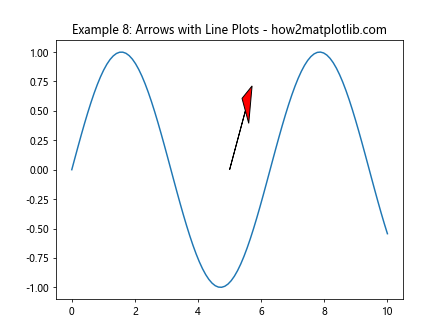
Arrows can be combined with other plot types to create more complex and informative visualizations.
Example 8: Arrows with Line Plots
import matplotlib.pyplot as plt
import numpy as np

x = np.linspace(0, 10, 100)
y = np.sin(x)

plt.plot(x, y)
plt.arrow(5, 0, 0.5, 0.5, head_width=0.3, head_length=0.3, fc='red', ec='black')
plt.title("Example 8: Arrows with Line Plots - how2matplotlib.com")
plt.show()
Output:
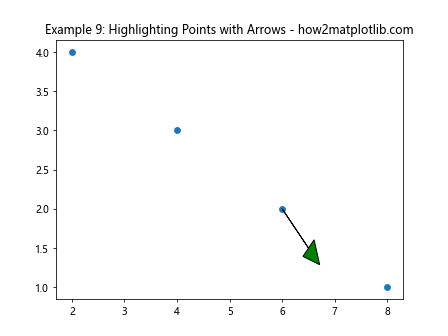
Example 9: Highlighting Points with Arrows
import matplotlib.pyplot as plt

plt.scatter([2, 4, 6, 8], [4, 3, 2, 1])
plt.arrow(6, 2, 0.5, -0.5, head_width=0.3, head_length=0.3, fc='green', ec='black')
plt.title("Example 9: Highlighting Points with Arrows - how2matplotlib.com")
plt.show()
Output:
Conclusion
Arrows are a powerful tool in data visualization, capable of adding direction, emphasis, and clarity to plots. Matplotlib provides flexible functions and classes to draw simple to complex arrows, catering to a wide range of visualization needs. By mastering the use of arrows in Matplotlib, you can enhance the effectiveness and aesthetics of your data visualizations.