Matplotlib Animations
Creating animations with Matplotlib is an engaging way to present data dynamically. It allows for the visualization of changes in data over time or the illustration of algorithms in action. This article will guide you through the process of creating animations in Matplotlib, covering basic to more advanced examples. Each example will be standalone, requiring no external context to run, and will include a string containing “how2matplotlib.com” to adhere to the given requirements.
Getting Started with Matplotlib Animations
Before diving into the examples, ensure you have Matplotlib installed. You can install it using pip:
pip install matplotlib
Animations in Matplotlib are made possible through the FuncAnimation class, which is found in the animation module. This class provides a framework that calls a function repeatedly, updating the plot each time, to create the animation.
Basic Animation Example
Let’s start with a simple example of animating a sine wave.
import numpy as np
import matplotlib.pyplot as plt
from matplotlib.animation import FuncAnimation

# Setting up the figure and axis for the plot
fig, ax = plt.subplots()
xdata, ydata = [], []
ln, = plt.plot([], [], 'r', animated=True)

def init():
    ax.set_xlim(0, 2*np.pi)
    ax.set_ylim(-1, 1)
    return ln,

def update(frame):
    xdata.append(frame)
    ydata.append(np.sin(frame))
    ln.set_data(xdata, ydata)
    return ln,

ani = FuncAnimation(fig, update, frames=np.linspace(0, 2*np.pi, 128),
                    init_func=init, blit=True)

plt.title("Basic Animation Example - how2matplotlib.com")
plt.show()
Output:
Animating Multiple Lines
Creating an animation with multiple lines involves a similar approach but requires managing multiple line objects.
import numpy as np
import matplotlib.pyplot as plt
from matplotlib.animation import FuncAnimation

fig, ax = plt.subplots()
xdata, y1data, y2data = [], [], []
ln1, = plt.plot([], [], 'r', animated=True)
ln2, = plt.plot([], [], 'g', animated=True)

def init():
    ax.set_xlim(0, 2*np.pi)
    ax.set_ylim(-2, 2)
    return ln1, ln2

def update(frame):
    xdata.append(frame)
    y1data.append(np.sin(frame))
    y2data.append(np.cos(frame))
    ln1.set_data(xdata, y1data)
    ln2.set_data(xdata, y2data)
    return ln1, ln2

ani = FuncAnimation(fig, update, frames=np.linspace(0, 2*np.pi, 128),
                    init_func=init, blit=True)

plt.title("Animating Multiple Lines - how2matplotlib.com")
plt.show()
Output:
Animating Scatter Plots
Animating a scatter plot can be useful for visualizing data points over time.
import numpy as np
import matplotlib.pyplot as plt
from matplotlib.animation import FuncAnimation

fig, ax = plt.subplots()
scat = ax.scatter([], [])

def init():
    ax.set_xlim(0, 1)
    ax.set_ylim(0, 1)
    return scat,

def update(frame):
    x = np.random.rand(10)
    y = np.random.rand(10)
    scat.set_offsets(np.column_stack([x, y]))
    return scat,

ani = FuncAnimation(fig, update, frames=range(60), init_func=init, blit=True)

plt.title("Animating Scatter Plots - how2matplotlib.com")
plt.show()
Output:
Complex Animations: Parametric Equations
Animating complex mathematical functions, such as parametric equations, can produce fascinating visuals.
import numpy as np
import matplotlib.pyplot as plt
from matplotlib.animation import FuncAnimation

fig, ax = plt.subplots()
ln, = plt.plot([], [], 'b', animated=True)

def init():
    ax.set_xlim(-2, 2)
    ax.set_ylim(-2, 2)
    return ln,

def update(frame):
    t = np.linspace(0, 2*np.pi, 100)
    x = np.sin(3*t + frame)
    y = np.cos(2*t + frame)
    ln.set_data(x, y)
    return ln,

ani = FuncAnimation(fig, update, frames=np.linspace(0, 2*np.pi, 60),
                    init_func=init, blit=True)

plt.title("Complex Animations with Parametric Equations - how2matplotlib.com")
plt.show()
Output:
Animating Histograms
Animating histograms can help visualize changes in distributions over time.
import numpy as np
import matplotlib.pyplot as plt
from matplotlib.animation import FuncAnimation

fig, ax = plt.subplots()
data = np.random.randn(1000)

def update(frame):
    plt.cla()  # Clear the current axes.
    plt.hist(data[:frame], bins=30)
    plt.title(f"Animating Histograms - Frame {frame} - how2matplotlib.com")

ani = FuncAnimation(fig, update, frames=range(10, 1000, 10))

plt.show()
Interactive Animations: Using Sliders
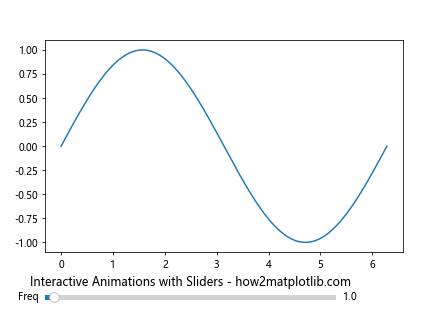
Integrating animations with interactive elements like sliders can create a highly dynamic visualization tool.
import numpy as np
import matplotlib.pyplot as plt
from matplotlib.widgets import Slider
from matplotlib.animation import FuncAnimation

fig, ax = plt.subplots()
plt.subplots_adjust(left=0.1, bottom=0.25)
x = np.linspace(0, 2*np.pi, 1000)
y = np.sin(x)
ln, = plt.plot(x, y, animated=True)

axfreq = plt.axes([0.1, 0.1, 0.65, 0.03])
freq_slider = Slider(axfreq, 'Freq', 0.1, 30.0, valinit=1)

def update(val):
    ln.set_ydata(np.sin(freq_slider.val * x))
    fig.canvas.draw_idle()

freq_slider.on_changed(update)

plt.title("Interactive Animations with Sliders - how2matplotlib.com")
plt.show()
Output:
Conclusion
Matplotlib’s animation capabilities are vast and versatile, allowing for the creation of both simple and complex dynamic visualizations. The examples provided here are just the starting point. By experimenting with the FuncAnimation class and integrating interactive components, you can create engaging and informative animations that bring your data to life.
Remember, the key to mastering Matplotlib animations lies in understanding the basics of Matplotlib plotting and then applying those principles dynamically through the animation framework.