Matplotlib Anchored Artists
Matplotlib is a comprehensive library for creating static, animated, and interactive visualizations in Python. Anchored artists are a crucial part of creating informative and visually appealing plots. They allow for the placement of various elements such as legends, tables, or text boxes in a manner that is relative to the axes or figure, ensuring that these elements remain properly positioned even when the plot is resized. This article will delve into the use of anchored artists in Matplotlib, providing a detailed guide and examples to enhance your data visualization skills.
Introduction to Anchored Artists
Anchored artists in Matplotlib are objects that facilitate the placement of artists in a specific location inside the plot area. Unlike placing artists at absolute positions, anchored artists adjust their positions automatically when the figure size or axes limits change. This feature is particularly useful for creating dynamic and responsive plots.
Example 1: Basic Anchored Text
import matplotlib.pyplot as plt
from mpl_toolkits.axes_grid1.anchored_artists import AnchoredText

fig, ax = plt.subplots()
at = AnchoredText("how2matplotlib.com", prop=dict(size=15), frameon=True, loc='upper left')
ax.add_artist(at)
plt.show()
Example 2: Anchored Circle
import matplotlib.pyplot as plt
from matplotlib.patches import Circle
from mpl_toolkits.axes_grid1.anchored_artists import AnchoredOffsetbox

fig, ax = plt.subplots()
circle = Circle((0.5, 0.5), 0.1, edgecolor='red', facecolor='none')
ao = AnchoredOffsetbox(loc='lower right', child=circle, frameon=False)
ax.add_artist(ao)
plt.show()
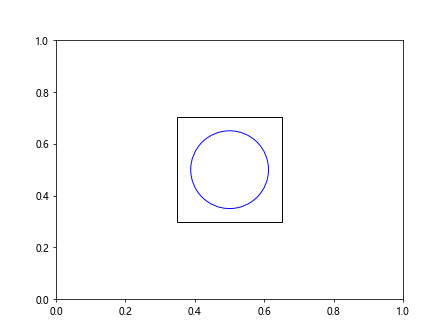
Example 3: Anchored Drawing Area
import matplotlib.pyplot as plt
from matplotlib.offsetbox import DrawingArea
from mpl_toolkits.axes_grid1.anchored_artists import AnchoredOffsetbox

fig, ax = plt.subplots()
da = DrawingArea(100, 100, 0, 0)
circle = plt.Circle((50, 50), 40, edgecolor='blue', facecolor='none')
da.add_artist(circle)

ao = AnchoredOffsetbox(loc='center', child=da, frameon=True)
ax.add_artist(ao)
plt.show()
Output:

Example 4: Anchored Legend with Custom Box
import matplotlib.pyplot as plt
from mpl_toolkits.axes_grid1.anchored_artists import AnchoredText

fig, ax = plt.subplots()
ax.plot([1, 2, 3], label="Line 1")
ax.plot([3, 2, 1], label="Line 2")

legend = ax.legend(loc='upper left', title="Legend")
at = AnchoredText("how2matplotlib.com", prop=dict(size=10), frameon=True, loc='lower right')
ax.add_artist(at)
plt.show()
Example 5: Anchored Image
import matplotlib.pyplot as plt
import matplotlib.image as mpimg
from mpl_toolkits.axes_grid1.anchored_artists import AnchoredOffsetbox

fig, ax = plt.subplots()
image = mpimg.imread('example.png')  # Ensure 'example.png' exists in your directory
imagebox = AnchoredOffsetbox(loc='upper right', child=plt.imshow(image), frameon=True)
ax.add_artist(imagebox)
plt.show()
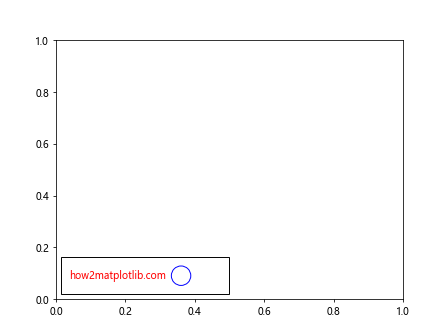
Example 6: Anchored Offsetbox with Multiple Children
import matplotlib.pyplot as plt
from matplotlib.offsetbox import TextArea, DrawingArea, HPacker
from mpl_toolkits.axes_grid1.anchored_artists import AnchoredOffsetbox

fig, ax = plt.subplots()

text_area = TextArea("how2matplotlib.com", textprops=dict(color="r", size=10, ha='left'))
drawing_area = DrawingArea(50, 20, 0, 0)
circle = plt.Circle((10, 10), 10, edgecolor='blue', facecolor='none')
drawing_area.add_artist(circle)

box = HPacker(children=[text_area, drawing_area], align="center", pad=5, sep=5)
anchored_box = AnchoredOffsetbox(loc='lower left', child=box, frameon=True)

ax.add_artist(anchored_box)
plt.show()
Output:

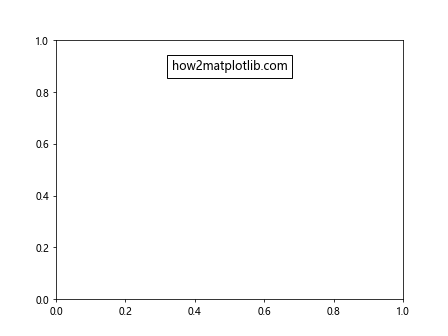
Example 7: Anchored Box with Custom Padding and Border
import matplotlib.pyplot as plt
from matplotlib.offsetbox import TextArea
from mpl_toolkits.axes_grid1.anchored_artists import AnchoredOffsetbox

fig, ax = plt.subplots()
text_area = TextArea("how2matplotlib.com", textprops=dict(color="black", size=12))
anchored_box = AnchoredOffsetbox(loc='upper center', child=text_area, pad=0.5, borderpad=1.5, frameon=True)

ax.add_artist(anchored_box)
plt.show()
Output:

Example 8: Anchored Box with Different Frame Styles
import matplotlib.pyplot as plt
from matplotlib.offsetbox import TextArea
from mpl_toolkits.axes_grid1.anchored_artists import AnchoredOffsetbox

fig, ax = plt.subplots()
text_area = TextArea("how2matplotlib.com", textprops=dict(color="green", size=12))
anchored_box = AnchoredOffsetbox(loc='center', child=text_area, frameon=True, boxstyle="round,pad=0.5")

ax.add_artist(anchored_box)
plt.show()
Example 9: Anchored Box with Arrow
import matplotlib.pyplot as plt
from matplotlib.offsetbox import TextArea
from mpl_toolkits.axes_grid1.anchored_artists import AnchoredOffsetbox

fig, ax = plt.subplots()
text_area = TextArea("how2matplotlib.com", textprops=dict(color="blue", size=12))
anchored_box = AnchoredOffsetbox(loc='lower right', child=text_area, frameon=True, boxstyle="rarrow,pad=0.5")

ax.add_artist(anchored_box)
plt.show()
Example 10: Anchored Box with Custom Background Color
import matplotlib.pyplot as plt
from matplotlib.offsetbox import TextArea
from mpl_toolkits.axes_grid1.anchored_artists import AnchoredOffsetbox

fig, ax = plt.subplots()
text_area = TextArea("how2matplotlib.com", textprops=dict(color="white", size=12))
anchored_box = AnchoredOffsetbox(loc='upper left', child=text_area, frameon=True, boxstyle="round,pad=0.5", bbox_to_anchor=(0.1, 0.9), bbox_transform=ax.transAxes, backgroundcolor="black")

ax.add_artist(anchored_box)
plt.show()
Conclusion
Anchored artists in Matplotlib offer a powerful and flexible way to add various elements to your plots. By using anchored artists, you can ensure that your annotations, legends, images, or custom drawings maintain their relative positions and sizes, making your visualizations more robust and easier to interpret. The examples provided in this article demonstrate the versatility of anchored artists and should serve as a solid foundation for incorporating these techniques into your own data visualization projects. Remember, the key to mastering Matplotlib lies in experimentation and practice, so don’t hesitate to modify these examples and explore the library’s extensive documentation to discover more about what you can achieve with anchored artists.