Mastering Matplotlib.artist.Artist.set_visible() in Python
Matplotlib.artist.Artist.set_visible() in Python is a powerful method that allows you to control the visibility of artists in Matplotlib plots. This function is an essential tool for creating dynamic and interactive visualizations. In this comprehensive guide, we’ll explore the various aspects of Matplotlib.artist.Artist.set_visible() and how it can enhance your data visualization projects.
Understanding Matplotlib.artist.Artist.set_visible()
Matplotlib.artist.Artist.set_visible() is a method that belongs to the Artist class in Matplotlib. It is used to set the visibility of an artist object, which can be any graphical element in a Matplotlib plot, such as lines, markers, text, or patches. By using this method, you can dynamically show or hide elements in your plots, creating more interactive and informative visualizations.
The basic syntax of Matplotlib.artist.Artist.set_visible() is as follows:
artist.set_visible(visible)
Where artist is any Matplotlib artist object, and visible is a boolean value (True or False) that determines whether the artist should be visible or not.
Let’s start with a simple example to demonstrate the usage of Matplotlib.artist.Artist.set_visible():
import matplotlib.pyplot as plt

# Create a figure and axis
fig, ax = plt.subplots()

# Plot a line
line, = ax.plot([1, 2, 3, 4], [1, 4, 2, 3], label='how2matplotlib.com')

# Set the line visibility to False
line.set_visible(False)

plt.legend()
plt.title('Matplotlib.artist.Artist.set_visible() Example')
plt.show()
Output:
In this example, we create a simple line plot and then use Matplotlib.artist.Artist.set_visible() to hide the line. When you run this code, you’ll see an empty plot with a legend, as the line has been made invisible.
Applying Matplotlib.artist.Artist.set_visible() to Different Artist Types
Matplotlib.artist.Artist.set_visible() can be applied to various types of artists in Matplotlib. Let’s explore how to use it with different plot elements:
Lines
import matplotlib.pyplot as plt

fig, ax = plt.subplots()

line1, = ax.plot([1, 2, 3, 4], [1, 4, 2, 3], label='Line 1 - how2matplotlib.com')
line2, = ax.plot([1, 2, 3, 4], [3, 2, 4, 1], label='Line 2 - how2matplotlib.com')

line1.set_visible(False)

plt.legend()
plt.title('Matplotlib.artist.Artist.set_visible() with Lines')
plt.show()
Output:
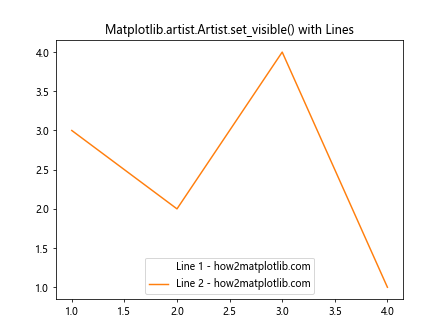
In this example, we plot two lines and use Matplotlib.artist.Artist.set_visible() to hide the first line while keeping the second line visible.
Markers
import matplotlib.pyplot as plt

fig, ax = plt.subplots()

scatter = ax.scatter([1, 2, 3, 4], [1, 4, 2, 3], label='Scatter - how2matplotlib.com')
scatter.set_visible(False)

plt.legend()
plt.title('Matplotlib.artist.Artist.set_visible() with Markers')
plt.show()
Output:
This example demonstrates how to use Matplotlib.artist.Artist.set_visible() with scatter plots to hide the markers.
Text
import matplotlib.pyplot as plt

fig, ax = plt.subplots()

text = ax.text(0.5, 0.5, 'how2matplotlib.com', ha='center', va='center')
text.set_visible(False)

plt.title('Matplotlib.artist.Artist.set_visible() with Text')
plt.show()
Output:
Here, we create a text object and use Matplotlib.artist.Artist.set_visible() to hide it.
Patches
import matplotlib.pyplot as plt
import matplotlib.patches as patches

fig, ax = plt.subplots()

rect = patches.Rectangle((0.2, 0.2), 0.6, 0.6, fill=False, label='Rectangle - how2matplotlib.com')
ax.add_patch(rect)
rect.set_visible(False)

plt.legend()
plt.title('Matplotlib.artist.Artist.set_visible() with Patches')
plt.show()
Output:
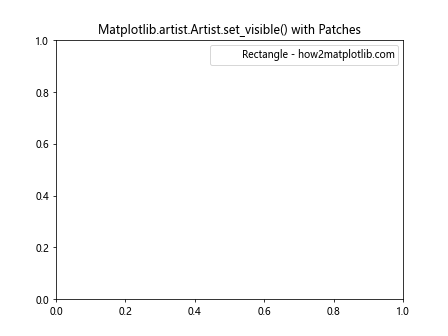
This example shows how to use Matplotlib.artist.Artist.set_visible() with patch objects, such as rectangles.
Dynamic Visibility Control with Matplotlib.artist.Artist.set_visible()
One of the most powerful applications of Matplotlib.artist.Artist.set_visible() is in creating interactive plots where the visibility of elements can be controlled dynamically. Let’s explore some examples:
Toggle Visibility with Buttons
import matplotlib.pyplot as plt
from matplotlib.widgets import Button

fig, ax = plt.subplots()

line, = ax.plot([1, 2, 3, 4], [1, 4, 2, 3], label='how2matplotlib.com')

def toggle_visibility(event):
    line.set_visible(not line.get_visible())
    fig.canvas.draw()

ax_button = plt.axes([0.81, 0.05, 0.1, 0.075])
button = Button(ax_button, 'Toggle')
button.on_clicked(toggle_visibility)

plt.title('Matplotlib.artist.Artist.set_visible() with Button')
plt.show()
Output:
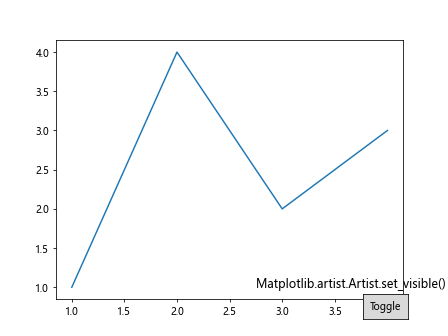
This example creates a button that toggles the visibility of a line using Matplotlib.artist.Artist.set_visible().
Visibility Control with Sliders
import matplotlib.pyplot as plt
from matplotlib.widgets import Slider

fig, ax = plt.subplots()

line, = ax.plot([1, 2, 3, 4], [1, 4, 2, 3], label='how2matplotlib.com')

ax_slider = plt.axes([0.2, 0.02, 0.6, 0.03])
slider = Slider(ax_slider, 'Visibility', 0, 1, valinit=1)

def update(val):
    line.set_visible(val >= 0.5)
    fig.canvas.draw()

slider.on_changed(update)

plt.title('Matplotlib.artist.Artist.set_visible() with Slider')
plt.show()
Output:
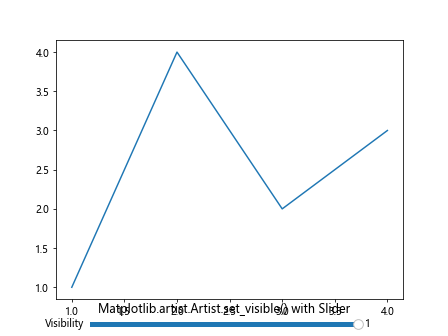
In this example, we use a slider to control the visibility of a line using Matplotlib.artist.Artist.set_visible().
Advanced Techniques with Matplotlib.artist.Artist.set_visible()
Now that we’ve covered the basics, let’s explore some more advanced techniques using Matplotlib.artist.Artist.set_visible():
Layered Visibility
import matplotlib.pyplot as plt
import numpy as np

fig, ax = plt.subplots()

x = np.linspace(0, 10, 100)
y1 = np.sin(x)
y2 = np.cos(x)
y3 = np.tan(x)

line1, = ax.plot(x, y1, label='Sin - how2matplotlib.com')
line2, = ax.plot(x, y2, label='Cos - how2matplotlib.com')
line3, = ax.plot(x, y3, label='Tan - how2matplotlib.com')

lines = [line1, line2, line3]

def toggle_visibility(event):
    if event.key in '123':
        index = int(event.key) - 1
        lines[index].set_visible(not lines[index].get_visible())
        plt.legend()
        fig.canvas.draw()

fig.canvas.mpl_connect('key_press_event', toggle_visibility)

plt.legend()
plt.title('Matplotlib.artist.Artist.set_visible() with Layered Visibility')
plt.show()
Output:
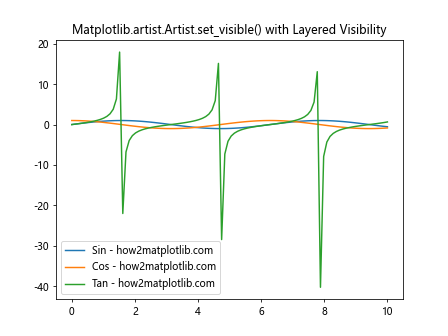
This example demonstrates how to use Matplotlib.artist.Artist.set_visible() to create a layered plot where you can toggle the visibility of different functions using keyboard inputs.
Animated Visibility Changes
import matplotlib.pyplot as plt
import matplotlib.animation as animation
import numpy as np

fig, ax = plt.subplots()

x = np.linspace(0, 2 * np.pi, 100)
line, = ax.plot(x, np.sin(x), label='how2matplotlib.com')

def animate(frame):
    line.set_visible(frame % 2 == 0)
    return line,

ani = animation.FuncAnimation(fig, animate, frames=20, interval=500, blit=True)

plt.title('Matplotlib.artist.Artist.set_visible() with Animation')
plt.show()
Output:
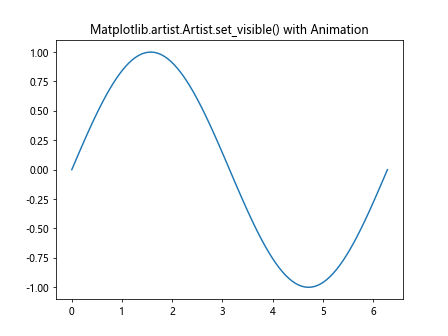
This example uses Matplotlib.artist.Artist.set_visible() in combination with animation to create a blinking effect for a sine wave.
Visibility Based on Data Values
import matplotlib.pyplot as plt
import numpy as np

fig, ax = plt.subplots()

x = np.linspace(0, 10, 100)
y = np.sin(x)

line, = ax.plot(x, y, 'o-', label='how2matplotlib.com')

threshold = 0.5
for i, yi in enumerate(y):
    if abs(yi) < threshold:
        line.get_path().vertices[i, 1] = np.nan

line.set_visible(True)

plt.title('Matplotlib.artist.Artist.set_visible() with Data-based Visibility')
plt.show()
Output:
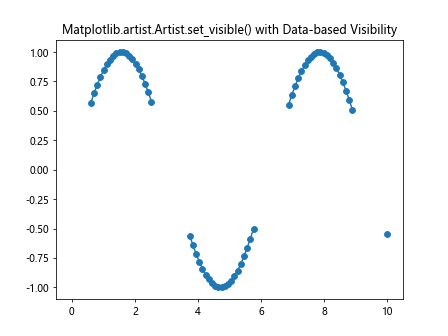
In this example, we use Matplotlib.artist.Artist.set_visible() in combination with data manipulation to show only parts of a line that meet certain criteria.
Best Practices for Using Matplotlib.artist.Artist.set_visible()
When working with Matplotlib.artist.Artist.set_visible(), it's important to keep some best practices in mind:
- Performance Considerations: Changing visibility frequently can impact performance. Use Matplotlib.artist.Artist.set_visible() judiciously, especially in animations or interactive plots.
Combining with Other Methods: Matplotlib.artist.Artist.set_visible() works well in combination with other Matplotlib methods. For example, you can use it with
zorderto control both visibility and layering.Updating the Plot: Remember to call
fig.canvas.draw()after changing visibility to update the plot.Handling Legend: When using Matplotlib.artist.Artist.set_visible() with legend items, you may need to update the legend manually.
Let's look at an example that incorporates these best practices: