How to Use Matplotlib.artist.Artist.set_snap() in Python
Matplotlib.artist.Artist.set_snap() in Python is a powerful method that allows you to control the snapping behavior of artists in Matplotlib. This function is an essential tool for creating precise and visually appealing plots. In this comprehensive guide, we’ll explore the ins and outs of Matplotlib.artist.Artist.set_snap() in Python, providing detailed explanations and numerous examples to help you master this feature.
Understanding Matplotlib.artist.Artist.set_snap() in Python
Matplotlib.artist.Artist.set_snap() in Python is a method that belongs to the Artist class in Matplotlib. It is used to set the snapping behavior of an artist, which determines how the artist is aligned with pixel boundaries. This can be particularly useful when you want to ensure that your plots are rendered crisply and without any blurring or anti-aliasing artifacts.
The syntax for using Matplotlib.artist.Artist.set_snap() in Python is as follows:
artist.set_snap(snap)
Where artist is an instance of a Matplotlib artist (such as a line, patch, or text object), and snap is a boolean value or None. When snap is set to True, the artist will snap to pixel boundaries. When set to False, no snapping will occur. If snap is None, the snapping behavior will be determined by the global snapping setting.
Let’s dive into some examples to see how Matplotlib.artist.Artist.set_snap() in Python works in practice.
Basic Usage of Matplotlib.artist.Artist.set_snap() in Python
To start, let’s create a simple line plot and apply the set_snap() method to it.
import matplotlib.pyplot as plt
import numpy as np

# Create data for the plot
x = np.linspace(0, 10, 100)
y = np.sin(x)

# Create the plot
fig, ax = plt.subplots()
line, = ax.plot(x, y, label='Sine wave')

# Apply set_snap() to the line
line.set_snap(True)

plt.title('Sine Wave with Snapping - how2matplotlib.com')
plt.xlabel('X-axis')
plt.ylabel('Y-axis')
plt.legend()
plt.show()
Output:
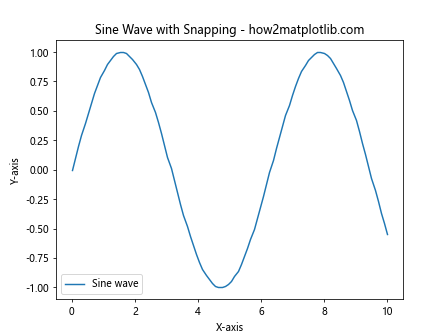
In this example, we create a simple sine wave plot and apply set_snap(True) to the line object. This ensures that the line will snap to pixel boundaries, potentially resulting in a crisper appearance.
Comparing Snapped and Unsnapped Artists in Matplotlib
To better understand the effect of Matplotlib.artist.Artist.set_snap() in Python, let’s create a comparison between snapped and unsnapped artists.
import matplotlib.pyplot as plt
import numpy as np

# Create data for the plot
x = np.linspace(0, 10, 100)
y1 = np.sin(x)
y2 = np.cos(x)

# Create the plot
fig, (ax1, ax2) = plt.subplots(1, 2, figsize=(12, 5))

# Plot with snapping
line1, = ax1.plot(x, y1, label='Sine wave')
line1.set_snap(True)
ax1.set_title('Snapped - how2matplotlib.com')

# Plot without snapping
line2, = ax2.plot(x, y2, label='Cosine wave')
line2.set_snap(False)
ax2.set_title('Unsnapped - how2matplotlib.com')

plt.tight_layout()
plt.show()
Output:
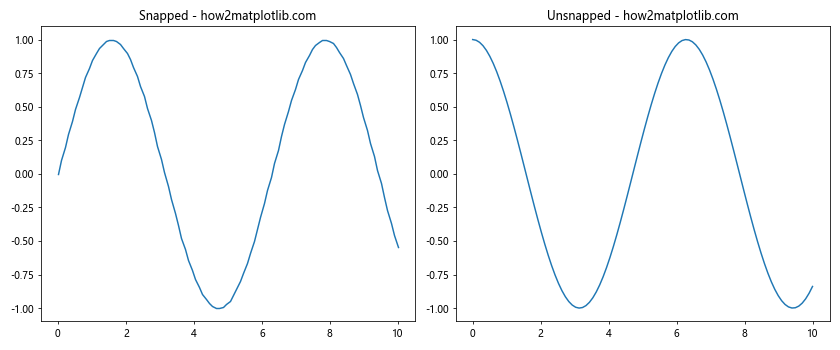
This example creates two subplots side by side, one with snapping enabled and one without. This allows for a direct comparison of the visual differences between snapped and unsnapped artists.
Applying Matplotlib.artist.Artist.set_snap() to Different Artist Types
Matplotlib.artist.Artist.set_snap() in Python can be applied to various types of artists, not just lines. Let’s explore how to use it with different artist types.
Rectangles
import matplotlib.pyplot as plt
import matplotlib.patches as patches

fig, ax = plt.subplots()

# Create a rectangle
rect = patches.Rectangle((0.1, 0.1), 0.5, 0.5, fill=False)
ax.add_patch(rect)

# Apply set_snap() to the rectangle
rect.set_snap(True)

ax.set_xlim(0, 1)
ax.set_ylim(0, 1)
plt.title('Snapped Rectangle - how2matplotlib.com')
plt.show()
Output:
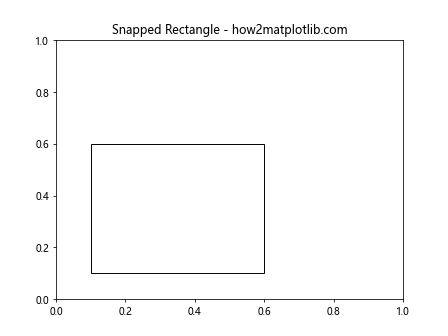
In this example, we create a rectangle patch and apply set_snap(True) to it. This ensures that the edges of the rectangle align with pixel boundaries.
Circles
import matplotlib.pyplot as plt
import matplotlib.patches as patches

fig, ax = plt.subplots()

# Create a circle
circle = patches.Circle((0.5, 0.5), 0.3, fill=False)
ax.add_patch(circle)

# Apply set_snap() to the circle
circle.set_snap(True)

ax.set_xlim(0, 1)
ax.set_ylim(0, 1)
plt.title('Snapped Circle - how2matplotlib.com')
plt.show()
Output:
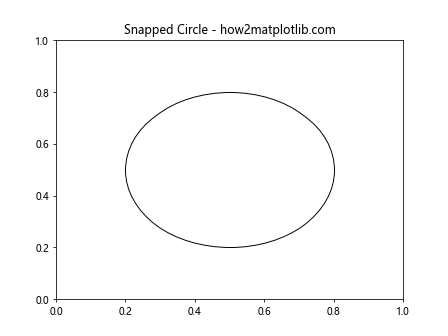
Here, we create a circle patch and apply set_snap(True) to it. This can help ensure that the circle’s outline is rendered crisply.
Text
import matplotlib.pyplot as plt

fig, ax = plt.subplots()

# Create text
text = ax.text(0.5, 0.5, 'how2matplotlib.com', ha='center', va='center')

# Apply set_snap() to the text
text.set_snap(True)

ax.set_xlim(0, 1)
ax.set_ylim(0, 1)
plt.title('Snapped Text - how2matplotlib.com')
plt.show()
Output:
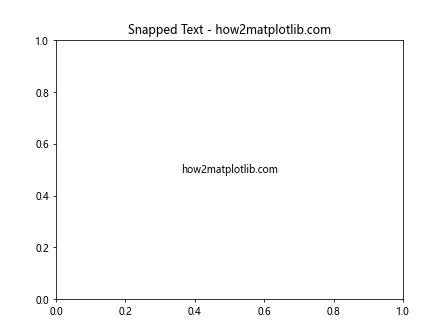
In this example, we create a text object and apply set_snap(True) to it. This can help ensure that the text is aligned with pixel boundaries for crisp rendering.
Using Matplotlib.artist.Artist.set_snap() with Complex Plots
Matplotlib.artist.Artist.set_snap() in Python can also be applied to more complex plots with multiple elements. Let’s explore some examples.
Bar Plot with Snapping
import matplotlib.pyplot as plt
import numpy as np

categories = ['A', 'B', 'C', 'D', 'E']
values = [3, 7, 2, 5, 8]

fig, ax = plt.subplots()
bars = ax.bar(categories, values)

# Apply set_snap() to each bar
for bar in bars:
    bar.set_snap(True)

plt.title('Bar Plot with Snapping - how2matplotlib.com')
plt.xlabel('Categories')
plt.ylabel('Values')
plt.show()
Output:
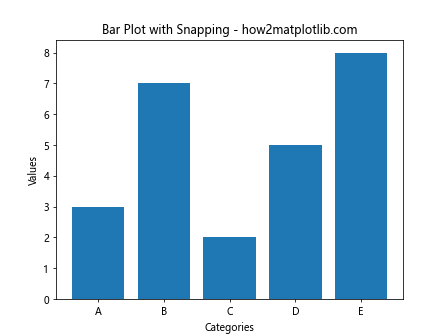
In this example, we create a bar plot and apply set_snap(True) to each bar individually. This can help ensure that the edges of the bars align with pixel boundaries.
Scatter Plot with Snapping
import matplotlib.pyplot as plt
import numpy as np

# Generate random data
np.random.seed(42)
x = np.random.rand(50)
y = np.random.rand(50)

fig, ax = plt.subplots()
scatter = ax.scatter(x, y)

# Apply set_snap() to the scatter plot
scatter.set_snap(True)

plt.title('Scatter Plot with Snapping - how2matplotlib.com')
plt.xlabel('X-axis')
plt.ylabel('Y-axis')
plt.show()
Output:
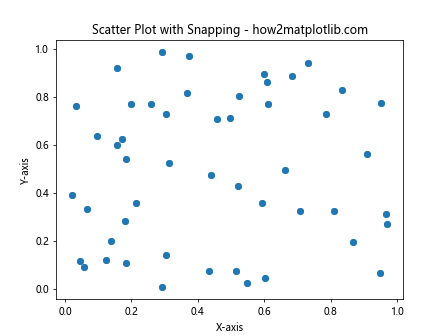
Here, we create a scatter plot and apply set_snap(True) to the entire scatter object. This can help ensure that each point in the scatter plot aligns with pixel boundaries.
Advanced Techniques with Matplotlib.artist.Artist.set_snap() in Python
Now that we’ve covered the basics, let’s explore some more advanced techniques using Matplotlib.artist.Artist.set_snap() in Python.
Combining Snapped and Unsnapped Elements
import matplotlib.pyplot as plt
import numpy as np

x = np.linspace(0, 10, 100)
y1 = np.sin(x)
y2 = np.cos(x)

fig, ax = plt.subplots()

# Create two lines, one snapped and one unsnapped
line1, = ax.plot(x, y1, label='Snapped Sine')
line2, = ax.plot(x, y2, label='Unsnapped Cosine')

line1.set_snap(True)
line2.set_snap(False)

plt.title('Combining Snapped and Unsnapped Lines - how2matplotlib.com')
plt.xlabel('X-axis')
plt.ylabel('Y-axis')
plt.legend()
plt.show()
Output:
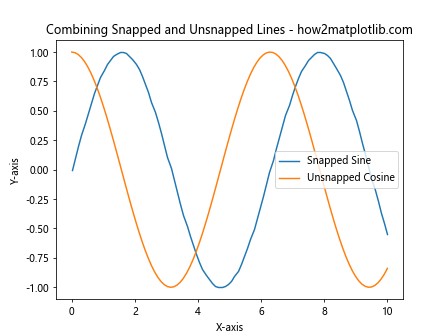
This example demonstrates how you can combine snapped and unsnapped elements in the same plot, allowing for fine-grained control over the rendering of different components.
Best Practices for Using Matplotlib.artist.Artist.set_snap() in Python
When working with Matplotlib.artist.Artist.set_snap() in Python, there are several best practices to keep in mind:
- Use snapping judiciously: While snapping can improve the crispness of your plots, it’s not always necessary or beneficial. Use it when you need precise alignment with pixel boundaries.
Consider performance: Enabling snapping for many artists in a complex plot may impact performance. Use it selectively on the most important elements.
Test different settings: The effect of snapping can vary depending on the specific plot and output format. Experiment with different settings to find what works best for your particular use case.
Combine with other methods: Matplotlib.artist.Artist.set_snap() in Python can be used in conjunction with other Matplotlib methods to achieve the desired visual effect.
Let’s look at an example that demonstrates these best practices: