Mastering Matplotlib.artist.Artist.set_clip_path() in Python
Matplotlib.artist.Artist.set_clip_path() in Python is a powerful method that allows you to control the visibility of artists in your plots. This function is an essential tool for creating sophisticated and visually appealing visualizations. In this comprehensive guide, we’ll explore the ins and outs of Matplotlib.artist.Artist.set_clip_path(), providing detailed explanations and practical examples to help you master this technique.
Understanding Matplotlib.artist.Artist.set_clip_path()
Matplotlib.artist.Artist.set_clip_path() is a method that belongs to the Artist class in Matplotlib. It is used to set the clip path for an artist, which determines the visible region of the artist. By using this method, you can create complex shapes and mask certain parts of your plot, adding depth and interest to your visualizations.
The basic syntax for Matplotlib.artist.Artist.set_clip_path() is as follows:
artist.set_clip_path(path, transform=None)
Here, artist is the Matplotlib artist object you want to apply the clip path to, path is the Path object defining the clipping region, and transform is an optional transform to apply to the clip path.
Let’s dive into some examples to see how Matplotlib.artist.Artist.set_clip_path() works in practice.
Basic Usage of Matplotlib.artist.Artist.set_clip_path()
To start, let’s create a simple example that demonstrates the basic usage of Matplotlib.artist.Artist.set_clip_path():
import matplotlib.pyplot as plt
import numpy as np
from matplotlib.patches import Circle, Rectangle

fig, ax = plt.subplots(figsize=(8, 6))

# Create a circle
circle = Circle((0.5, 0.5), 0.4, facecolor='blue', alpha=0.5)
ax.add_patch(circle)

# Create a rectangle to use as a clip path
rect = Rectangle((0.3, 0.3), 0.4, 0.4, facecolor='none', edgecolor='red')
ax.add_patch(rect)

# Set the rectangle as the clip path for the circle
circle.set_clip_path(rect)

ax.set_xlim(0, 1)
ax.set_ylim(0, 1)
ax.set_title('Basic Usage of Matplotlib.artist.Artist.set_clip_path()', fontsize=12)
ax.text(0.5, 0.05, 'how2matplotlib.com', ha='center', fontsize=10)

plt.show()
Output:
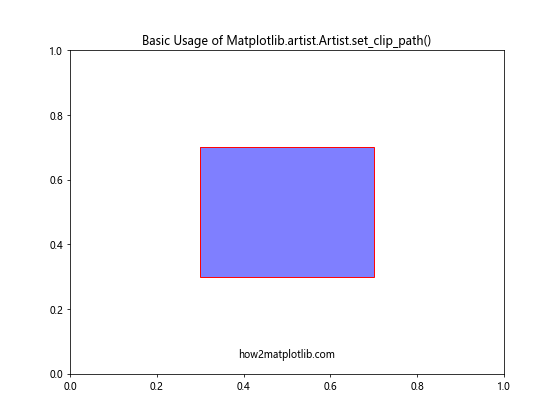
In this example, we create a circle and a rectangle. We then use Matplotlib.artist.Artist.set_clip_path() to set the rectangle as the clip path for the circle. This results in only the portion of the circle that falls within the rectangle being visible.
Creating Complex Clip Paths
Matplotlib.artist.Artist.set_clip_path() is not limited to simple shapes. You can create complex clip paths using the Path class. Here’s an example that demonstrates this:
import matplotlib.pyplot as plt
import numpy as np
from matplotlib.path import Path
from matplotlib.patches import PathPatch

fig, ax = plt.subplots(figsize=(8, 6))

# Create a complex path
vertices = np.array([(0, 0), (0.5, 0.5), (1, 0), (0.5, 1), (0, 0)])
codes = [Path.MOVETO, Path.CURVE4, Path.CURVE4, Path.CURVE4, Path.CLOSEPOLY]
path = Path(vertices, codes)

# Create a patch from the path
patch = PathPatch(path, facecolor='none', edgecolor='red')
ax.add_patch(patch)

# Create a scatter plot
x = np.random.rand(1000)
y = np.random.rand(1000)
scatter = ax.scatter(x, y, c='blue', alpha=0.5)

# Set the complex path as the clip path for the scatter plot
scatter.set_clip_path(patch)

ax.set_xlim(0, 1)
ax.set_ylim(0, 1)
ax.set_title('Complex Clip Path with Matplotlib.artist.Artist.set_clip_path()', fontsize=12)
ax.text(0.5, 0.05, 'how2matplotlib.com', ha='center', fontsize=10)

plt.show()
Output:
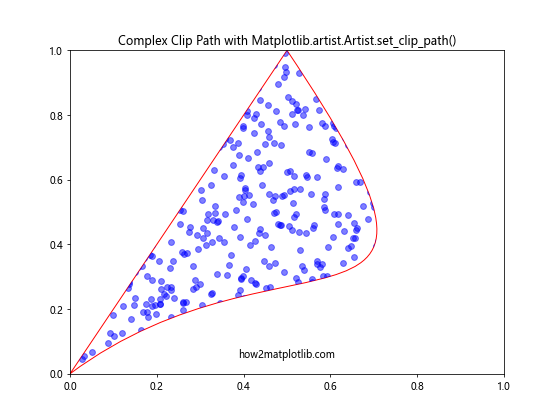
In this example, we create a complex path using the Path class and use it as a clip path for a scatter plot. This demonstrates how Matplotlib.artist.Artist.set_clip_path() can be used with more intricate shapes.
Using Matplotlib.artist.Artist.set_clip_path() with Text
Matplotlib.artist.Artist.set_clip_path() can also be used with text objects. This can be useful for creating interesting text effects. Here’s an example:
import matplotlib.pyplot as plt
import numpy as np
from matplotlib.patches import Circle

fig, ax = plt.subplots(figsize=(8, 6))

# Create a large text
text = ax.text(0.5, 0.5, 'how2matplotlib.com', fontsize=40, ha='center', va='center')

# Create a circle to use as a clip path
circle = Circle((0.5, 0.5), 0.3, facecolor='none', edgecolor='red')
ax.add_patch(circle)

# Set the circle as the clip path for the text
text.set_clip_path(circle)

ax.set_xlim(0, 1)
ax.set_ylim(0, 1)
ax.set_title('Text Clipping with Matplotlib.artist.Artist.set_clip_path()', fontsize=12)

plt.show()
Output:
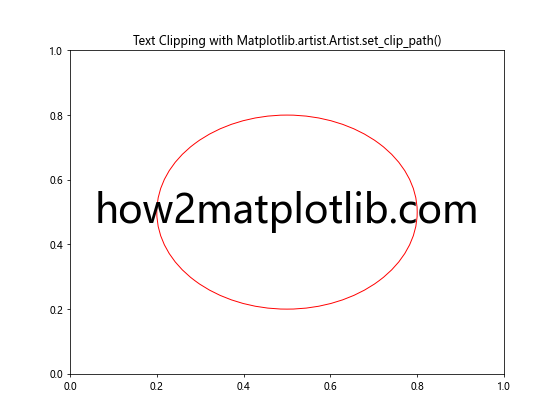
In this example, we create a large text and use a circle as its clip path. This results in only the portion of the text within the circle being visible.
Animating Clip Paths
Matplotlib.artist.Artist.set_clip_path() can be used to create interesting animations. Here’s an example that demonstrates how to animate a clip path:
import matplotlib.pyplot as plt
import numpy as np
from matplotlib.patches import Circle
from matplotlib.animation import FuncAnimation

fig, ax = plt.subplots(figsize=(8, 6))

# Create a scatter plot
x = np.random.rand(1000)
y = np.random.rand(1000)
scatter = ax.scatter(x, y, c='blue', alpha=0.5)

# Create a circle to use as a clip path
clip_circle = Circle((0.5, 0.5), 0, facecolor='none', edgecolor='red')
ax.add_patch(clip_circle)

# Animation function
def animate(frame):
    radius = frame / 100
    clip_circle.set_radius(radius)
    scatter.set_clip_path(clip_circle)
    return scatter,

# Create the animation
anim = FuncAnimation(fig, animate, frames=100, interval=50, blit=True)

ax.set_xlim(0, 1)
ax.set_ylim(0, 1)
ax.set_title('Animated Clip Path with Matplotlib.artist.Artist.set_clip_path()', fontsize=12)
ax.text(0.5, 0.05, 'how2matplotlib.com', ha='center', fontsize=10)

plt.show()
Output:
In this example, we create a scatter plot and use an expanding circle as its clip path. The animation shows the circle growing and revealing more of the scatter plot.
Using Multiple Clip Paths
Matplotlib.artist.Artist.set_clip_path() allows you to use multiple clip paths on a single artist. This can be achieved by combining paths. Here’s an example:
import matplotlib.pyplot as plt
import numpy as np
from matplotlib.path import Path
from matplotlib.patches import PathPatch

fig, ax = plt.subplots(figsize=(8, 6))

# Create two circles
circle1 = Path.circle((0.3, 0.5), 0.2)
circle2 = Path.circle((0.7, 0.5), 0.2)

# Combine the circles
combined_path = Path.make_compound_path(circle1, circle2)

# Create a patch from the combined path
patch = PathPatch(combined_path, facecolor='none', edgecolor='red')
ax.add_patch(patch)

# Create a scatter plot
x = np.random.rand(1000)
y = np.random.rand(1000)
scatter = ax.scatter(x, y, c='blue', alpha=0.5)

# Set the combined path as the clip path for the scatter plot
scatter.set_clip_path(patch)

ax.set_xlim(0, 1)
ax.set_ylim(0, 1)
ax.set_title('Multiple Clip Paths with Matplotlib.artist.Artist.set_clip_path()', fontsize=12)
ax.text(0.5, 0.05, 'how2matplotlib.com', ha='center', fontsize=10)

plt.show()
Output:
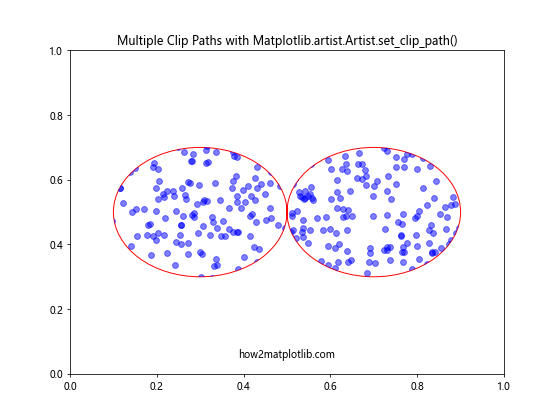
In this example, we create two circles and combine them into a single path. We then use this combined path as the clip path for a scatter plot.
Clip Path with Image
Matplotlib.artist.Artist.set_clip_path() can also be used with images. This can be useful for creating interesting image effects. Here’s an example:
import matplotlib.pyplot as plt
import numpy as np
from matplotlib.patches import Circle

fig, ax = plt.subplots(figsize=(8, 6))

# Create a random image
image = np.random.rand(100, 100)
im = ax.imshow(image, extent=[0, 1, 0, 1])

# Create a circle to use as a clip path
circle = Circle((0.5, 0.5), 0.3, facecolor='none', edgecolor='red')
ax.add_patch(circle)

# Set the circle as the clip path for the image
im.set_clip_path(circle)

ax.set_xlim(0, 1)
ax.set_ylim(0, 1)
ax.set_title('Image Clipping with Matplotlib.artist.Artist.set_clip_path()', fontsize=12)
ax.text(0.5, 0.05, 'how2matplotlib.com', ha='center', fontsize=10)

plt.show()
Output:
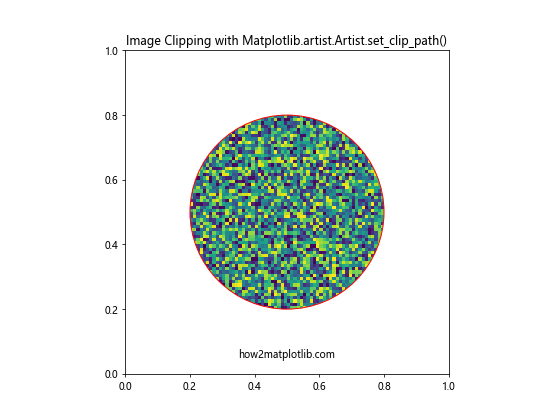
In this example, we create a random image and use a circle as its clip path. This results in only the portion of the image within the circle being visible.
Clip Path with Contour Plot
Matplotlib.artist.Artist.set_clip_path() can be used with contour plots to create interesting visualizations. Here’s an example:
import matplotlib.pyplot as plt
import numpy as np
from matplotlib.patches import Circle

fig, ax = plt.subplots(figsize=(8, 6))

# Create some data for the contour plot
x = np.linspace(-3, 3, 100)
y = np.linspace(-3, 3, 100)
X, Y = np.meshgrid(x, y)
Z = np.sin(X) * np.cos(Y)

# Create the contour plot
contour = ax.contourf(X, Y, Z)

# Create a circle to use as a clip path
circle = Circle((0, 0), 2, facecolor='none', edgecolor='red')
ax.add_patch(circle)

# Set the circle as the clip path for the contour plot
for collection in contour.collections:
    collection.set_clip_path(circle)

ax.set_xlim(-3, 3)
ax.set_ylim(-3, 3)
ax.set_title('Contour Plot Clipping with Matplotlib.artist.Artist.set_clip_path()', fontsize=12)
ax.text(0, -2.8, 'how2matplotlib.com', ha='center', fontsize=10)

plt.show()
Output:
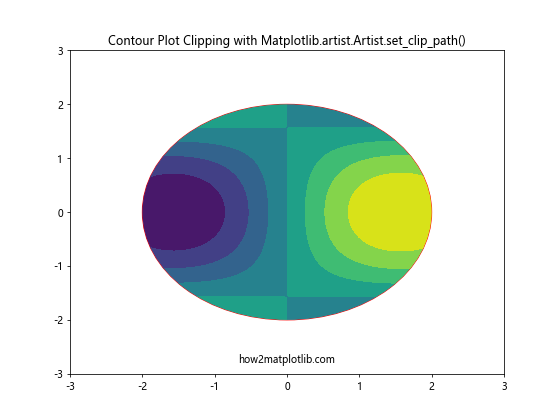
In this example, we create a contour plot and use a circle as its clip path. This results in only the portion of the contour plot within the circle being visible.
Conclusion
Matplotlib.artist.Artist.set_clip_path() is a powerful tool in the Matplotlib library that allows you to control the visibility of artists in your plots. Throughout this comprehensive guide, we’ve explored various applications of this method, from basic usage to more complex scenarios involving different types of plots and custom shapes.
We’ve seen how Matplotlib.artist.Artist.set_clip_path() can be used with different types of artists, including scatter plots, line plots, text, images, and even 3D plots. We’ve also demonstrated how it can be used with various types of clip paths, from simple shapes like circles and rectangles to more complex custom shapes.