How to Use Matplotlib.artist.Artist.set_clip_on() in Python
Matplotlib.artist.Artist.set_clip_on() in Python is a powerful method that allows you to control the clipping behavior of artists in Matplotlib. This function is an essential tool for customizing the appearance of your plots and managing how elements are displayed within the figure boundaries. In this comprehensive guide, we’ll explore the various aspects of Matplotlib.artist.Artist.set_clip_on() and demonstrate its usage through practical examples.
Understanding Matplotlib.artist.Artist.set_clip_on()
Matplotlib.artist.Artist.set_clip_on() is a method that belongs to the Artist class in Matplotlib. It is used to set whether an artist should be clipped by the axes bounding box or not. When clipping is enabled, any part of the artist that falls outside the axes limits will not be displayed. This can be particularly useful when you want to ensure that your plot elements stay within the designated plotting area.
The basic syntax of Matplotlib.artist.Artist.set_clip_on() is as follows:
artist.set_clip_on(b)
Where artist is any Matplotlib artist object (such as a Line2D, Patch, or Text), and b is a boolean value (True or False) that determines whether clipping should be enabled or disabled.
Let’s dive deeper into the usage and applications of Matplotlib.artist.Artist.set_clip_on() with some examples.
Basic Usage of Matplotlib.artist.Artist.set_clip_on()
To start, let’s create a simple example that demonstrates the basic usage of Matplotlib.artist.Artist.set_clip_on():
import matplotlib.pyplot as plt
import numpy as np

# Create data
x = np.linspace(0, 10, 100)
y = np.sin(x)

# Create a figure and axis
fig, ax = plt.subplots()

# Plot the data
line, = ax.plot(x, y, label='how2matplotlib.com')

# Set the x-axis limits
ax.set_xlim(2, 8)

# Disable clipping for the line
line.set_clip_on(False)

# Add labels and title
ax.set_xlabel('X-axis')
ax.set_ylabel('Y-axis')
ax.set_title('Matplotlib.artist.Artist.set_clip_on() Example')
ax.legend()

plt.show()
Output:
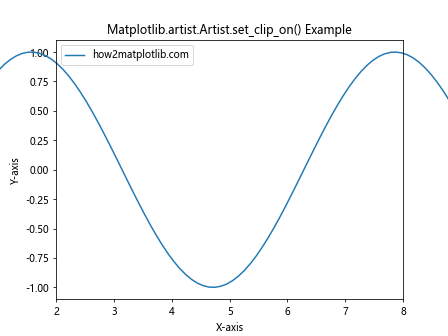
In this example, we create a simple sine wave plot and set the x-axis limits to [2, 8]. By default, the line would be clipped to these limits. However, by using line.set_clip_on(False), we disable clipping for the line, allowing it to extend beyond the axes boundaries.
Controlling Clipping for Different Artist Types
Matplotlib.artist.Artist.set_clip_on() can be applied to various types of artists in Matplotlib. Let’s explore how it works with different plot elements.
Lines
import matplotlib.pyplot as plt
import numpy as np

# Create data
x = np.linspace(0, 10, 100)
y1 = np.sin(x)
y2 = np.cos(x)

# Create a figure and axis
fig, ax = plt.subplots()

# Plot two lines
line1, = ax.plot(x, y1, label='Sine - how2matplotlib.com')
line2, = ax.plot(x, y2, label='Cosine - how2matplotlib.com')

# Set the x-axis limits
ax.set_xlim(2, 8)

# Disable clipping for line1, keep default clipping for line2
line1.set_clip_on(False)

# Add labels and title
ax.set_xlabel('X-axis')
ax.set_ylabel('Y-axis')
ax.set_title('Matplotlib.artist.Artist.set_clip_on() with Lines')
ax.legend()

plt.show()
Output:
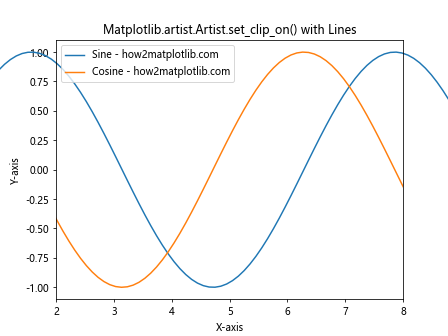
In this example, we plot two lines (sine and cosine) and disable clipping for the sine wave while keeping the default clipping for the cosine wave. This allows us to compare the behavior of clipped and unclipped lines within the same plot.
Scatter Plots
Matplotlib.artist.Artist.set_clip_on() can also be applied to scatter plots:
import matplotlib.pyplot as plt
import numpy as np

# Create data
np.random.seed(42)
x = np.random.rand(100) * 10
y = np.random.rand(100) * 10

# Create a figure and axis
fig, ax = plt.subplots()

# Create a scatter plot
scatter = ax.scatter(x, y, c=y, cmap='viridis', label='how2matplotlib.com')

# Set the axis limits
ax.set_xlim(2, 8)
ax.set_ylim(2, 8)

# Disable clipping for the scatter plot
scatter.set_clip_on(False)

# Add labels and title
ax.set_xlabel('X-axis')
ax.set_ylabel('Y-axis')
ax.set_title('Matplotlib.artist.Artist.set_clip_on() with Scatter Plot')
ax.legend()

plt.show()
Output:
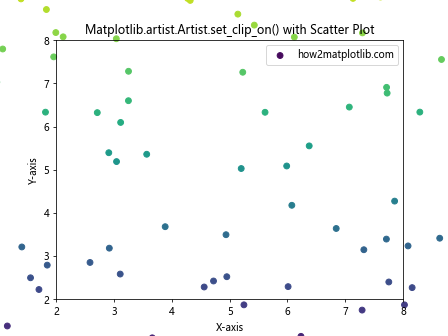
In this scatter plot example, we disable clipping for the scatter points, allowing them to be visible outside the set axis limits.
Text
Matplotlib.artist.Artist.set_clip_on() can be particularly useful when working with text elements:
import matplotlib.pyplot as plt

# Create a figure and axis
fig, ax = plt.subplots()

# Set the axis limits
ax.set_xlim(0, 10)
ax.set_ylim(0, 10)

# Add text inside and outside the axes
text_inside = ax.text(5, 5, 'Inside - how2matplotlib.com', ha='center', va='center')
text_outside = ax.text(12, 5, 'Outside - how2matplotlib.com', ha='left', va='center')

# Disable clipping for the outside text
text_outside.set_clip_on(False)

# Add labels and title
ax.set_xlabel('X-axis')
ax.set_ylabel('Y-axis')
ax.set_title('Matplotlib.artist.Artist.set_clip_on() with Text')

plt.show()
Output:
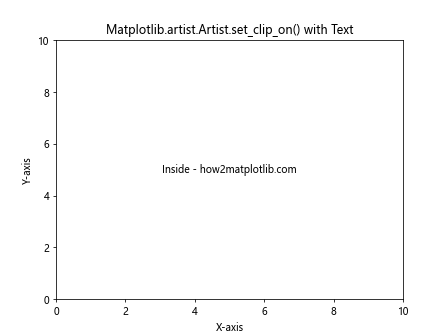
In this example, we add two text elements: one inside the axes and one outside. By disabling clipping for the outside text, we ensure it remains visible even though it’s positioned beyond the axes limits.
Advanced Applications of Matplotlib.artist.Artist.set_clip_on()
Now that we’ve covered the basics, let’s explore some more advanced applications of Matplotlib.artist.Artist.set_clip_on().
Combining Clipped and Unclipped Elements
You can create interesting visual effects by combining clipped and unclipped elements in the same plot:
import matplotlib.pyplot as plt
import numpy as np

# Create data
x = np.linspace(0, 10, 100)
y1 = np.sin(x)
y2 = np.cos(x)

# Create a figure and axis
fig, ax = plt.subplots()

# Plot two lines
line1, = ax.plot(x, y1, label='Sine - how2matplotlib.com')
line2, = ax.plot(x, y2, label='Cosine - how2matplotlib.com')

# Set the x-axis limits
ax.set_xlim(2, 8)

# Disable clipping for line1, keep default clipping for line2
line1.set_clip_on(False)

# Add a text annotation outside the axes
text = ax.text(9, 0, 'Unclipped Text - how2matplotlib.com', ha='left', va='center')
text.set_clip_on(False)

# Add a rectangle patch
rect = plt.Rectangle((1, -0.5), 1, 1, fill=False, edgecolor='red')
ax.add_patch(rect)
rect.set_clip_on(False)

# Add labels and title
ax.set_xlabel('X-axis')
ax.set_ylabel('Y-axis')
ax.set_title('Combining Clipped and Unclipped Elements')
ax.legend()

plt.show()
Output:
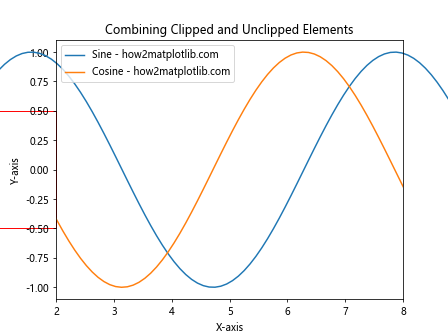
This example combines clipped and unclipped lines, text, and a rectangle patch to create a visually interesting plot that extends beyond the axes limits.
Animating Clipping Effects
Matplotlib.artist.Artist.set_clip_on() can be used to create interesting animations by dynamically changing the clipping state:
import matplotlib.pyplot as plt
import numpy as np
from matplotlib.animation import FuncAnimation

# Create data
x = np.linspace(0, 10, 100)
y = np.sin(x)

# Create a figure and axis
fig, ax = plt.subplots()

# Plot the data
line, = ax.plot(x, y, label='how2matplotlib.com')

# Set the x-axis limits
ax.set_xlim(0, 10)

# Add labels and title
ax.set_xlabel('X-axis')
ax.set_ylabel('Y-axis')
ax.set_title('Animating Matplotlib.artist.Artist.set_clip_on()')
ax.legend()

# Animation function
def animate(frame):
    clip_on = frame % 2 == 0
    line.set_clip_on(clip_on)
    return line,

# Create the animation
anim = FuncAnimation(fig, animate, frames=20, interval=500, blit=True)

plt.show()
Output:
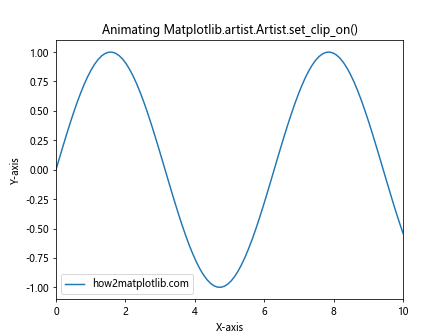
This animation alternates between clipped and unclipped states for the line plot, creating a blinking effect.
Best Practices and Tips for Using Matplotlib.artist.Artist.set_clip_on()
When working with Matplotlib.artist.Artist.set_clip_on(), keep the following best practices and tips in mind:
- Use sparingly: While disabling clipping can create interesting effects, it’s generally best to use it sparingly to maintain a clean and professional look in your plots.
Consider the context: Think about whether disabling clipping makes sense for your specific visualization. In some cases, it may be more appropriate to adjust the axes limits instead.
Combine with other methods: Matplotlib.artist.Artist.set_clip_on() can be powerful when combined with other Matplotlib methods like
set_clip_path()andset_clip_box().Be mindful of performance: Disabling clipping for many artists in a complex plot may impact rendering performance. Use it judiciously, especially when working with large datasets.
Test different configurations: Experiment with enabling and disabling clipping for different elements to find the most effective visual representation of your data.
Common Pitfalls and Troubleshooting
When using Matplotlib.artist.Artist.set_clip_on(), you may encounter some common issues. Here are a few troubleshooting tips: