How to Use Matplotlib.artist.Artist.get_zorder() in Python
Matplotlib.artist.Artist.get_zorder() in Python is a powerful method that allows you to retrieve the z-order of an Artist object in Matplotlib. The z-order determines the drawing order of artists, with higher values being drawn on top of lower values. This comprehensive guide will explore the various aspects of using get_zorder() and how it can enhance your data visualization projects.
Understanding Matplotlib.artist.Artist.get_zorder()
Matplotlib.artist.Artist.get_zorder() is a method that belongs to the Artist class in Matplotlib. It is used to retrieve the z-order value of an Artist object, which determines its drawing order relative to other artists in the same figure or axes. The z-order is a floating-point number, and artists with higher z-order values are drawn on top of those with lower values.
Let’s start with a simple example to demonstrate how to use get_zorder():
import matplotlib.pyplot as plt

fig, ax = plt.subplots()

# Create two rectangles
rect1 = plt.Rectangle((0.1, 0.1), 0.5, 0.5, facecolor='red')
rect2 = plt.Rectangle((0.3, 0.3), 0.5, 0.5, facecolor='blue')

# Add rectangles to the axes
ax.add_patch(rect1)
ax.add_patch(rect2)

# Get the z-order of the rectangles
print(f"Z-order of rect1: {rect1.get_zorder()}")
print(f"Z-order of rect2: {rect2.get_zorder()}")

plt.title("how2matplotlib.com - get_zorder() Example")
plt.show()
Output:
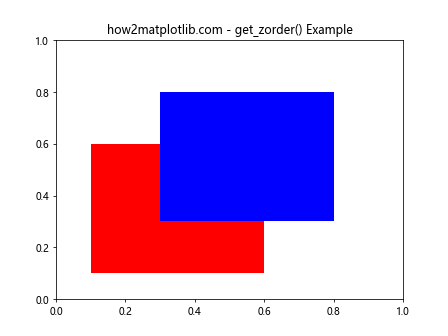
In this example, we create two rectangles and add them to the axes. We then use get_zorder() to retrieve the z-order of each rectangle. By default, artists are assigned increasing z-order values as they are added to the axes.
The Importance of Z-Order in Matplotlib
Understanding and manipulating z-order is crucial for creating visually appealing and accurate plots in Matplotlib. The z-order determines which elements are drawn on top of others, which can significantly impact the final appearance of your visualization.
Here’s an example that demonstrates the importance of z-order:
import matplotlib.pyplot as plt
import numpy as np

fig, ax = plt.subplots()

# Create data
x = np.linspace(0, 10, 100)
y1 = np.sin(x)
y2 = np.cos(x)

# Plot lines
line1 = ax.plot(x, y1, color='red', linewidth=2, label='Sin')
line2 = ax.plot(x, y2, color='blue', linewidth=2, label='Cos')

# Add a text annotation
text = ax.text(5, 0, "how2matplotlib.com", fontsize=12, ha='center', va='center', bbox=dict(facecolor='white', edgecolor='black'))

# Print z-orders
print(f"Z-order of line1: {line1[0].get_zorder()}")
print(f"Z-order of line2: {line2[0].get_zorder()}")
print(f"Z-order of text: {text.get_zorder()}")

plt.title("Z-order Importance in Matplotlib")
plt.legend()
plt.show()
Output:
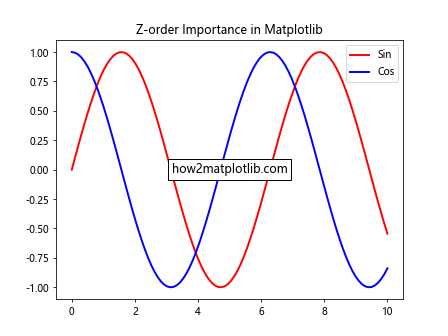
In this example, we plot two lines and add a text annotation. By using get_zorder(), we can see the default z-order values assigned to each element. Understanding these values helps us control the layering of elements in our plot.
Modifying Z-Order with set_zorder()
While get_zorder() allows us to retrieve the current z-order of an artist, we often need to modify the z-order to achieve the desired visual effect. This is where the set_zorder() method comes in handy. Let’s explore how to use set_zorder() in conjunction with get_zorder():
import matplotlib.pyplot as plt

fig, ax = plt.subplots()

# Create three circles
circle1 = plt.Circle((0.3, 0.3), 0.2, facecolor='red')
circle2 = plt.Circle((0.5, 0.5), 0.2, facecolor='green')
circle3 = plt.Circle((0.7, 0.7), 0.2, facecolor='blue')

# Add circles to the axes
ax.add_patch(circle1)
ax.add_patch(circle2)
ax.add_patch(circle3)

# Print initial z-orders
print("Initial z-orders:")
print(f"Circle 1: {circle1.get_zorder()}")
print(f"Circle 2: {circle2.get_zorder()}")
print(f"Circle 3: {circle3.get_zorder()}")

# Modify z-orders
circle1.set_zorder(3)
circle2.set_zorder(1)
circle3.set_zorder(2)

# Print updated z-orders
print("\nUpdated z-orders:")
print(f"Circle 1: {circle1.get_zorder()}")
print(f"Circle 2: {circle2.get_zorder()}")
print(f"Circle 3: {circle3.get_zorder()}")

ax.set_xlim(0, 1)
ax.set_ylim(0, 1)
plt.title("how2matplotlib.com - Modifying Z-order")
plt.show()
Output:
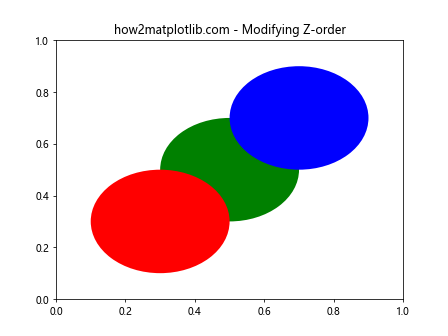
In this example, we create three circles and initially print their default z-orders using get_zorder(). We then use set_zorder() to modify the z-orders and print the updated values. This demonstrates how get_zorder() and set_zorder() can be used together to control the layering of elements in a plot.
Z-Order in Different Types of Plots
The concept of z-order applies to various types of plots in Matplotlib. Let’s explore how get_zorder() can be used with different plot types:
Line Plots
import matplotlib.pyplot as plt
import numpy as np

fig, ax = plt.subplots()

x = np.linspace(0, 10, 100)
y1 = np.sin(x)
y2 = np.cos(x)

line1 = ax.plot(x, y1, color='red', label='Sin')
line2 = ax.plot(x, y2, color='blue', label='Cos')

print(f"Z-order of sin line: {line1[0].get_zorder()}")
print(f"Z-order of cos line: {line2[0].get_zorder()}")

plt.title("how2matplotlib.com - Line Plot Z-order")
plt.legend()
plt.show()
Output:
Scatter Plots
import matplotlib.pyplot as plt
import numpy as np

fig, ax = plt.subplots()

x = np.random.rand(50)
y = np.random.rand(50)

scatter1 = ax.scatter(x, y, c='red', s=50, label='Group 1')
scatter2 = ax.scatter(x + 0.1, y + 0.1, c='blue', s=50, label='Group 2')

print(f"Z-order of scatter1: {scatter1.get_zorder()}")
print(f"Z-order of scatter2: {scatter2.get_zorder()}")

plt.title("how2matplotlib.com - Scatter Plot Z-order")
plt.legend()
plt.show()
Output:
Bar Plots
import matplotlib.pyplot as plt
import numpy as np

fig, ax = plt.subplots()

categories = ['A', 'B', 'C', 'D']
values1 = [4, 7, 2, 5]
values2 = [3, 6, 4, 3]

bar1 = ax.bar(categories, values1, label='Group 1')
bar2 = ax.bar(categories, values2, bottom=values1, label='Group 2')

print(f"Z-order of bar1: {bar1[0].get_zorder()}")
print(f"Z-order of bar2: {bar2[0].get_zorder()}")

plt.title("how2matplotlib.com - Bar Plot Z-order")
plt.legend()
plt.show()
Output:
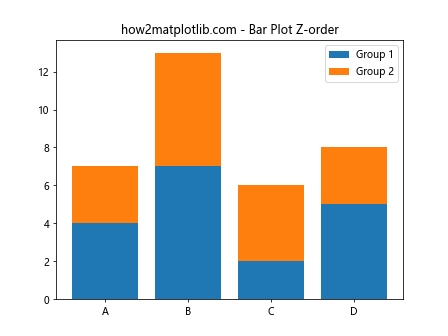
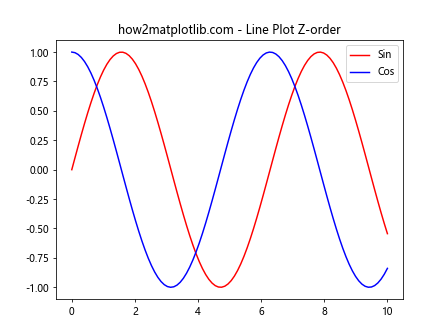
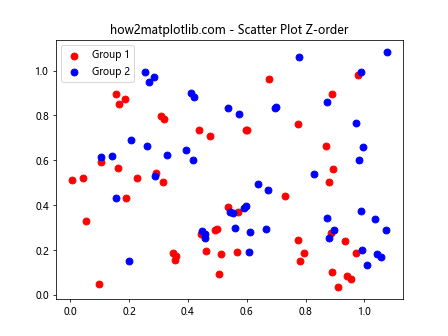
These examples demonstrate how get_zorder() can be used with different types of plots to understand and control the layering of elements.
Z-Order and Overlapping Elements
One of the most common use cases for manipulating z-order is when dealing with overlapping elements in a plot. Let’s explore how get_zorder() and set_zorder() can help us control the visibility of overlapping elements:
import matplotlib.pyplot as plt
import numpy as np

fig, ax = plt.subplots()

# Create overlapping circles
circle1 = plt.Circle((0.5, 0.5), 0.3, facecolor='red', alpha=0.5)
circle2 = plt.Circle((0.7, 0.7), 0.3, facecolor='blue', alpha=0.5)

ax.add_patch(circle1)
ax.add_patch(circle2)

print("Initial z-orders:")
print(f"Circle 1: {circle1.get_zorder()}")
print(f"Circle 2: {circle2.get_zorder()}")

# Swap z-orders
circle1.set_zorder(circle2.get_zorder() + 1)

print("\nUpdated z-orders:")
print(f"Circle 1: {circle1.get_zorder()}")
print(f"Circle 2: {circle2.get_zorder()}")

ax.set_xlim(0, 1)
ax.set_ylim(0, 1)
plt.title("how2matplotlib.com - Overlapping Elements Z-order")
plt.show()
Output:
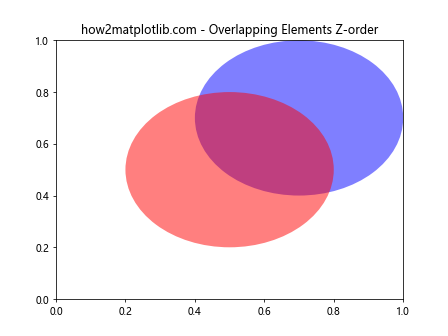
In this example, we create two overlapping circles and use get_zorder() to retrieve their initial z-orders. We then use set_zorder() to change the z-order of one circle, making it appear on top of the other.
Z-Order in Subplots
When working with subplots, it’s important to understand how z-order works across different axes. Let’s explore this concept:
import matplotlib.pyplot as plt
import numpy as np

fig, (ax1, ax2) = plt.subplots(1, 2, figsize=(10, 4))

# Subplot 1
x = np.linspace(0, 10, 100)
y1 = np.sin(x)
y2 = np.cos(x)

line1 = ax1.plot(x, y1, color='red', label='Sin')
line2 = ax1.plot(x, y2, color='blue', label='Cos')

print("Subplot 1 z-orders:")
print(f"Sin line: {line1[0].get_zorder()}")
print(f"Cos line: {line2[0].get_zorder()}")

ax1.set_title("how2matplotlib.com - Subplot 1")
ax1.legend()

# Subplot 2
categories = ['A', 'B', 'C', 'D']
values = [4, 7, 2, 5]

bars = ax2.bar(categories, values)

print("\nSubplot 2 z-orders:")
for i, bar in enumerate(bars):
    print(f"Bar {i+1}: {bar.get_zorder()}")

ax2.set_title("how2matplotlib.com - Subplot 2")

plt.tight_layout()
plt.show()
Output:
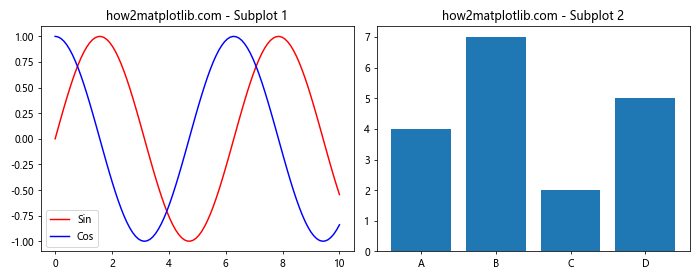
This example demonstrates how z-order works independently within each subplot. We use get_zorder() to retrieve the z-orders of elements in both subplots.
Z-Order and Layering of Plot Elements
Understanding the default z-order of different plot elements is crucial for creating complex visualizations. Let’s explore the default z-orders of various elements:
import matplotlib.pyplot as plt
import numpy as np

fig, ax = plt.subplots()

# Create plot elements
x = np.linspace(0, 10, 100)
y = np.sin(x)

line = ax.plot(x, y, color='blue', label='Sin')
scatter = ax.scatter([2, 4, 6, 8], [0.5, -0.5, 0.5, -0.5], color='red', s=50, label='Points')
text = ax.text(5, 0, "how2matplotlib.com", ha='center', va='center')
rect = ax.add_patch(plt.Rectangle((4, -0.5), 2, 1, facecolor='green', alpha=0.3))

# Print z-orders
print(f"Line z-order: {line[0].get_zorder()}")
print(f"Scatter z-order: {scatter.get_zorder()}")
print(f"Text z-order: {text.get_zorder()}")
print(f"Rectangle z-order: {rect.get_zorder()}")

plt.title("Z-order of Different Plot Elements")
plt.legend()
plt.show()
Output:
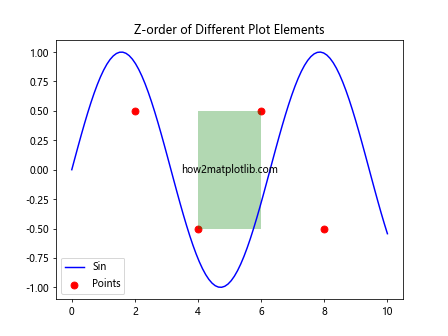
This example creates various plot elements (line, scatter points, text, and a rectangle) and uses get_zorder() to display their default z-orders. Understanding these default values helps in creating more complex visualizations with proper layering.
Z-Order and Clipping
The z-order of an artist can also affect how it interacts with clipping in Matplotlib. Let’s explore this concept:
import matplotlib.pyplot as plt
import numpy as np

fig, ax = plt.subplots()

# Create a sine wave
x = np.linspace(0, 10, 100)
y = np.sin(x)

# Plot the sine wave
line = ax.plot(x, y, color='blue', label='Sin')

# Add a rectangle to clip the sine wave
rect = plt.Rectangle((2, -0.5), 6, 1, facecolor='red', alpha=0.3)
ax.add_patch(rect)

print(f"Line z-order: {line[0].get_zorder()}")
print(f"Rectangle z-order: {rect.get_zorder()}")

# Set the rectangle's z-order higher than the line
rect.set_zorder(line[0].get_zorder() + 1)

print(f"Updated rectangle z-order: {rect.get_zorder()}")

plt.title("how2matplotlib.com - Z-order and Clipping")
plt.legend()
plt.show()
Output:
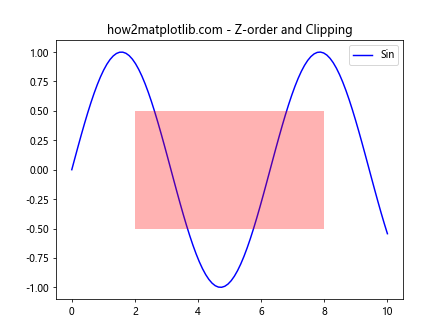
In this example, we create a sine wave and add a rectangle on top of it. By adjusting the z-order of the rectangle, we can control whether it appears on top of or behind the sine wave.
Z-Order in 3D Plots
The concept of z-order also applies to 3D plots in Matplotlib. Let’s explore how get_zorder() works in a 3D context:
import matplotlib.pyplot as plt
import numpy as np

fig = plt.figure()
ax = fig.add_subplot(111, projection='3d')

# Create two planes
xx, yy = np.meshgrid(range(10), range(10))
z1 = np.zeros_like(xx)
z2 = 5 * np.ones_like(xx)

surf1 = ax.plot_surface(xx, yy, z1, alpha=0.5, color='red')
surf2 = ax.plot_surface(xx, yy, z2, alpha=0.5, color='blue')

print(f"Surface 1 z-order: {surf1.get_zorder()}")
print(f"Surface 2 z-order: {surf2.get_zorder()}")

ax.set_zlim(0, 10)
plt.title("how2matplotlib.com - 3D Plot Z-order")
plt.show()
Output:
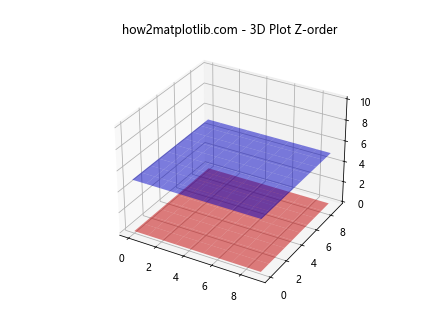
This example creates two 3D surfaces and uses get_zorder() to retrieve their z-orders. In 3D plots, the z-order still affects the drawing order, but the perspective and depth of the 3D space also play a role in how elements are displayed.
Z-Order and Animations
When creating animations in Matplotlib, understanding and manipulating z-order can be crucial for achieving the desired visual effects. Let’s explore how get_zorder() can be used in the context of animations:
import matplotlib.pyplot as plt
import matplotlib.animation as animation
import numpy as np

fig, ax = plt.subplots()

# Create two circles
circle1 = plt.Circle((0.5, 0.5), 0.2, facecolor='red', alpha=0.5)
circle2 = plt.Circle((0.5, 0.5), 0.2, facecolor='blue', alpha=0.5)

ax.add_patch(circle1)
ax.add_patch(circle2)

def animate(frame):
    # Move circles
    circle1.center = (0.5 + 0.2 * np.sin(frame * 0.1), 0.5)
    circle2.center = (0.5, 0.5 + 0.2 * np.cos(frame * 0.1))

    # Swap z-orders every 50 frames
    if frame % 50 == 0:
        circle1.set_zorder(circle2.get_zorder() + 1)
    elif frame % 50 == 25:
        circle2.set_zorder(circle1.get_zorder() + 1)

    return circle1, circle2

ani = animation.FuncAnimation(fig, animate, frames=200, interval=50, blit=True)

ax.set_xlim(0, 1)
ax.set_ylim(0, 1)
plt.title("how2matplotlib.com - Animated Z-order")
plt.show()
Output:
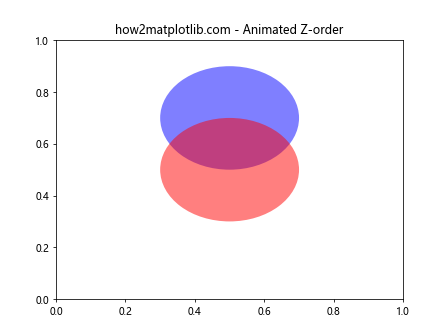
In this example, we create an animation of two moving circles. We use get_zorder() and set_zorder() to swap the z-orders of the circles periodically, creating an interesting visual effect.
Z-Order and Colorbars
When working with colorbars in Matplotlib, it’s important to understand how their z-order relates to other elements in the plot. Let’s explore this concept:
import matplotlib.pyplot as plt
import numpy as np

fig, ax = plt.subplots()

# Create a heatmap
data = np.random.rand(10, 10)
im = ax.imshow(data, cmap='viridis')

# Add a colorbar
cbar = plt.colorbar(im)

# Add some text on top of the heatmap
text = ax.text(5, 5, "how2matplotlib.com", ha='center', va='center', fontsize=12, color='white')

print(f"Heatmap z-order: {im.get_zorder()}")
print(f"Colorbar z-order: {cbar.ax.get_zorder()}")
print(f"Text z-order: {text.get_zorder()}")

plt.title("Z-order with Colorbars")
plt.show()
Output:
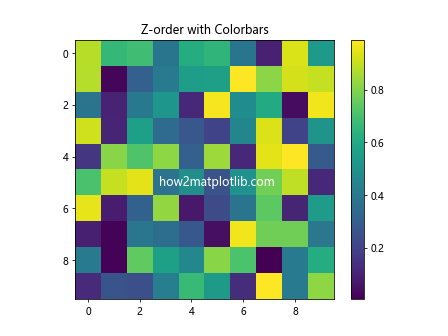
This example creates a heatmap with a colorbar and adds text on top of the heatmap. We use get_zorder() to retrieve the z-order values of these elements, helping us understand their layering in the plot.
Z-Order and Legends
Understanding how legends interact with z-order can be crucial for creating clear and visually appealing plots. Let’s explore this interaction:
import matplotlib.pyplot as plt
import numpy as np

fig, ax = plt.subplots()

x = np.linspace(0, 10, 100)
y1 = np.sin(x)
y2 = np.cos(x)

line1 = ax.plot(x, y1, color='red', label='Sin')
line2 = ax.plot(x, y2, color='blue', label='Cos')

legend = ax.legend()

print(f"Line 1 z-order: {line1[0].get_zorder()}")
print(f"Line 2 z-order: {line2[0].get_zorder()}")
print(f"Legend z-order: {legend.get_zorder()}")

# Add a rectangle behind the legend
rect = plt.Rectangle((0.7, 0.7), 0.25, 0.25, transform=ax.transAxes, facecolor='yellow', alpha=0.3)
ax.add_patch(rect)
print(f"Rectangle z-order: {rect.get_zorder()}")

# Ensure the legend is on top
legend.set_zorder(rect.get_zorder() + 1)

plt.title("how2matplotlib.com - Legend and Z-order")
plt.show()
Output:
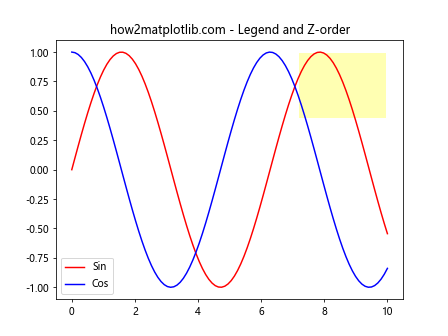
In this example, we create a plot with two lines and a legend. We then add a rectangle behind the legend and use get_zorder() and set_zorder() to ensure the legend appears on top of the rectangle.
Z-Order and Axes
The concept of z-order also applies to axes themselves. Let’s explore how to work with z-order when dealing with multiple axes:
import matplotlib.pyplot as plt
import numpy as np

fig = plt.figure()

# Create main axes
ax1 = fig.add_subplot(111)
x = np.linspace(0, 10, 100)
ax1.plot(x, np.sin(x), color='blue', label='Sin')
ax1.set_xlabel('X')
ax1.set_ylabel('Y')

# Create secondary axes
ax2 = ax1.twinx()
ax2.plot(x, np.cos(x), color='red', label='Cos')
ax2.set_ylabel('Y2')

print(f"Main axes z-order: {ax1.get_zorder()}")
print(f"Secondary axes z-order: {ax2.get_zorder()}")

# Ensure the main axes are on top
ax1.set_zorder(ax2.get_zorder() + 1)

# Make the main axes background patch transparent
ax1.patch.set_visible(False)

plt.title("how2matplotlib.com - Axes Z-order")
plt.show()
Output:
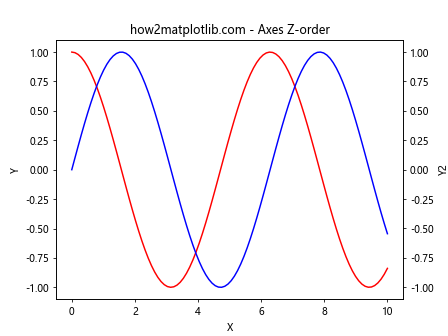
This example creates a plot with two y-axes. We use get_zorder() to retrieve the z-order of both axes and then use set_zorder() to ensure the main axes appear on top of the secondary axes.
Z-Order and Polar Plots
The concept of z-order also applies to polar plots in Matplotlib. Let’s explore how to use get_zorder() in the context of polar plots:
import matplotlib.pyplot as plt
import numpy as np

fig, ax = plt.subplots(subplot_kw=dict(projection='polar'))

# Create two polar plots
theta = np.linspace(0, 2*np.pi, 100)
r1 = np.abs(np.sin(2*theta))
r2 = np.abs(np.cos(3*theta))

line1 = ax.plot(theta, r1, color='red', label='Sin')
line2 = ax.plot(theta, r2, color='blue', label='Cos')

print(f"Line 1 z-order: {line1[0].get_zorder()}")
print(f"Line 2 z-order: {line2[0].get_zorder()}")

# Add a circular patch
circle = plt.Circle((0, 0), 0.5, transform=ax.transData._b, facecolor='yellow', alpha=0.3)
ax.add_artist(circle)
print(f"Circle z-order: {circle.get_zorder()}")

plt.title("how2matplotlib.com - Polar Plot Z-order")
plt.legend()
plt.show()
Output:
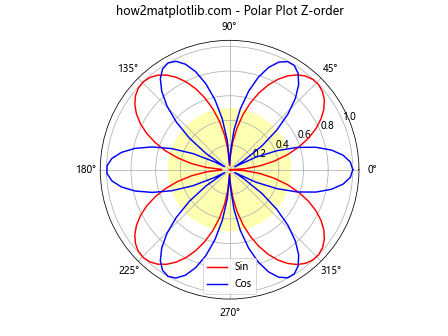
In this example, we create a polar plot with two lines and add a circular patch. We use get_zorder() to retrieve the z-order values of these elements, helping us understand their layering in the polar plot.
Conclusion
Matplotlib.artist.Artist.get_zorder() is a powerful method that allows you to retrieve and manipulate the z-order of artists in Matplotlib. By understanding and utilizing z-order, you can create more complex and visually appealing plots with precise control over the layering of elements.