Comprehensive Guide to Matplotlib.artist.Artist.get_rasterized() in Python: Mastering Rasterization in Data Visualization
Matplotlib.artist.Artist.get_rasterized() in Python is an essential method for controlling the rasterization of artists in Matplotlib plots. This comprehensive guide will delve deep into the intricacies of this function, exploring its usage, benefits, and various applications in data visualization. We’ll cover everything from basic concepts to advanced techniques, providing you with a thorough understanding of how to leverage Matplotlib.artist.Artist.get_rasterized() in your Python projects.
Understanding Matplotlib.artist.Artist.get_rasterized() in Python
Matplotlib.artist.Artist.get_rasterized() in Python is a method that returns the rasterization state of an artist. Rasterization is the process of converting vector graphics into a raster image, which is composed of pixels. This method is particularly useful when working with complex plots or when you need to optimize the rendering of your visualizations.
Let’s start with a simple example to demonstrate how to use Matplotlib.artist.Artist.get_rasterized() in Python:
import matplotlib.pyplot as plt
import numpy as np

# Create a figure and axis
fig, ax = plt.subplots()

# Create a line plot
x = np.linspace(0, 10, 100)
y = np.sin(x)
line, = ax.plot(x, y, label='Sine wave')

# Check if the line is rasterized
is_rasterized = line.get_rasterized()

# Print the result
print(f"Is the line rasterized? {is_rasterized}")

plt.title('Sine Wave Plot - how2matplotlib.com')
plt.xlabel('X-axis')
plt.ylabel('Y-axis')
plt.legend()
plt.show()
Output:
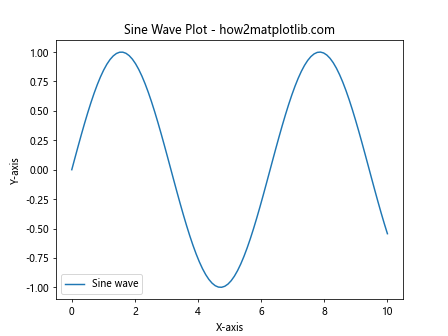
In this example, we create a simple sine wave plot and use Matplotlib.artist.Artist.get_rasterized() in Python to check if the line is rasterized. By default, most artists in Matplotlib are not rasterized, so the result will be False.
The Importance of Matplotlib.artist.Artist.get_rasterized() in Python
Understanding and utilizing Matplotlib.artist.Artist.get_rasterized() in Python is crucial for several reasons:
- Performance optimization: Rasterization can significantly improve rendering speed for complex plots.
- File size reduction: Rasterized elements can lead to smaller file sizes when saving plots.
- Visual consistency: Rasterization ensures consistent appearance across different viewing platforms.
- Memory management: Rasterized plots can be more memory-efficient for large datasets.
Let’s explore these benefits in more detail with some examples.
Performance Optimization with Matplotlib.artist.Artist.get_rasterized() in Python
When dealing with plots containing a large number of elements, rasterization can dramatically improve rendering performance. Here’s an example demonstrating this:
import matplotlib.pyplot as plt
import numpy as np

# Create a figure and axis
fig, (ax1, ax2) = plt.subplots(1, 2, figsize=(12, 5))

# Generate a large number of points
n_points = 100000
x = np.random.rand(n_points)
y = np.random.rand(n_points)

# Plot without rasterization
scatter1 = ax1.scatter(x, y, s=1, alpha=0.5)
ax1.set_title('Without Rasterization - how2matplotlib.com')

# Plot with rasterization
scatter2 = ax2.scatter(x, y, s=1, alpha=0.5, rasterized=True)
ax2.set_title('With Rasterization - how2matplotlib.com')

# Check rasterization state
print(f"Scatter 1 rasterized: {scatter1.get_rasterized()}")
print(f"Scatter 2 rasterized: {scatter2.get_rasterized()}")

plt.tight_layout()
plt.show()
Output:
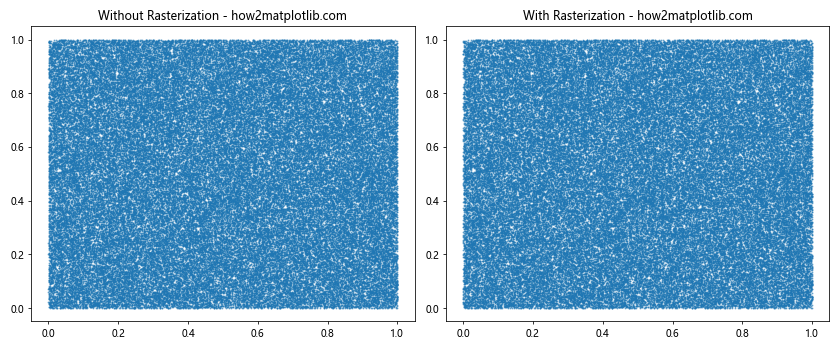
In this example, we create two scatter plots with a large number of points. The first plot is not rasterized, while the second one is. Using Matplotlib.artist.Artist.get_rasterized() in Python, we can confirm the rasterization state of each scatter plot.
File Size Reduction with Matplotlib.artist.Artist.get_rasterized() in Python
Rasterization can significantly reduce file sizes when saving plots, especially for vector formats like PDF or SVG. Here’s an example demonstrating this:
import matplotlib.pyplot as plt
import numpy as np

# Create a figure and axis
fig, ax = plt.subplots(figsize=(8, 6))

# Generate a complex plot
x = np.linspace(0, 10, 1000)
y = np.sin(x) * np.exp(-x/10)

# Plot with rasterization
line = ax.plot(x, y, linewidth=2, rasterized=True)[0]

# Check rasterization state
print(f"Line rasterized: {line.get_rasterized()}")

plt.title('Complex Plot - how2matplotlib.com')
plt.xlabel('X-axis')
plt.ylabel('Y-axis')

# Save the plot in vector format
plt.savefig('rasterized_plot.pdf', dpi=300)
plt.show()
Output:
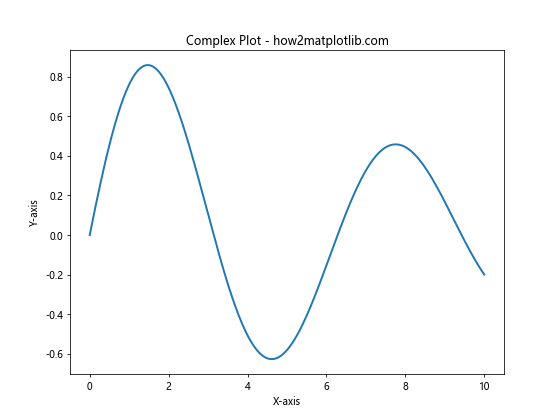
In this example, we create a complex plot and rasterize it before saving. Using Matplotlib.artist.Artist.get_rasterized() in Python, we confirm that the line is indeed rasterized. This rasterization will result in a smaller file size when saved as a PDF.
Advanced Usage of Matplotlib.artist.Artist.get_rasterized() in Python
Now that we’ve covered the basics, let’s explore some more advanced applications of Matplotlib.artist.Artist.get_rasterized() in Python.
Selective Rasterization
Sometimes, you may want to rasterize only certain elements of your plot while keeping others as vector graphics. Here’s how you can achieve this:
import matplotlib.pyplot as plt
import numpy as np

# Create a figure and axis
fig, ax = plt.subplots(figsize=(8, 6))

# Generate data
x = np.linspace(0, 10, 1000)
y1 = np.sin(x)
y2 = np.cos(x)

# Plot with selective rasterization
line1 = ax.plot(x, y1, label='Sine (Rasterized)', rasterized=True)[0]
line2 = ax.plot(x, y2, label='Cosine (Vector)')[0]

# Check rasterization state
print(f"Sine rasterized: {line1.get_rasterized()}")
print(f"Cosine rasterized: {line2.get_rasterized()}")

plt.title('Selective Rasterization - how2matplotlib.com')
plt.xlabel('X-axis')
plt.ylabel('Y-axis')
plt.legend()
plt.show()
Output:
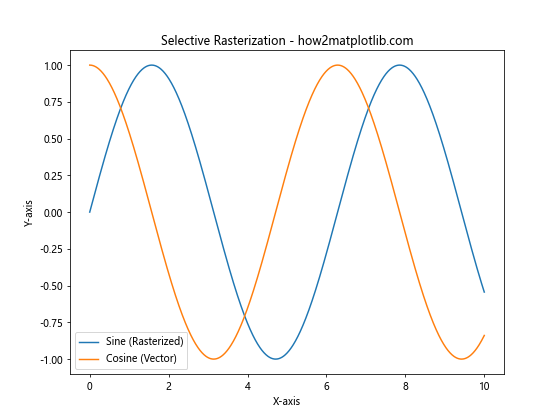
In this example, we plot two lines: a sine wave that is rasterized and a cosine wave that remains as a vector graphic. Using Matplotlib.artist.Artist.get_rasterized() in Python, we can verify the rasterization state of each line.
Dynamic Rasterization
You can also dynamically change the rasterization state of an artist. This can be useful when you want to toggle rasterization based on certain conditions:
import matplotlib.pyplot as plt
import numpy as np

# Create a figure and axis
fig, ax = plt.subplots(figsize=(8, 6))

# Generate data
x = np.linspace(0, 10, 1000)
y = np.sin(x) * np.exp(-x/10)

# Plot initially without rasterization
line = ax.plot(x, y, linewidth=2)[0]

# Function to toggle rasterization
def toggle_rasterization(event):
    current_state = line.get_rasterized()
    line.set_rasterized(not current_state)
    print(f"Rasterization toggled. New state: {line.get_rasterized()}")
    fig.canvas.draw()

# Connect the toggle function to a key press event
fig.canvas.mpl_connect('key_press_event', toggle_rasterization)

plt.title('Dynamic Rasterization (Press any key) - how2matplotlib.com')
plt.xlabel('X-axis')
plt.ylabel('Y-axis')
plt.show()
Output:
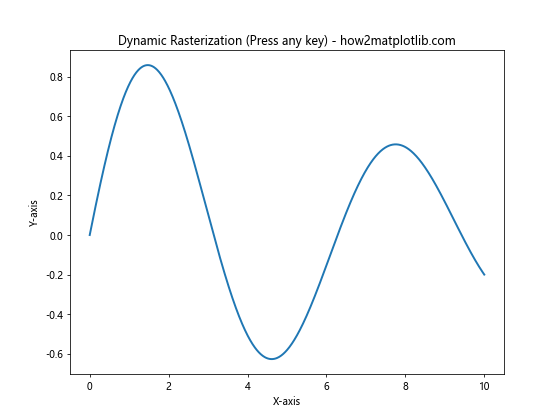
In this interactive example, we create a plot that allows you to toggle rasterization by pressing any key. The Matplotlib.artist.Artist.get_rasterized() in Python method is used to check the current rasterization state before toggling.
Matplotlib.artist.Artist.get_rasterized() in Python and Image Quality
While rasterization can improve performance and reduce file sizes, it’s important to consider its impact on image quality. Let’s explore this aspect:
import matplotlib.pyplot as plt
import numpy as np

# Create a figure with two subplots
fig, (ax1, ax2) = plt.subplots(1, 2, figsize=(12, 5))

# Generate data
x = np.linspace(0, 10, 1000)
y = np.sin(x) * np.exp(-x/10)

# Plot without rasterization
line1 = ax1.plot(x, y, linewidth=2)[0]
ax1.set_title('Vector Graphics - how2matplotlib.com')

# Plot with rasterization
line2 = ax2.plot(x, y, linewidth=2, rasterized=True)[0]
ax2.set_title('Rasterized - how2matplotlib.com')

# Check rasterization state
print(f"Line 1 rasterized: {line1.get_rasterized()}")
print(f"Line 2 rasterized: {line2.get_rasterized()}")

plt.tight_layout()
plt.show()
Output:
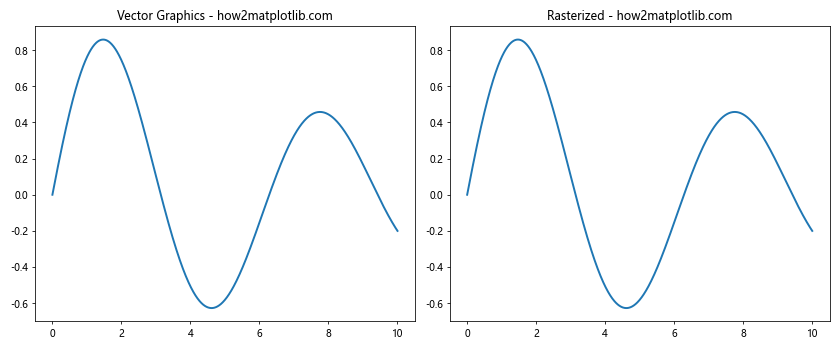
In this example, we create two identical plots, one using vector graphics and the other rasterized. The Matplotlib.artist.Artist.get_rasterized() in Python method confirms the rasterization state of each line. When zooming in on the plots, you may notice that the rasterized version loses some detail compared to the vector version.
Matplotlib.artist.Artist.get_rasterized() in Python and Different Plot Types
Matplotlib.artist.Artist.get_rasterized() in Python can be used with various types of plots. Let’s explore how it works with different plot types:
Scatter Plots
import matplotlib.pyplot as plt
import numpy as np

# Create a figure and axis
fig, ax = plt.subplots(figsize=(8, 6))

# Generate data
n_points = 10000
x = np.random.randn(n_points)
y = np.random.randn(n_points)

# Create a scatter plot with rasterization
scatter = ax.scatter(x, y, c=np.random.rand(n_points), cmap='viridis', alpha=0.5, rasterized=True)

# Check rasterization state
print(f"Scatter plot rasterized: {scatter.get_rasterized()}")

plt.title('Rasterized Scatter Plot - how2matplotlib.com')
plt.xlabel('X-axis')
plt.ylabel('Y-axis')
plt.colorbar(scatter)
plt.show()
Output:
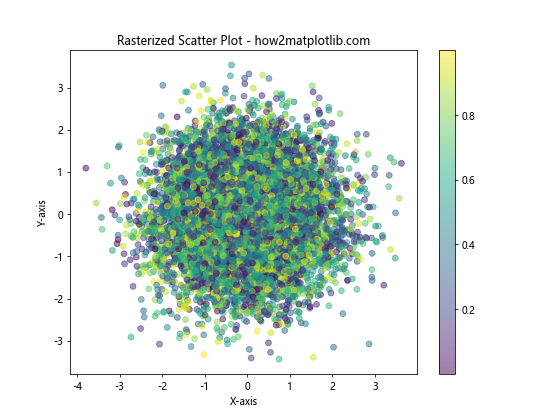
In this example, we create a scatter plot with a large number of points and rasterize it. The Matplotlib.artist.Artist.get_rasterized() in Python method confirms that the scatter plot is indeed rasterized.
Contour Plots
import matplotlib.pyplot as plt
import numpy as np

# Create a figure and axis
fig, ax = plt.subplots(figsize=(8, 6))

# Generate data
x = np.linspace(-3, 3, 100)
y = np.linspace(-3, 3, 100)
X, Y = np.meshgrid(x, y)
Z = np.sin(X) * np.cos(Y)

# Create a contour plot with rasterization
contour = ax.contourf(X, Y, Z, levels=20, cmap='coolwarm', rasterized=True)

# Check rasterization state
print(f"Contour plot rasterized: {contour.get_rasterized()}")

plt.title('Rasterized Contour Plot - how2matplotlib.com')
plt.xlabel('X-axis')
plt.ylabel('Y-axis')
plt.colorbar(contour)
plt.show()
Output:
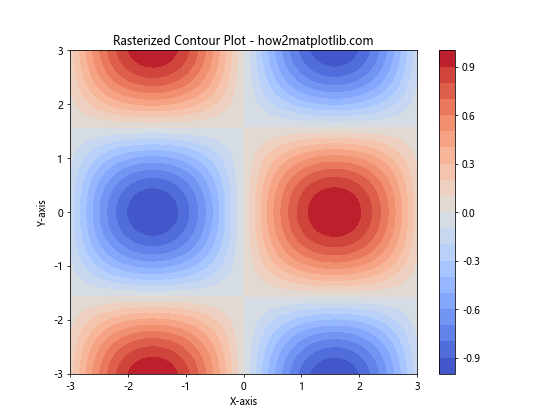
Here, we create a contour plot and rasterize it. The Matplotlib.artist.Artist.get_rasterized() in Python method is used to verify the rasterization state of the contour plot.
Matplotlib.artist.Artist.get_rasterized() in Python and 3D Plots
Matplotlib.artist.Artist.get_rasterized() in Python can also be used with 3D plots. Let’s see how it works:
import matplotlib.pyplot as plt
from mpl_toolkits.mplot3d import Axes3D
import numpy as np

# Create a figure and 3D axis
fig = plt.figure(figsize=(10, 8))
ax = fig.add_subplot(111, projection='3d')

# Generate data
x = np.linspace(-5, 5, 100)
y = np.linspace(-5, 5, 100)
X, Y = np.meshgrid(x, y)
Z = np.sin(np.sqrt(X**2 + Y**2))

# Create a surface plot with rasterization
surface = ax.plot_surface(X, Y, Z, cmap='viridis', rasterized=True)

# Check rasterization state
print(f"Surface plot rasterized: {surface.get_rasterized()}")

ax.set_title('Rasterized 3D Surface Plot - how2matplotlib.com')
ax.set_xlabel('X-axis')
ax.set_ylabel('Y-axis')
ax.set_zlabel('Z-axis')
plt.colorbar(surface)
plt.show()
Output:
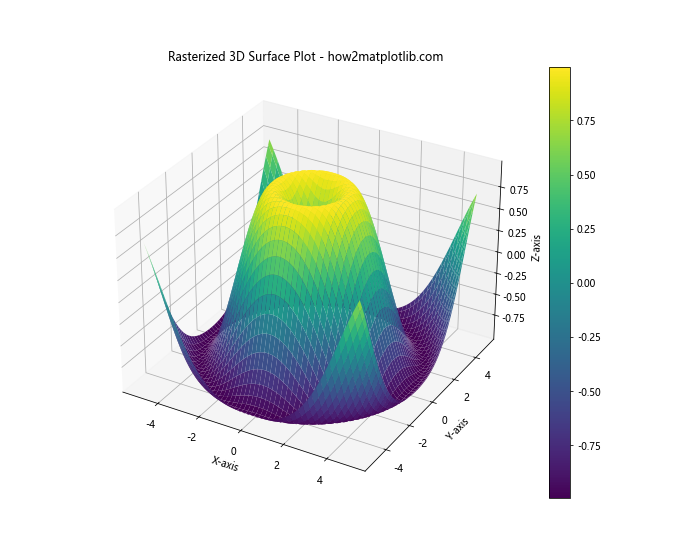
In this example, we create a 3D surface plot and rasterize it. The Matplotlib.artist.Artist.get_rasterized() in Python method is used to confirm the rasterization state of the surface plot.
Matplotlib.artist.Artist.get_rasterized() in Python and Custom Artists
You can also use Matplotlib.artist.Artist.get_rasterized() in Python with custom artists. Here’s an example:
import matplotlib.pyplot as plt
import matplotlib.patches as patches

# Create a figure and axis
fig, ax = plt.subplots(figsize=(8, 6))

# Create a custom artist (a rectangle in this case)
rect = patches.Rectangle((0.2, 0.2), 0.6, 0.6, fill=False, rasterized=True)
ax.add_patch(rect)

# Check rasterization state
print(f"Rectangle rasterized: {rect.get_rasterized()}")

plt.title('Custom Rasterized Artist - how2matplotlib.com')
ax.set_xlim(0, 1)
ax.set_ylim(0, 1)
plt.show()
Output:
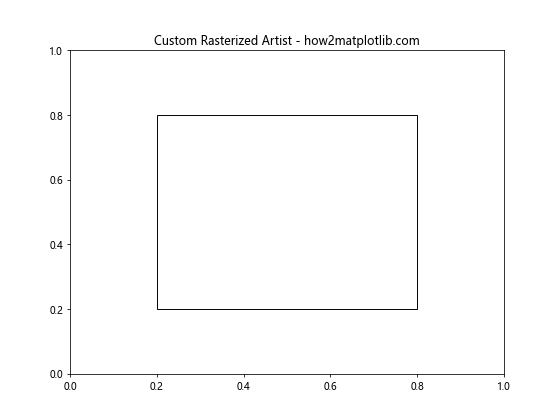
In this example, we create a custom rectangle artist and rasterize it. The Matplotlib.artist.Artist.get_rasterized() in Python method is used to verify the rasterization state of the custom artist.
Matplotlib.artist.Artist.get_rasterized() in Python and Animation
Matplotlib.artist.Artist.get_rasterized() in Python can also be useful when creating animations. Here’s an example:
import matplotlib.pyplot as plt
import matplotlib.animation as animation
import numpy as np

# Create a figure and axis
fig, ax = plt.subplots(figsize=(8, 6))

# Generate initial data
x = np.linspace(0, 2*np.pi, 100)
y = np.sin(x)
line, = ax.plot(x, y, rasterized=True)

# Animation update function
def update(frame):
    y = np.sin(x + frame/10)
    line.set_ydata(y)
    return line,

# Create animation
anim = animation.FuncAnimation(fig, update, frames=100, interval=50, blit=True)

# Check rasterization stateprint(f"Line rasterized: {line.get_rasterized()}")

plt.title('Animated Rasterized Plot - how2matplotlib.com')
plt.xlabel('X-axis')
plt.ylabel('Y-axis')
plt.show()
Output:
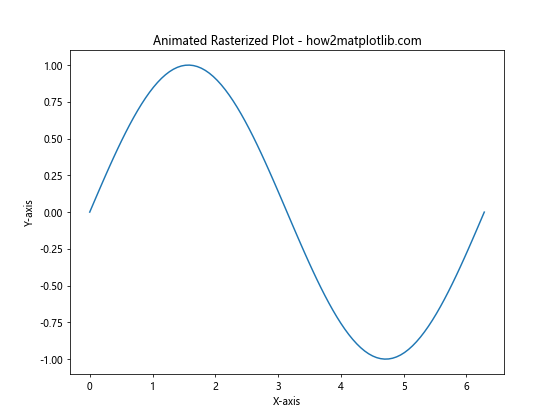
In this animation example, we create a sine wave that shifts over time. The line is rasterized, and we use Matplotlib.artist.Artist.get_rasterized() in Python to confirm its rasterization state.
Matplotlib.artist.Artist.get_rasterized() in Python and Subplots
When working with subplots, you can use Matplotlib.artist.Artist.get_rasterized() in Python to manage rasterization for each subplot individually:
import matplotlib.pyplot as plt
import numpy as np

# Create a figure with multiple subplots
fig, ((ax1, ax2), (ax3, ax4)) = plt.subplots(2, 2, figsize=(12, 10))

# Generate data
x = np.linspace(0, 10, 1000)
y1 = np.sin(x)
y2 = np.cos(x)
y3 = np.tan(x)
y4 = np.exp(-x/5) * np.sin(x)

# Plot in each subplot with different rasterization settings
line1 = ax1.plot(x, y1, rasterized=True)[0]
line2 = ax2.plot(x, y2, rasterized=False)[0]
line3 = ax3.plot(x, y3, rasterized=True)[0]
line4 = ax4.plot(x, y4, rasterized=False)[0]

# Check rasterization state for each subplot
print(f"Subplot 1 rasterized: {line1.get_rasterized()}")
print(f"Subplot 2 rasterized: {line2.get_rasterized()}")
print(f"Subplot 3 rasterized: {line3.get_rasterized()}")
print(f"Subplot 4 rasterized: {line4.get_rasterized()}")

# Set titles for each subplot
ax1.set_title('Sine (Rasterized) - how2matplotlib.com')
ax2.set_title('Cosine (Vector) - how2matplotlib.com')
ax3.set_title('Tangent (Rasterized) - how2matplotlib.com')
ax4.set_title('Damped Sine (Vector) - how2matplotlib.com')

plt.tight_layout()
plt.show()
Output:
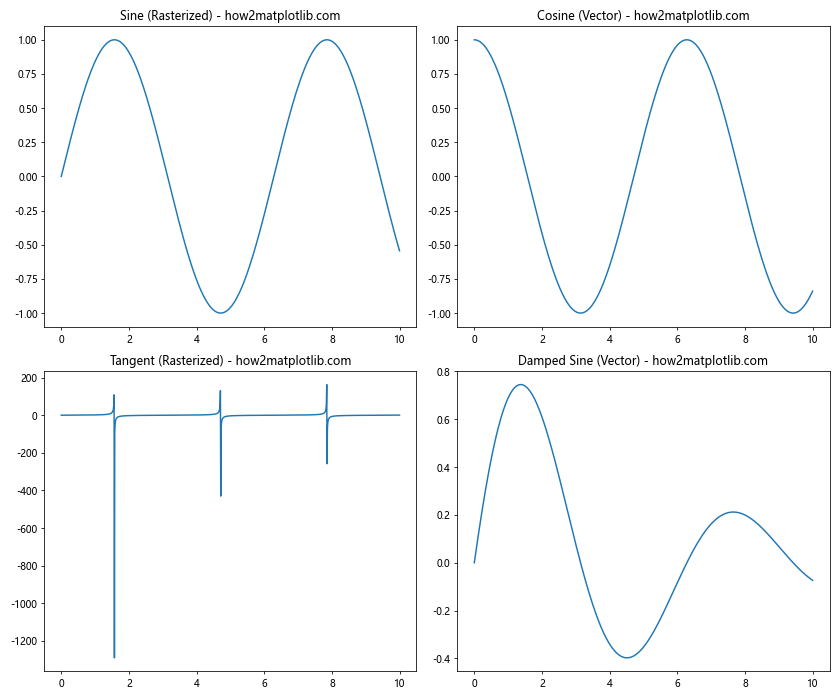
In this example, we create four subplots with different functions and rasterization settings. We use Matplotlib.artist.Artist.get_rasterized() in Python to verify the rasterization state of each subplot.
Matplotlib.artist.Artist.get_rasterized() in Python and Polar Plots
Matplotlib.artist.Artist.get_rasterized() in Python can also be used with polar plots:
import matplotlib.pyplot as plt
import numpy as np

# Create a figure and polar axis
fig, ax = plt.subplots(figsize=(8, 8), subplot_kw=dict(projection='polar'))

# Generate data
theta = np.linspace(0, 2*np.pi, 1000)
r = 1 + np.sin(5*theta)

# Create a polar plot with rasterization
line = ax.plot(theta, r, rasterized=True)[0]

# Check rasterization state
print(f"Polar plot rasterized: {line.get_rasterized()}")

plt.title('Rasterized Polar Plot - how2matplotlib.com')
plt.show()
Output:
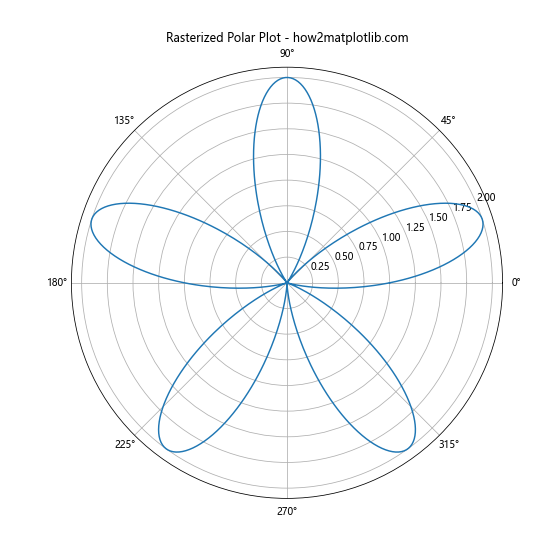
In this example, we create a polar plot and rasterize it. The Matplotlib.artist.Artist.get_rasterized() in Python method is used to confirm the rasterization state of the polar plot.
Matplotlib.artist.Artist.get_rasterized() in Python and Image Plotting
When working with images in Matplotlib, you can also use Matplotlib.artist.Artist.get_rasterized() in Python:
import matplotlib.pyplot as plt
import numpy as np

# Create a figure and axis
fig, ax = plt.subplots(figsize=(8, 6))

# Generate a random image
image = np.random.rand(100, 100)

# Plot the image with rasterization
im = ax.imshow(image, cmap='viridis', rasterized=True)

# Check rasterization state
print(f"Image rasterized: {im.get_rasterized()}")

plt.title('Rasterized Image Plot - how2matplotlib.com')
plt.colorbar(im)
plt.show()
Output:
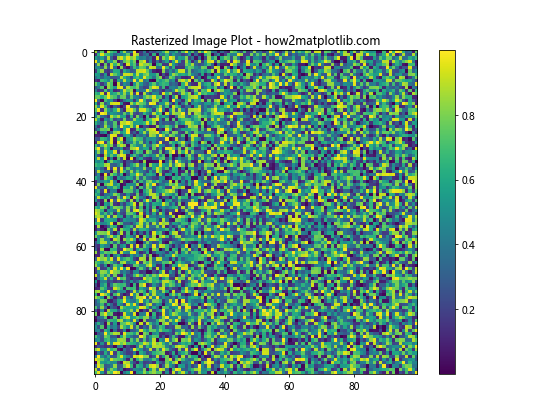
In this example, we plot a random image and rasterize it. The Matplotlib.artist.Artist.get_rasterized() in Python method is used to verify the rasterization state of the image plot.
Conclusion
Matplotlib.artist.Artist.get_rasterized() in Python is a powerful tool for managing the rasterization of plot elements in Matplotlib. Throughout this comprehensive guide, we’ve explored its usage in various contexts, from simple line plots to complex 3D visualizations and animations.
Key takeaways include:
- Matplotlib.artist.Artist.get_rasterized() in Python allows you to check the rasterization state of any artist in Matplotlib.
- Rasterization can significantly improve performance and reduce file sizes for complex plots.
- You can selectively rasterize elements of your plot for optimal balance between quality and performance.
- Matplotlib.artist.Artist.get_rasterized() in Python works with a wide range of plot types, including scatter plots, contour plots, 3D plots, and more.
- When working with animations or interactive plots, you can dynamically change the rasterization state of artists.