Comprehensive Guide to Matplotlib.artist.Artist.get_path_effects() in Python
Matplotlib.artist.Artist.get_path_effects() in Python is a powerful method that allows you to retrieve the path effects applied to an Artist object in Matplotlib. This function is an essential part of the Matplotlib library, which is widely used for creating static, animated, and interactive visualizations in Python. In this comprehensive guide, we will explore the various aspects of Matplotlib.artist.Artist.get_path_effects(), its usage, and how it can enhance your data visualization projects.
Understanding Matplotlib.artist.Artist.get_path_effects()
Matplotlib.artist.Artist.get_path_effects() is a method that belongs to the Artist class in Matplotlib. It is used to retrieve the list of path effects applied to an Artist object. Path effects are visual enhancements that can be applied to the outlines of various Matplotlib elements, such as lines, text, and patches. These effects can include shadows, glows, strokes, and more.
Let’s start with a simple example to demonstrate how to use Matplotlib.artist.Artist.get_path_effects():
import matplotlib.pyplot as plt
from matplotlib import patheffects

fig, ax = plt.subplots()
text = ax.text(0.5, 0.5, 'how2matplotlib.com', fontsize=20, ha='center', va='center')
text.set_path_effects([patheffects.withStroke(linewidth=3, foreground='red')])

effects = text.get_path_effects()
print(effects)

plt.show()
Output:
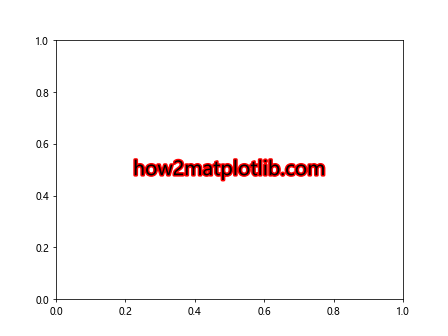
In this example, we create a text object and apply a stroke effect to it. We then use the get_path_effects() method to retrieve the list of path effects applied to the text object. The output will be a list containing the PathPatchEffect object that represents the stroke effect.
Exploring Different Path Effects
Matplotlib.artist.Artist.get_path_effects() can be used with various types of path effects. Let’s explore some of the most common path effects and how to retrieve them using this method.
Shadow Effect
import matplotlib.pyplot as plt
from matplotlib import patheffects

fig, ax = plt.subplots()
text = ax.text(0.5, 0.5, 'how2matplotlib.com', fontsize=20, ha='center', va='center')
text.set_path_effects([patheffects.withSimplePatchShadow()])

effects = text.get_path_effects()
print(effects)

plt.show()
Output:
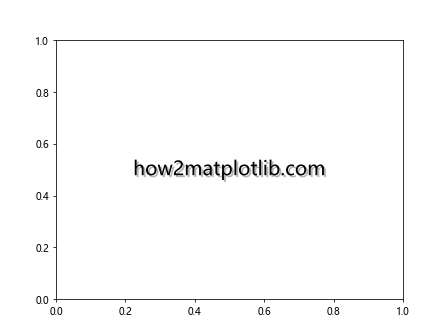
In this example, we apply a simple patch shadow effect to the text and then retrieve it using get_path_effects().
Glow Effect
import matplotlib.pyplot as plt
from matplotlib import patheffects

fig, ax = plt.subplots()
text = ax.text(0.5, 0.5, 'how2matplotlib.com', fontsize=20, ha='center', va='center')
text.set_path_effects([patheffects.Normal(), patheffects.Glow()])

effects = text.get_path_effects()
print(effects)

plt.show()
Here, we apply a glow effect to the text and retrieve the list of path effects, which includes both the Normal effect and the Glow effect.
Using Matplotlib.artist.Artist.get_path_effects() with Different Artist Types
Matplotlib.artist.Artist.get_path_effects() can be used with various types of Artist objects in Matplotlib. Let’s explore how to use it with different types of plots and chart elements.
Line Plot
import matplotlib.pyplot as plt
from matplotlib import patheffects
import numpy as np

fig, ax = plt.subplots()
x = np.linspace(0, 10, 100)
y = np.sin(x)
line = ax.plot(x, y, label='how2matplotlib.com')[0]
line.set_path_effects([patheffects.SimpleLineShadow(), patheffects.Normal()])

effects = line.get_path_effects()
print(effects)

plt.show()
Output:
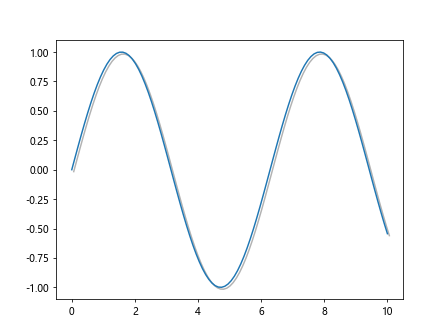
In this example, we create a line plot and apply a simple line shadow effect to it. We then use get_path_effects() to retrieve the list of effects applied to the line.
Scatter Plot
import matplotlib.pyplot as plt
from matplotlib import patheffects
import numpy as np

fig, ax = plt.subplots()
x = np.random.rand(50)
y = np.random.rand(50)
scatter = ax.scatter(x, y, s=100, c='blue', label='how2matplotlib.com')
scatter.set_path_effects([patheffects.withSimplePatchShadow()])

effects = scatter.get_path_effects()
print(effects)

plt.show()
Output:
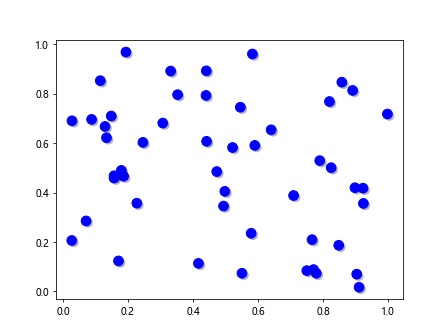
Here, we create a scatter plot and apply a simple patch shadow effect to the scatter points. We then retrieve the applied effects using get_path_effects().
Combining Multiple Path Effects
Matplotlib.artist.Artist.get_path_effects() is particularly useful when working with multiple path effects applied to a single Artist object. Let’s explore how to combine different effects and retrieve them.
import matplotlib.pyplot as plt
from matplotlib import patheffects

fig, ax = plt.subplots()
text = ax.text(0.5, 0.5, 'how2matplotlib.com', fontsize=20, ha='center', va='center')
text.set_path_effects([
    patheffects.withStroke(linewidth=3, foreground='red'),
    patheffects.withSimplePatchShadow(offset=(2, -2), shadow_rgbFace='blue', alpha=0.6)
])

effects = text.get_path_effects()
print(effects)

plt.show()
Output:
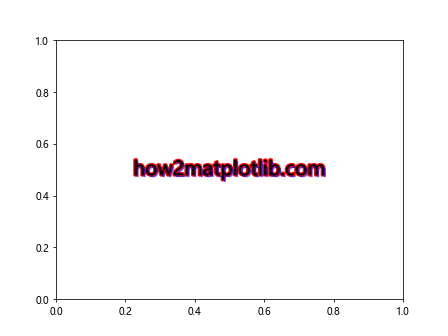
In this example, we apply both a stroke effect and a shadow effect to the text. When we use get_path_effects(), it returns a list containing both of these effects.
Modifying Path Effects Dynamically
One of the advantages of using Matplotlib.artist.Artist.get_path_effects() is that it allows you to retrieve and modify path effects dynamically. Let’s see how we can do this:
import matplotlib.pyplot as plt
from matplotlib import patheffects

fig, ax = plt.subplots()
text = ax.text(0.5, 0.5, 'how2matplotlib.com', fontsize=20, ha='center', va='center')
text.set_path_effects([patheffects.withStroke(linewidth=2, foreground='red')])

# Get the current path effects
effects = text.get_path_effects()

# Modify the existing effect
effects[0].set_linewidth(4)

# Add a new effect
effects.append(patheffects.withSimplePatchShadow())

# Update the text with the modified effects
text.set_path_effects(effects)

plt.show()
In this example, we first apply a stroke effect to the text. We then retrieve the current path effects, modify the existing stroke effect, and add a new shadow effect. Finally, we update the text with the modified list of effects.
Using Matplotlib.artist.Artist.get_path_effects() in Animations
Matplotlib.artist.Artist.get_path_effects() can be particularly useful when creating animations. Let’s see how we can use it to create a simple animation with changing path effects:
import matplotlib.pyplot as plt
from matplotlib import patheffects
from matplotlib.animation import FuncAnimation

fig, ax = plt.subplots()
text = ax.text(0.5, 0.5, 'how2matplotlib.com', fontsize=20, ha='center', va='center')

def update(frame):
    if frame % 2 == 0:
        text.set_path_effects([patheffects.withStroke(linewidth=3, foreground='red')])
    else:
        text.set_path_effects([patheffects.withSimplePatchShadow()])

    effects = text.get_path_effects()
    print(f"Frame {frame}: {effects}")
    return text,

ani = FuncAnimation(fig, update, frames=10, interval=500, blit=True)
plt.show()
Output:
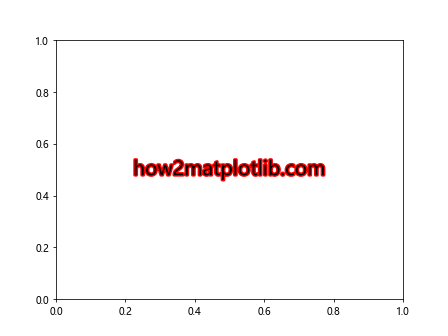
In this animation, we alternate between a stroke effect and a shadow effect on the text. We use get_path_effects() to print the current effects for each frame of the animation.
Advanced Usage of Matplotlib.artist.Artist.get_path_effects()
Now that we’ve covered the basics, let’s explore some more advanced uses of Matplotlib.artist.Artist.get_path_effects().
Custom Path Effects
Matplotlib allows you to create custom path effects by subclassing the AbstractPathEffect class. Let’s create a custom effect and see how get_path_effects() works with it:
import matplotlib.pyplot as plt
from matplotlib import patheffects

class CustomEffect(patheffects.AbstractPathEffect):
    def __init__(self, offset=(1, 1), **kwargs):
        super().__init__(**kwargs)
        self._offset = offset

    def draw_path(self, renderer, gc, tpath, affine, rgbFace):
        offset_path = tpath.transformed(affine.translate(*self._offset))
        renderer.draw_path(gc, offset_path, affine, rgbFace)

fig, ax = plt.subplots()
text = ax.text(0.5, 0.5, 'how2matplotlib.com', fontsize=20, ha='center', va='center')
text.set_path_effects([CustomEffect(offset=(3, 3))])

effects = text.get_path_effects()
print(effects)

plt.show()
Output:
In this example, we create a custom path effect that offsets the text. We then apply this effect to our text and use get_path_effects() to retrieve it.
Chaining Path Effects
Matplotlib.artist.Artist.get_path_effects() is particularly useful when working with chained path effects. Let’s see how we can chain multiple effects and retrieve them:
import matplotlib.pyplot as plt
from matplotlib import patheffects

fig, ax = plt.subplots()
text = ax.text(0.5, 0.5, 'how2matplotlib.com', fontsize=20, ha='center', va='center')
text.set_path_effects([
    patheffects.Stroke(linewidth=3, foreground='red'),
    patheffects.Normal(),
    patheffects.Stroke(linewidth=1, foreground='black'),
    patheffects.Normal()
])

effects = text.get_path_effects()
print(effects)

plt.show()
Output:
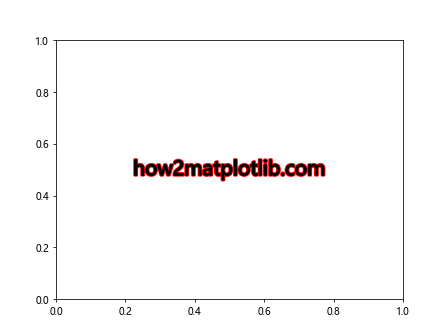
In this example, we chain multiple stroke effects with normal effects. The get_path_effects() method returns the list of all these chained effects.
Matplotlib.artist.Artist.get_path_effects() in Different Plot Types
Let’s explore how Matplotlib.artist.Artist.get_path_effects() can be used with different types of plots in Matplotlib.
Bar Plot
import matplotlib.pyplot as plt
from matplotlib import patheffects
import numpy as np

fig, ax = plt.subplots()
x = ['A', 'B', 'C', 'D']
y = [3, 7, 2, 5]
bars = ax.bar(x, y)

for bar in bars:
    bar.set_path_effects([patheffects.withSimplePatchShadow()])

effects = bars[0].get_path_effects()
print(f"Effects on bar: {effects}")

plt.title('how2matplotlib.com')
plt.show()
Output:
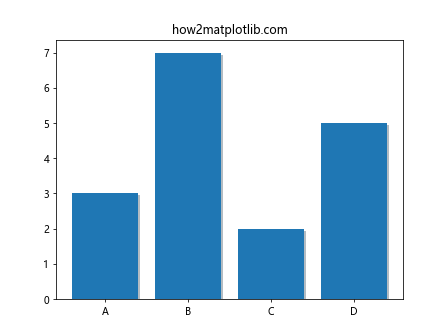
In this example, we create a bar plot and apply a shadow effect to each bar. We then use get_path_effects() to retrieve the effects applied to one of the bars.
Pie Chart
import matplotlib.pyplot as plt
from matplotlib import patheffects

fig, ax = plt.subplots()
sizes = [30, 20, 25, 15, 10]
labels = ['A', 'B', 'C', 'D', 'E']
wedges, texts = ax.pie(sizes, labels=labels)

for wedge in wedges:
    wedge.set_path_effects([patheffects.withSimplePatchShadow()])

effects = wedges[0].get_path_effects()
print(f"Effects on wedge: {effects}")

plt.title('how2matplotlib.com')
plt.show()
Output:
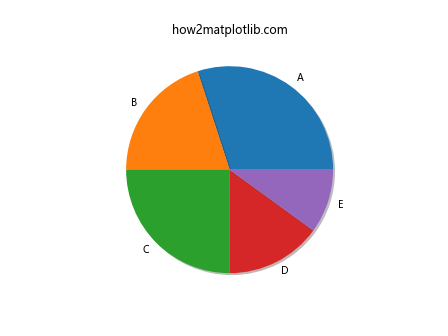
Here, we create a pie chart and apply a shadow effect to each wedge. We then use get_path_effects() to retrieve the effects applied to one of the wedges.
Matplotlib.artist.Artist.get_path_effects() with Subplots
Matplotlib.artist.Artist.get_path_effects() can also be used effectively with subplots. Let’s see an example:
import matplotlib.pyplot as plt
from matplotlib import patheffects
import numpy as np

fig, (ax1, ax2) = plt.subplots(1, 2, figsize=(12, 5))

# Subplot 1
x1 = np.linspace(0, 10, 100)
y1 = np.sin(x1)
line1 = ax1.plot(x1, y1, label='how2matplotlib.com')[0]
line1.set_path_effects([patheffects.SimpleLineShadow(), patheffects.Normal()])

# Subplot 2
x2 = ['A', 'B', 'C', 'D']
y2 = [3, 7, 2, 5]
bars = ax2.bar(x2, y2)
for bar in bars:
    bar.set_path_effects([patheffects.withSimplePatchShadow()])

effects1 = line1.get_path_effects()
effects2 = bars[0].get_path_effects()

print(f"Effects on line: {effects1}")
print(f"Effects on bar: {effects2}")

plt.show()
Output:
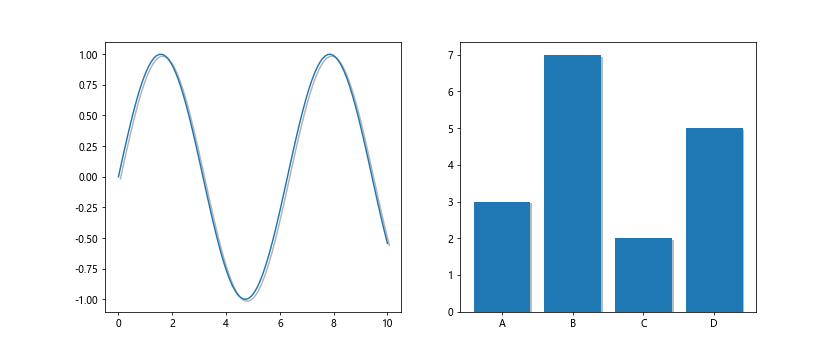
In this example, we create two subplots: a line plot and a bar plot. We apply different path effects to each and use get_path_effects() to retrieve the effects for both.
Matplotlib.artist.Artist.get_path_effects() in 3D Plots
Matplotlib.artist.Artist.get_path_effects() can also be used with 3D plots. Let’s see an example:
import matplotlib.pyplot as plt
from matplotlib import patheffects
from mpl_toolkits.mplot3d import Axes3D
import numpy as np

fig = plt.figure()
ax = fig.add_subplot(111, projection='3d')

# Create data
theta = np.linspace(-4 * np.pi, 4 * np.pi, 100)
z = np.linspace(-2, 2, 100)
r = z**2 + 1
x = r * np.sin(theta)
y = r * np.cos(theta)

# Plot
line = ax.plot(x, y, z, label='how2matplotlib.com')[0]
line.set_path_effects([patheffects.SimpleLineShadow(), patheffects.Normal()])

effects = line.get_path_effects()
print(f"Effects on 3D line: {effects}")

plt.show()
Output:
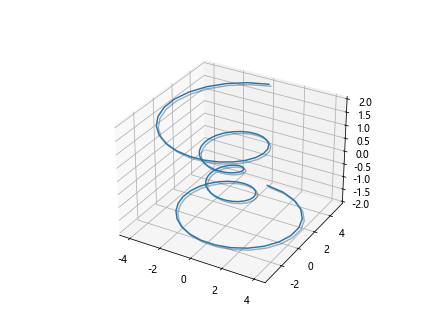
In this example, we create a 3D parametric curve and apply path effects to it. We then use get_path_effects() to retrieve the applied effects.
Matplotlib.artist.Artist.get_path_effects() in Interactive Plots
Matplotlib.artist.Artist.get_path_effects() can be particularly useful in interactive plots. Let’s create an interactive plot where we can toggle path effects:
import matplotlib.pyplot as plt
from matplotlib import patheffects
from matplotlib.widgets import Button

fig, ax = plt.subplots()
text = ax.text(0.5, 0.5, 'how2matplotlib.com', fontsize=20, ha='center', va='center')

def toggle_effect(event):
    current_effects = text.get_path_effects()
    if not current_effects:
        text.set_path_effects([patheffects.withStroke(linewidth=3, foreground='red')])
    else:
        text.set_path_effects([])
    fig.canvas.draw_idle()

ax_button = plt.axes([0.7, 0.05, 0.1, 0.075])
button = Button(ax_button, 'Toggle Effect')
button.on_clicked(toggle_effect)

plt.show()
Output:
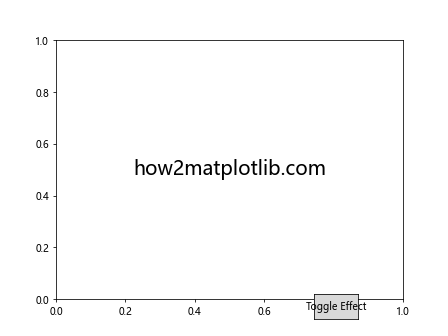
In this interactive example, we create a button that toggles a stroke effect on and off for the text. We use get_path_effects() to check the current state of the effects.
Error Handling with Matplotlib.artist.Artist.get_path_effects()
When working with Matplotlib.artist.Artist.get_path_effects(), it’s important to handle potential errors. Let’s look at some common scenarios:
import matplotlib.pyplot as plt
from matplotlib import patheffects

fig, ax = plt.subplots()
text = ax.text(0.5, 0.5, 'how2matplotlib.com', fontsize=20, ha='center', va='center')

# Scenario 1: No path effects set
try:
    effects = text.get_path_effects()
    print(f"Effects: {effects}")
except AttributeError:
    print("No path effects set")

# Scenario 2: Invalid Artist object
invalid_artist = "Not an Artist object"
try:
    effects = invalid_artist.get_path_effects()
except AttributeError:
    print("Invalid Artist object")

plt.show()
Output:
In this example, we handle two scenarios: when no path effects are set, and when trying to call get_path_effects() on an invalid object.
Performance Considerations with Matplotlib.artist.Artist.get_path_effects()
While Matplotlib.artist.Artist.get_path_effects() is a useful method, it’s important to consider performance when using it, especially in large or complex plots. Here’s an example of how to use it efficiently:
import matplotlib.pyplot as plt
from matplotlib import patheffects
import numpy as np

fig, ax = plt.subplots()
x = np.linspace(0, 10, 1000)
y = np.sin(x)
line = ax.plot(x, y, label='how2matplotlib.com')[0]

# Efficient use: Store effects in a variable
effects = [patheffects.SimpleLineShadow(), patheffects.Normal()]
line.set_path_effects(effects)

# Instead of calling get_path_effects() multiple times, use the stored variable
print(f"Effects: {effects}")

plt.show()
Output:
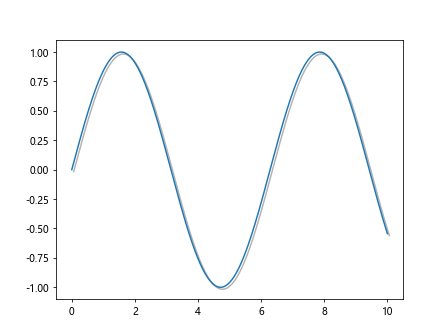
In this example, we store the path effects in a variable instead of repeatedly calling get_path_effects(), which can be more efficient for complex plots.
Matplotlib.artist.Artist.get_path_effects() in Different Matplotlib Backends
Matplotlib.artist.Artist.get_path_effects() works across different Matplotlib backends. Let’s see an example using the ‘Agg’ backend:
import matplotlib
matplotlib.use('Agg')  # Set the backend to Agg
import matplotlib.pyplot as plt
from matplotlib import patheffects

fig, ax = plt.subplots()
text = ax.text(0.5, 0.5, 'how2matplotlib.com', fontsize=20, ha='center', va='center')
text.set_path_effects([patheffects.withStroke(linewidth=3, foreground='red')])

effects = text.get_path_effects()
print(f"Effects with Agg backend: {effects}")

plt.savefig('output.png')
In this example, we use the ‘Agg’ backend and save the figure to a file instead of displaying it. get_path_effects() works the same way regardless of the backend used.
Conclusion
Matplotlib.artist.Artist.get_path_effects() is a powerful method that allows you to retrieve and manipulate path effects in Matplotlib. Throughout this comprehensive guide, we’ve explored various aspects of this method, including its basic usage, application to different types of plots, interaction with custom effects, and considerations for performance and error handling.