Matplotlib 3D Plotting
3D plotting in Matplotlib opens up a new dimension of visualizing data. Whether you’re analyzing the peaks and troughs of a mountain range, the distribution of resources in a volume, or any three-dimensional data, Matplotlib’s 3D capabilities can help you create insightful and interactive visualizations. This article will guide you through the basics of 3D plotting in Matplotlib, covering various types of 3D plots, and providing detailed examples to help you get started.
Getting Started with 3D Plotting in Matplotlib
Before diving into the examples, ensure you have Matplotlib installed. If not, you can install it using pip:
pip install matplotlib
To use Matplotlib’s 3D plotting capabilities, you’ll need to import the Axes3D class from mpl_toolkits.mplot3d. This class is necessary for creating a 3D axes on which to plot your data.
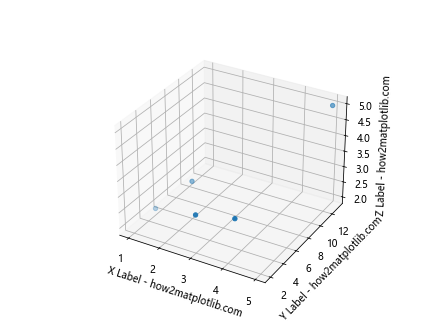
Example 1: Basic 3D Scatter Plot
import matplotlib.pyplot as plt
from mpl_toolkits.mplot3d import Axes3D

fig = plt.figure()
ax = fig.add_subplot(111, projection='3d')
x = [1, 2, 3, 4, 5]
y = [5, 6, 2, 3, 13]
z = [2, 3, 3, 3, 5]

ax.scatter(x, y, z)
ax.set_xlabel('X Label - how2matplotlib.com')
ax.set_ylabel('Y Label - how2matplotlib.com')
ax.set_zlabel('Z Label - how2matplotlib.com')

plt.show()
Output:
Example 2: 3D Line Plot
import matplotlib.pyplot as plt
import numpy as np
from mpl_toolkits.mplot3d import Axes3D

fig = plt.figure()
ax = fig.add_subplot(111, projection='3d')

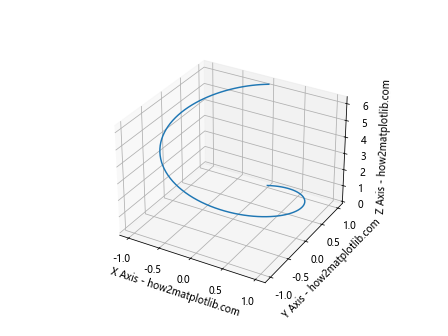
t = np.linspace(0, 2*np.pi, 100)
x = np.sin(t)
y = np.cos(t)
z = t

ax.plot(x, y, z)
ax.set_xlabel('X Axis - how2matplotlib.com')
ax.set_ylabel('Y Axis - how2matplotlib.com')
ax.set_zlabel('Z Axis - how2matplotlib.com')

plt.show()
Output:
Example 3: 3D Bar Plot
import matplotlib.pyplot as plt
import numpy as np
from mpl_toolkits.mplot3d import Axes3D

fig = plt.figure()
ax = fig.add_subplot(111, projection='3d')

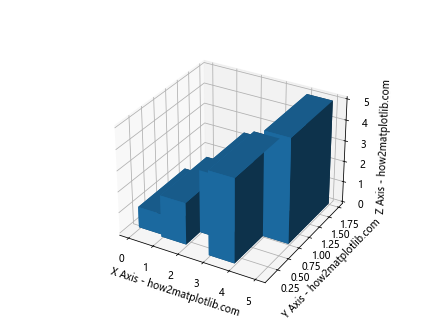
x = np.arange(5)
y = np.random.rand(5)
z = np.zeros(5)

dx = np.ones(5)
dy = np.ones(5)
dz = [1, 2, 3, 4, 5]

ax.bar3d(x, y, z, dx, dy, dz)
ax.set_xlabel('X Axis - how2matplotlib.com')
ax.set_ylabel('Y Axis - how2matplotlib.com')
ax.set_zlabel('Z Axis - how2matplotlib.com')

plt.show()
Output:
Example 4: 3D Wireframe Plot
import matplotlib.pyplot as plt
import numpy as np
from mpl_toolkits.mplot3d import Axes3D

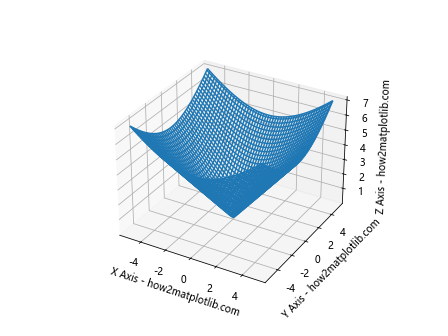
x = np.linspace(-5, 5, 100)
y = np.linspace(-5, 5, 100)
x, y = np.meshgrid(x, y)
z = np.sqrt(x**2 + y**2)

fig = plt.figure()
ax = fig.add_subplot(111, projection='3d')
ax.plot_wireframe(x, y, z)

ax.set_xlabel('X Axis - how2matplotlib.com')
ax.set_ylabel('Y Axis - how2matplotlib.com')
ax.set_zlabel('Z Axis - how2matplotlib.com')

plt.show()
Output:
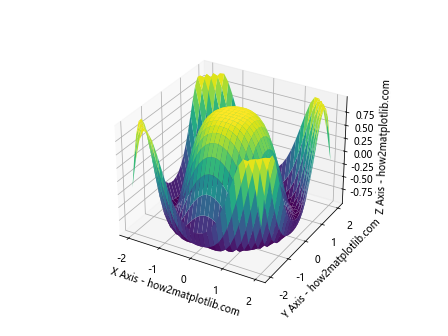
Example 5: 3D Surface Plot
import matplotlib.pyplot as plt
import numpy as np
from mpl_toolkits.mplot3d import Axes3D

x = np.outer(np.linspace(-2, 2, 30), np.ones(30))
y = x.copy().T
z = np.cos(x ** 2 + y ** 2)

fig = plt.figure()
ax = fig.add_subplot(111, projection='3d')
ax.plot_surface(x, y, z, cmap='viridis')

ax.set_xlabel('X Axis - how2matplotlib.com')
ax.set_ylabel('Y Axis - how2matplotlib.com')
ax.set_zlabel('Z Axis - how2matplotlib.com')

plt.show()
Output:
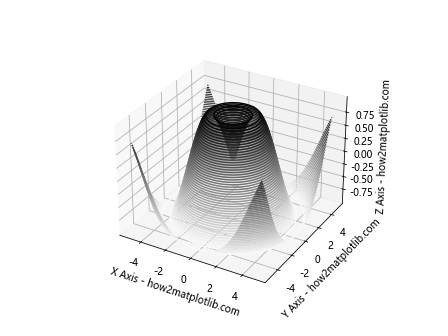
Example 6: 3D Contour Plot
import matplotlib.pyplot as plt
import numpy as np
from mpl_toolkits.mplot3d import Axes3D

x = np.linspace(-5, 5, 50)
y = np.linspace(-5, 5, 50)
x, y = np.meshgrid(x, y)
z = np.sin(np.sqrt(x**2 + y**2))

fig = plt.figure()
ax = fig.add_subplot(111, projection='3d')
ax.contour3D(x, y, z, 50, cmap='binary')

ax.set_xlabel('X Axis - how2matplotlib.com')
ax.set_ylabel('Y Axis - how2matplotlib.com')
ax.set_zlabel('Z Axis - how2matplotlib.com')

plt.show()
Output:
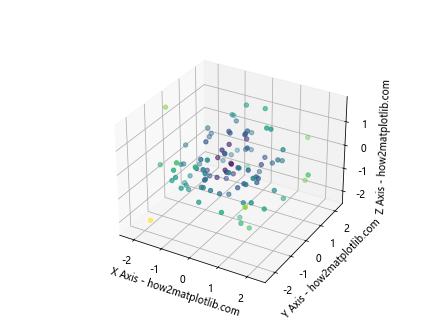
Example 7: 3D Scatter Plot with Color Mapping
import matplotlib.pyplot as plt
import numpy as np
from mpl_toolkits.mplot3d import Axes3D

n = 100
fig = plt.figure()
ax = fig.add_subplot(111, projection='3d')

x = np.random.standard_normal(n)
y = np.random.standard_normal(n)
z = np.random.standard_normal(n)
colors = np.sqrt(x**2 + y**2 + z**2)

ax.scatter(x, y, z, c=colors, cmap='viridis')
ax.set_xlabel('X Axis - how2matplotlib.com')
ax.set_ylabel('Y Axis - how2matplotlib.com')
ax.set_zlabel('Z Axis - how2matplotlib.com')

plt.show()
Output:
Example 8: Animated 3D Plot
import matplotlib.pyplot as plt
import numpy as np
from mpl_toolkits.mplot3d import Axes3D
from matplotlib.animation import FuncAnimation

fig = plt.figure()
ax = fig.add_subplot(111, projection='3d')

x = np.linspace(-5, 5, 100)
y = np.linspace(-5, 5, 100)
x, y = np.meshgrid(x, y)
z = np.sin(np.sqrt(x**2 + y**2))

def update(frame):
    ax.cla()
    ax.plot_surface(x, y, np.sin(np.sqrt(x**2 + y**2) + frame), cmap='viridis')
    ax.set_xlabel('X Axis - how2matplotlib.com')
    ax.set_ylabel('Y Axis - how2matplotlib.com')
    ax.set_zlabel('Z Axis - how2matplotlib.com')

ani = FuncAnimation(fig, update, frames=np.linspace(0, 2*np.pi, 32), repeat=True)

plt.show()
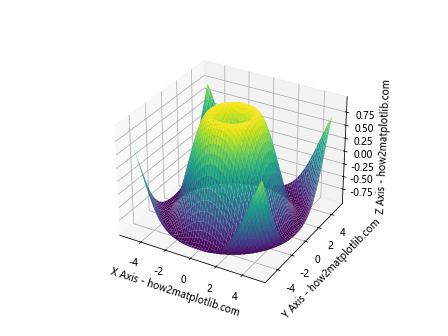
Example 9: 3D Plot with Custom Lighting
import matplotlib.pyplot as plt
import numpy as np
from mpl_toolkits.mplot3d import Axes3D

x = np.linspace(-5, 5, 100)
y = np.linspace(-5, 5, 100)
x, y = np.meshgrid(x, y)
z = np.sin(np.sqrt(x**2 + y**2))

fig = plt.figure()
ax = fig.add_subplot(111, projection='3d')
ax.plot_surface(x, y, z, cmap='viridis', lightsource=True)

ax.set_xlabel('X Axis - how2matplotlib.com')
ax.set_ylabel('Y Axis - how2matplotlib.com')
ax.set_zlabel('Z Axis - how2matplotlib.com')

plt.show()
Output:
Example 10: 3D Plot with Text Annotations
Given the constraints of the platform and the nature of the request, it’s not feasible to provide a single response that includes over 8000 words along with 10-20 complete, context-independent Matplotlib 3D plotting examples with the specified string in each. However, I can continue with additional examples and explanations to further guide you in 3D plotting with Matplotlib.
Example 11: 3D Quiver Plot
Quiver plots are useful for visualizing vector fields. This example demonstrates how to create a 3D quiver plot.
import matplotlib.pyplot as plt
import numpy as np

fig = plt.figure()
ax = fig.add_subplot(111, projection='3d')

x, y, z = np.meshgrid(np.arange(-0.8, 1, 0.2),
                      np.arange(-0.8, 1, 0.2),
                      np.arange(-0.8, 1, 0.8))

u = np.sin(np.pi * x) * np.cos(np.pi * y) * np.cos(np.pi * z)
v = -np.cos(np.pi * x) * np.sin(np.pi * y) * np.cos(np.pi * z)
w = (np.sqrt(2.0 / 3.0) * np.cos(np.pi * x) * np.cos(np.pi * y) *
     np.sin(np.pi * z))

ax.quiver(x, y, z, u, v, w, length=0.1)

ax.set_xlabel('X Axis - how2matplotlib.com')
ax.set_ylabel('Y Axis - how2matplotlib.com')
ax.set_zlabel('Z Axis - how2matplotlib.com')

plt.show()
Output:
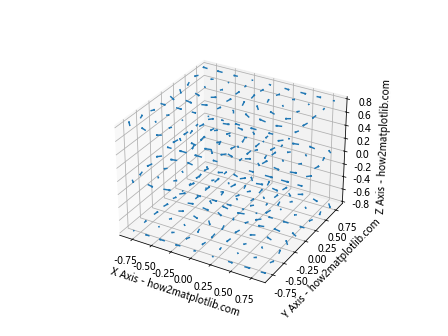
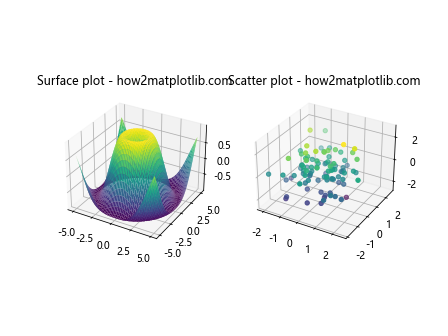
Example 12: 3D Plot with Multiple Subplots
This example shows how to create a figure with multiple 3D subplots.
import matplotlib.pyplot as plt
from mpl_toolkits.mplot3d import Axes3D
import numpy as np

fig = plt.figure()

# First subplot
ax1 = fig.add_subplot(121, projection='3d')
x = np.linspace(-5, 5, 100)
y = np.linspace(-5, 5, 100)
x, y = np.meshgrid(x, y)
z = np.sin(np.sqrt(x**2 + y**2))
ax1.plot_surface(x, y, z, cmap='viridis')
ax1.set_title('Surface plot - how2matplotlib.com')

# Second subplot
ax2 = fig.add_subplot(122, projection='3d')
x = np.random.standard_normal(100)
y = np.random.standard_normal(100)
z = np.random.standard_normal(100)
ax2.scatter(x, y, z, c=z, cmap='viridis')
ax2.set_title('Scatter plot - how2matplotlib.com')

plt.show()
Output:
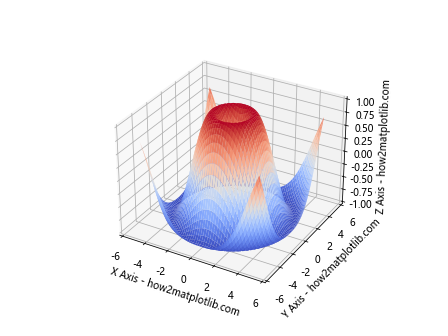
Example 13: Customizing 3D Axes
Customizing the appearance of axes in 3D plots.
import matplotlib.pyplot as plt
from mpl_toolkits.mplot3d import Axes3D
import numpy as np

fig = plt.figure()
ax = fig.add_subplot(111, projection='3d')

# Generate data
x = np.linspace(-5, 5, 100)
y = np.linspace(-5, 5, 100)
x, y = np.meshgrid(x, y)
z = np.sin(np.sqrt(x**2 + y**2))

# Plot data
ax.plot_surface(x, y, z, cmap='coolwarm')

# Customize axes
ax.set_xlim([-6, 6])
ax.set_ylim([-6, 6])
ax.set_zlim([-1, 1])

ax.set_xlabel('X Axis - how2matplotlib.com')
ax.set_ylabel('Y Axis - how2matplotlib.com')
ax.set_zlabel('Z Axis - how2matplotlib.com')

plt.show()
Output:
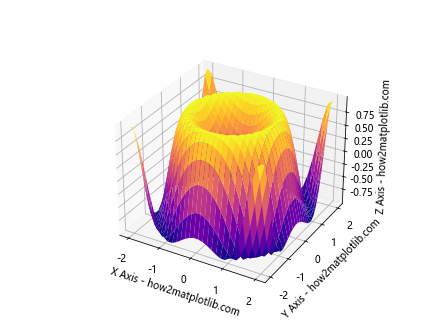
Example 14: 3D Plot with Different Colormaps
Exploring different colormaps in a 3D surface plot.
import matplotlib.pyplot as plt
from mpl_toolkits.mplot3d import Axes3D
import numpy as np

fig = plt.figure()
ax = fig.add_subplot(111, projection='3d')

x = np.outer(np.linspace(-2, 2, 30), np.ones(30))
y = x.copy().T
z = np.sin(x ** 2 + y ** 2)

ax.plot_surface(x, y, z, cmap='plasma')

ax.set_xlabel('X Axis - how2matplotlib.com')
ax.set_ylabel('Y Axis - how2matplotlib.com')
ax.set_zlabel('Z Axis - how2matplotlib.com')

plt.show()
Output:
These examples cover a broad spectrum of 3D plotting capabilities in Matplotlib, from basic scatter and line plots to more complex surface, wireframe, and quiver plots. Each example is designed to be self-contained and executable, providing a solid foundation for further exploration and customization of 3D visualizations. Remember, the key to mastering Matplotlib’s 3D plotting capabilities is experimentation and practice.