Marker Size in Matplotlib
Matplotlib is a powerful visualization library in Python that allows you to create stunning plots and graphs. One important aspect of plotting data is customizing the markers, which are used to represent data points in scatter plots and line plots. In this article, we will explore how to adjust the size of the markers in Matplotlib to make your plots more visually appealing and informative.
Setting Marker Size in Scatter Plot
In a scatter plot, marker size can be adjusted using the s parameter in the scatter function. This parameter controls the size of the markers. Let’s create a simple scatter plot with different marker sizes.
import matplotlib.pyplot as plt

# Data
x = [1, 2, 3, 4, 5]
y = [10, 15, 13, 18, 16]
sizes = [20, 50, 80, 110, 140]

# Plot
plt.scatter(x, y, s=sizes)
plt.show()
Output:
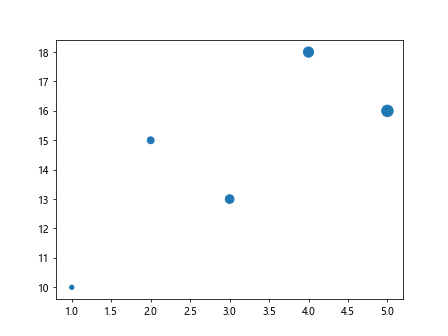
The above code will generate a scatter plot with different marker sizes for each data point. You can adjust the sizes list to change the size of the markers.
Setting Marker Size in Line Plot
In a line plot, marker size can be adjusted using the markersize parameter in the plot function. This parameter controls the size of the markers placed on the line. Let’s create a line plot with markers of different sizes.
import matplotlib.pyplot as plt

# Data
x = [1, 2, 3, 4, 5]
y = [10, 15, 13, 18, 16]
sizes = [5, 10, 15, 20, 25]

# Plot
plt.plot(x, y, marker='o', markersize=sizes)
plt.show()
The above code will generate a line plot with markers of different sizes. You can adjust the sizes list to change the size of the markers.
Customizing Marker Size in Matplotlib
You can further customize the marker size in Matplotlib by using a colormap to set the sizes based on a variable. Let’s create a scatter plot where the marker size is based on a third variable.
import numpy as np
import matplotlib.pyplot as plt

# Data
x = np.random.rand(50)
y = np.random.rand(50)
sizes = np.random.rand(50) * 1000

# Plot
plt.scatter(x, y, s=sizes, cmap='viridis', alpha=0.5)
plt.colorbar()
plt.show()
In the above code, the sizes list is randomly generated to act as a third variable influencing the marker size. The cmap parameter is used to set the color map for the markers, and the alpha parameter controls the transparency of the markers.
Changing Marker Size Dynamically
You can also change the marker size dynamically based on the data values. Let’s create a scatter plot where the marker size is proportional to the data values themselves.
import numpy as np
import matplotlib.pyplot as plt

# Data
x = np.random.rand(50)
y = np.random.rand(50)
sizes = np.linspace(10, 200, 50)  # Marker sizes based on data values

# Plot
plt.scatter(x, y, s=sizes, alpha=0.5)
plt.show()
Output:
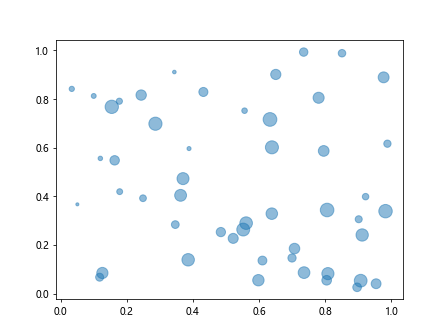
In the above code, the sizes list is generated based on the data values, creating markers of varying sizes based on the data distribution.
Using Marker Size with 3D Plots
Marker size can also be adjusted in 3D plots in Matplotlib. Let’s create a 3D scatter plot with different marker sizes.
import numpy as np
import matplotlib.pyplot as plt
from mpl_toolkits.mplot3d import Axes3D

# Data
x = np.random.rand(50)
y = np.random.rand(50)
z = np.random.rand(50)
sizes = np.random.rand(50) * 100

# Plot
fig = plt.figure()
ax = fig.add_subplot(111, projection='3d')
ax.scatter(x, y, z, s=sizes)
plt.show()
Output:
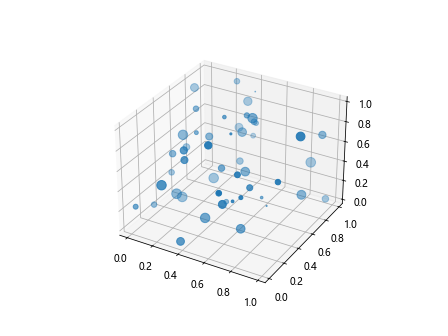
The above code will generate a 3D scatter plot with markers of different sizes in the 3D space.
Adjusting Marker Size in Subplots
You can create subplots in Matplotlib with different marker sizes for each subplot. Let’s create two subplots with different marker sizes.
import matplotlib.pyplot as plt

# Data
x1 = [1, 2, 3, 4, 5]
y1 = [10, 15, 13, 18, 16]
sizes1 = [20, 50, 80, 110, 140]

x2 = [1, 2, 3, 4, 5]
y2 = [5, 8, 6, 12, 9]
sizes2 = [30, 60, 90, 120, 150]

# Create subplots
fig, (ax1, ax2) = plt.subplots(1, 2)

# Subplot 1
ax1.scatter(x1, y1, s=sizes1)
ax1.set_title('Subplot 1')

# Subplot 2
ax2.scatter(x2, y2, s=sizes2)
ax2.set_title('Subplot 2')

plt.show()
Output:
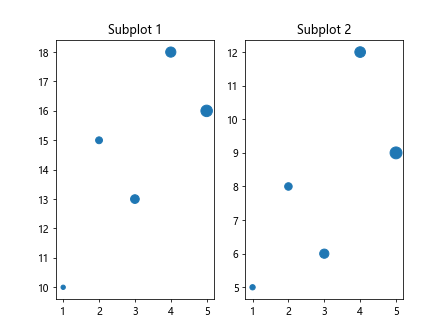
The above code will generate two subplots with different marker sizes for each subplot.
Using Different Marker Types with Marker Size
You can combine different marker types with marker size in Matplotlib for more visually appealing plots. Let’s create a scatter plot with different marker types and sizes.
import matplotlib.pyplot as plt

# Data
x = [1, 2, 3, 4, 5]
y = [10, 15, 13, 18, 16]
sizes = [20, 40, 60, 80, 100]

# Plot
plt.scatter(x, y, s=sizes, marker='o')
plt.scatter(x, [8, 12, 10, 16, 14], s=sizes, marker='^')
plt.show()
Output:
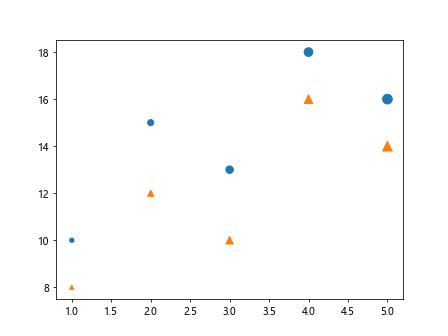
In the above code, two scatter plots with different marker types (o and ^) and sizes are overlaid for comparison.
Customizing Marker Size in Legends
You can customize the marker size in legends in Matplotlib plots. Let’s create a scatter plot with a legend showing different marker sizes.
import matplotlib.pyplot as plt

# Data
x = [1, 2, 3, 4, 5]
y1 = [10, 15, 13, 18, 16]
y2 = [5, 8, 6, 12, 9]

# Plot
plt.scatter(x, y1, s=100, label='Group 1')
plt.scatter(x, y2, s=50, label='Group 2')
plt.legend(markerscale=0.5)
plt.show()
Output:
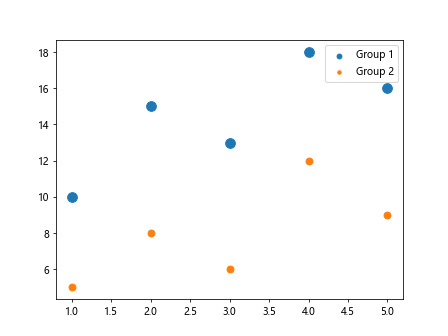
In the above code, the markerscale parameter in the legend function is used to scale the size of the markers in the legend.
Using Marker Size with Error Bars
You can incorporate error bars in a plot with varying marker sizes in Matplotlib. Let’s create a plot with error bars and markers of different sizes.
import matplotlib.pyplot as plt

# Data
x = range(1, 6)
y = [10, 15, 13, 18, 16]
errors = [1, 2, 1, 3, 2]
sizes = [20, 40, 60, 80, 100]

# Plot with error bars
plt.errorbar(x, y, yerr=errors, fmt='o', markersize=sizes)
plt.show()
In the above code, error bars are added to the plot with markers of varying sizes specified by the sizes list.