Line Plot with Matplotlib
Matplotlib is a popular Python library for creating static, interactive, and animated plots. In this article, we will focus on creating line plots with Matplotlib. Line plots are one of the most common types of plots used to visualize data. They can help show trends, patterns, and relationships in the data.
Installing Matplotlib
Before we can start creating line plots with Matplotlib, we need to install the library. You can install Matplotlib using pip, the Python package installer. Run the following command in your terminal:
pip install matplotlib
Now that we have Matplotlib installed, we can begin creating our line plots.
Basic Line Plot in Matplotlib
Let’s start by creating a basic line plot to visualize a simple data set. In this example, we will plot the sine function over the range [-2π, 2π].
import matplotlib.pyplot as plt
import numpy as np

# Generate data
x = np.linspace(-2*np.pi, 2*np.pi, 100)
y = np.sin(x)

# Create the plot
plt.plot(x, y)
plt.xlabel('x')
plt.ylabel('sin(x)')
plt.title('Sine Function')
plt.show()
Output:
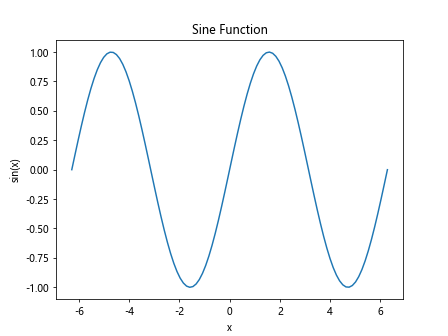
When you run this code, you should see a plot of the sine function over the specified range. The x-axis represents the input values, while the y-axis represents the output values of the sine function.
Customizing Line Plots
Matplotlib provides a lot of customization options for line plots. You can change the color, line style, marker style, and more. Let’s look at how we can customize a line plot with some examples.
Changing Line Color
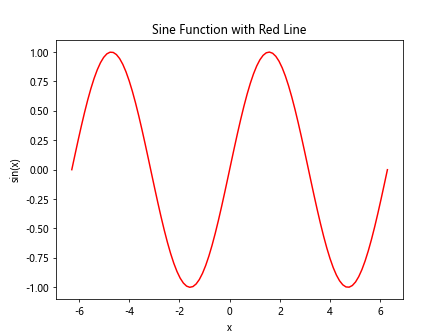
You can change the color of the line in a plot by specifying the color parameter in the plot function.
import matplotlib.pyplot as plt
import numpy as np

# Generate data
x = np.linspace(-2*np.pi, 2*np.pi, 100)
y = np.sin(x)

# Create the plot with a custom line color
plt.plot(x, y, color='red')
plt.xlabel('x')
plt.ylabel('sin(x)')
plt.title('Sine Function with Red Line')
plt.show()
Output:
Adding Markers
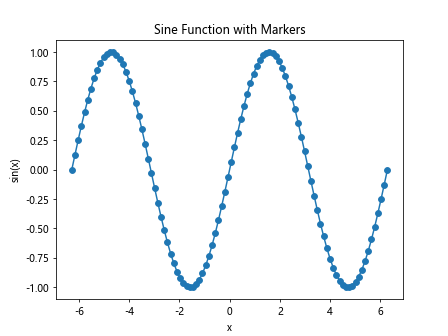
You can add markers to the data points in a line plot using the marker parameter in the plot function.
import matplotlib.pyplot as plt
import numpy as np

# Generate data
x = np.linspace(-2*np.pi, 2*np.pi, 100)
y = np.sin(x)

# Create the plot with markers
plt.plot(x, y, marker='o')
plt.xlabel('x')
plt.ylabel('sin(x)')
plt.title('Sine Function with Markers')
plt.show()
Output:
Changing Line Style
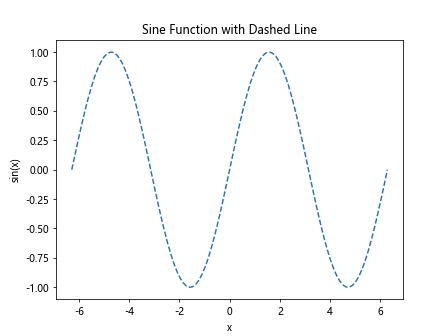
You can change the line style in a plot by specifying the linestyle parameter in the plot function.
import matplotlib.pyplot as plt
import numpy as np

# Generate data
x = np.linspace(-2*np.pi, 2*np.pi, 100)
y = np.sin(x)

# Create the plot with a dashed line
plt.plot(x, y, linestyle='--')
plt.xlabel('x')
plt.ylabel('sin(x)')
plt.title('Sine Function with Dashed Line')
plt.show()
Output:
Multiple Lines on One Plot
You can plot multiple lines on the same plot by calling the plot function multiple times before showing the plot.
import matplotlib.pyplot as plt
import numpy as np

# Generate data
x = np.linspace(-2*np.pi, 2*np.pi, 100)
y = np.sin(x)

# Generate data for cosine function
y_cos = np.cos(x)

# Create the plot with sine and cosine functions
plt.plot(x, y, label='sin(x)')
plt.plot(x, y_cos, label='cos(x)')
plt.xlabel('x')
plt.ylabel('y')
plt.title('Sine and Cosine Functions')
plt.legend()
plt.show()
Output:
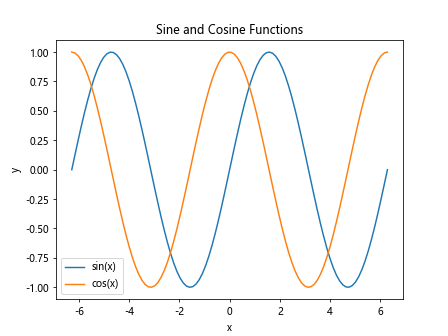
In this example, we have plotted both the sine and cosine functions on the same plot. The legend function is used to show a legend that labels each line.
Subplots
You can create multiple subplots in a single figure using Matplotlib. Subplots allow you to visualize different data sets or comparisons side by side.
import matplotlib.pyplot as plt
import numpy as np

# Generate data
x = np.linspace(-2*np.pi, 2*np.pi, 100)
y = np.sin(x)

# Create subplots for sine and cosine functions
fig, axs = plt.subplots(2)
axs[0].plot(x, y)
axs[0].set_title('Sine Function')

axs[1].plot(x, y_cos)
axs[1].set_title('Cosine Function')

plt.tight_layout()
plt.show()
In this example, we have created two subplots, one for the sine function and one for the cosine function. The subplots function is used to create multiple axes objects that can be accessed using the axs variable.
Adding Annotations
You can add annotations to your line plots using the text function in Matplotlib.
import matplotlib.pyplot as plt
import numpy as np

# Generate data
x = np.linspace(-2*np.pi, 2*np.pi, 100)
y = np.sin(x)

plt.plot(x, y)
plt.text(0, 0, 'Origin', fontsize=12, color='red')
plt.xlabel('x')
plt.ylabel('sin(x)')
plt.title('Sine Function with Annotation')
plt.show()
Output:
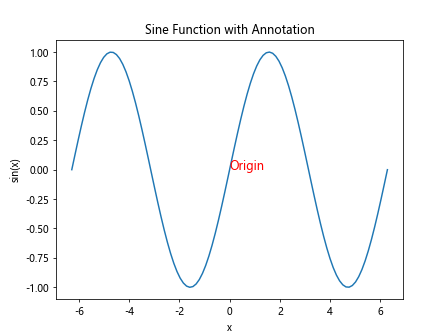
In this example, we have added an annotation at the origin of the plot with the text “Origin.” You can customize the font size, color, and position of the annotation.
Saving Plots
You can save your line plots as image files by using the savefig function in Matplotlib.
import matplotlib.pyplot as plt
import numpy as np

# Generate data
x = np.linspace(-2*np.pi, 2*np.pi, 100)
y = np.sin(x)

plt.plot(x, y)
plt.xlabel('x')
plt.ylabel('sin(x)')
plt.title('Sine Function')
plt.savefig('sine_plot.png')
This code will save the plot as a PNG image file named “sine_plot.png” in the current directory.
Line Plot with Matplotlib Conclusion
In this article, we have explored how to create line plots using Matplotlib in Python. We started with a basic line plot and then looked at customizing line plots, plotting multiple lines, creating subplots, adding annotations, and saving plots as image files. Line plots are a powerful tool for visualizing data and can help you gain insights into your data. Matplotlib provides a lot of flexibility in creating and customizing line plots to suit your needs. Experiment with the examples provided in this article to create your own line plots and explore the different customization options available in Matplotlib.