How to Increase the Line Thickness in Matplotlib
Increase the thickness of a line with Matplotlib is an essential skill for data visualization enthusiasts and professionals alike. This article will delve deep into the various methods and techniques to increase the thickness of a line in Matplotlib, providing you with a comprehensive understanding of this crucial aspect of data visualization. We’ll explore different approaches, discuss best practices, and provide numerous examples to help you master the art of line thickness manipulation in Matplotlib.
Understanding Line Thickness in Matplotlib
Before we dive into the specifics of how to increase the thickness of a line with Matplotlib, it’s important to understand what line thickness represents in data visualization. Line thickness, also known as line width, is a visual property that determines how bold or prominent a line appears in a plot. By increasing the thickness of a line, you can emphasize certain data points, trends, or relationships in your visualizations.
Matplotlib, being a powerful and flexible plotting library for Python, offers several ways to increase the thickness of a line. The most common method is by using the linewidth or lw parameter in various plotting functions. Let’s start with a basic example to illustrate this concept:
import matplotlib.pyplot as plt
import numpy as np

x = np.linspace(0, 10, 100)
y = np.sin(x)

plt.figure(figsize=(10, 6))
plt.plot(x, y, linewidth=2, label='how2matplotlib.com')
plt.title('Increase the thickness of a line with Matplotlib')
plt.xlabel('X-axis')
plt.ylabel('Y-axis')
plt.legend()
plt.show()
Output:
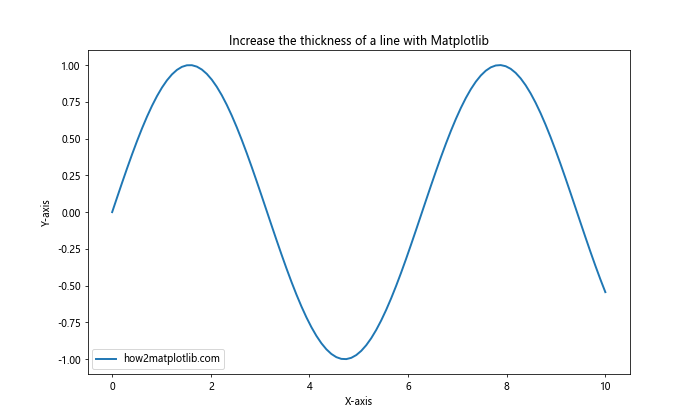
In this example, we’ve set the linewidth parameter to 2, which increases the thickness of the line compared to the default value. This simple adjustment can make your plot more visually appealing and easier to read.
Methods to Increase Line Thickness in Matplotlib
Now that we’ve covered the basics, let’s explore various methods to increase the thickness of a line with Matplotlib. We’ll discuss different approaches and provide examples for each technique.
1. Using the linewidth Parameter
The most straightforward way to increase the thickness of a line with Matplotlib is by using the linewidth or lw parameter. This parameter can be used with various plotting functions such as plot(), scatter(), bar(), and more. Let’s look at an example that demonstrates how to use this parameter with different line styles:
import matplotlib.pyplot as plt
import numpy as np

x = np.linspace(0, 10, 100)
y1 = np.sin(x)
y2 = np.cos(x)
y3 = np.tan(x)

plt.figure(figsize=(12, 8))
plt.plot(x, y1, linewidth=1, label='Thin line - how2matplotlib.com')
plt.plot(x, y2, linewidth=3, label='Medium line - how2matplotlib.com')
plt.plot(x, y3, linewidth=5, label='Thick line - how2matplotlib.com')
plt.title('Increase the thickness of a line with Matplotlib')
plt.xlabel('X-axis')
plt.ylabel('Y-axis')
plt.legend()
plt.ylim(-2, 2)
plt.show()
Output:
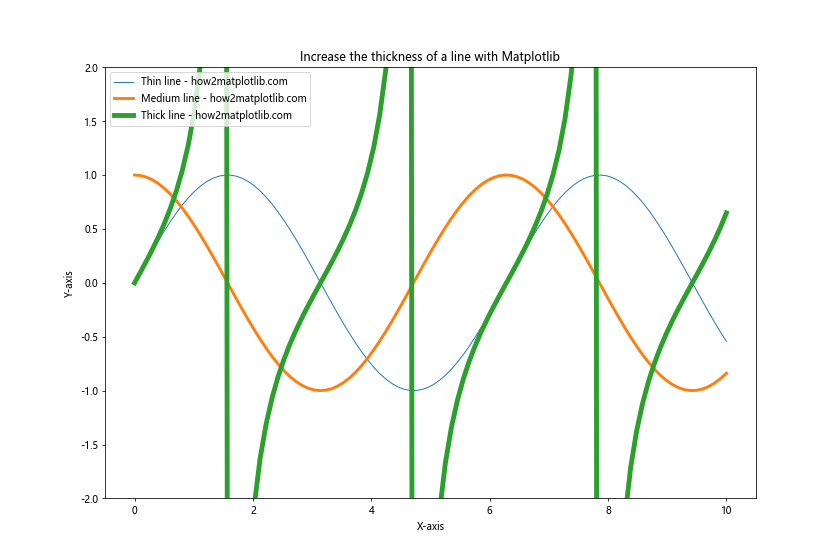
In this example, we’ve created three lines with different thicknesses using the linewidth parameter. The first line has a thickness of 1 (thin), the second line has a thickness of 3 (medium), and the third line has a thickness of 5 (thick). This demonstrates how you can use different line thicknesses to emphasize certain data series or create visual hierarchy in your plots.
2. Adjusting Line Thickness for Specific Plot Elements
When working with more complex plots, you may want to increase the thickness of a line for specific elements such as axes, grid lines, or error bars. Matplotlib provides ways to adjust the line thickness for these elements individually. Let’s look at an example that demonstrates how to increase the thickness of axes and grid lines:
import matplotlib.pyplot as plt
import numpy as np

x = np.linspace(0, 10, 100)
y = np.sin(x)

fig, ax = plt.subplots(figsize=(10, 6))
ax.plot(x, y, linewidth=2, label='how2matplotlib.com')
ax.set_title('Increase the thickness of a line with Matplotlib')
ax.set_xlabel('X-axis')
ax.set_ylabel('Y-axis')

# Increase thickness of axes lines
ax.spines['top'].set_linewidth(2)
ax.spines['right'].set_linewidth(2)
ax.spines['bottom'].set_linewidth(2)
ax.spines['left'].set_linewidth(2)

# Increase thickness of grid lines
ax.grid(True, linewidth=1.5)

ax.legend()
plt.show()
Output:
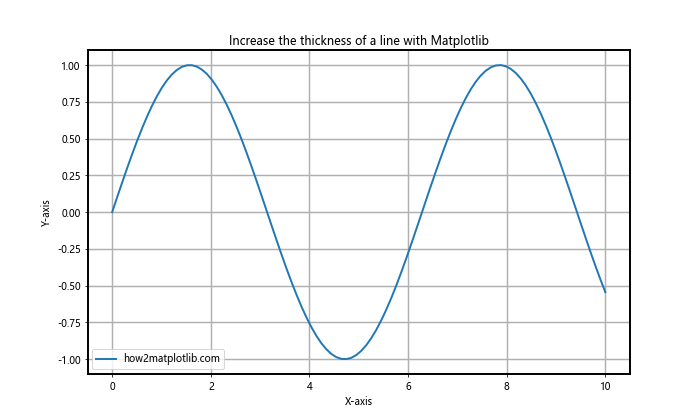
In this example, we’ve increased the thickness of the axes lines using the set_linewidth() method on each spine of the axes. We’ve also increased the thickness of the grid lines by setting the linewidth parameter in the grid() function.
3. Using Line2D Properties
For more fine-grained control over line properties, you can use the Line2D class in Matplotlib. This class allows you to set various properties of a line, including its thickness. Here’s an example that demonstrates how to use Line2D to increase the thickness of a line:
import matplotlib.pyplot as plt
import numpy as np
from matplotlib.lines import Line2D

x = np.linspace(0, 10, 100)
y = np.sin(x)

fig, ax = plt.subplots(figsize=(10, 6))
line = Line2D(x, y, linewidth=3, color='blue', label='how2matplotlib.com')
ax.add_line(line)
ax.set_xlim(0, 10)
ax.set_ylim(-1.5, 1.5)
ax.set_title('Increase the thickness of a line with Matplotlib')
ax.set_xlabel('X-axis')
ax.set_ylabel('Y-axis')
ax.legend()
plt.show()
Output:
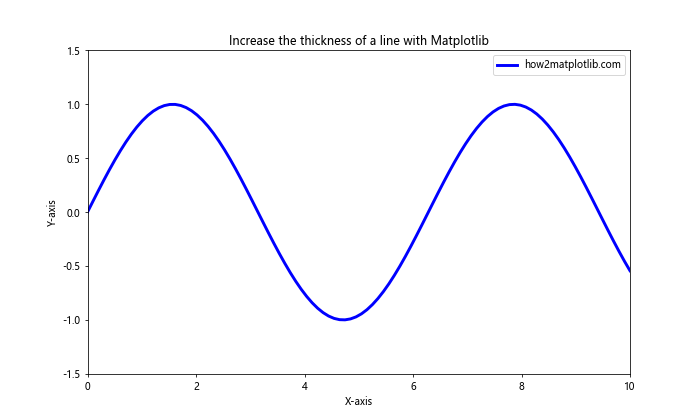
In this example, we’ve created a Line2D object with a specified line thickness of 3. We then added this line to the axes using the add_line() method. This approach gives you more control over the line properties and allows you to create custom line styles.
4. Adjusting Line Thickness in Seaborn
Seaborn, a statistical data visualization library built on top of Matplotlib, also allows you to increase the thickness of a line. While Seaborn provides a higher-level interface for creating statistical graphics, it still uses Matplotlib under the hood. Here’s an example of how to increase line thickness in a Seaborn plot:
import matplotlib.pyplot as plt
import seaborn as sns
import numpy as np

x = np.linspace(0, 10, 100)
y = np.sin(x)

sns.set_style("whitegrid")
plt.figure(figsize=(10, 6))
sns.lineplot(x=x, y=y, linewidth=3, label='how2matplotlib.com')
plt.title('Increase the thickness of a line with Matplotlib (Seaborn)')
plt.xlabel('X-axis')
plt.ylabel('Y-axis')
plt.legend()
plt.show()
Output:
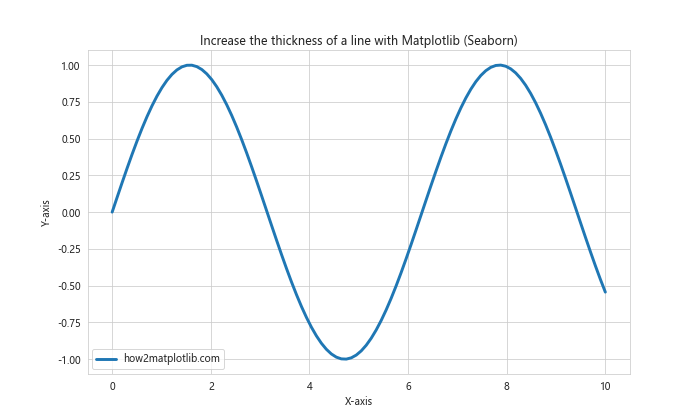
In this example, we’ve used Seaborn’s lineplot() function to create a line plot with increased thickness. The linewidth parameter works similarly to Matplotlib’s implementation.
Advanced Techniques for Line Thickness Manipulation
Now that we’ve covered the basics of how to increase the thickness of a line with Matplotlib, let’s explore some advanced techniques that will give you even more control over your visualizations.
1. Varying Line Thickness Along a Path
Sometimes, you may want to vary the thickness of a line along its path to emphasize certain sections or represent additional data dimensions. Matplotlib provides a way to achieve this using the LineCollection class. Here’s an example:
import matplotlib.pyplot as plt
import numpy as np
from matplotlib.collections import LineCollection

x = np.linspace(0, 10, 100)
y = np.sin(x)

points = np.array([x, y]).T.reshape(-1, 1, 2)
segments = np.concatenate([points[:-1], points[1:]], axis=1)

fig, ax = plt.subplots(figsize=(10, 6))
lc = LineCollection(segments, linewidths=np.linspace(1, 5, len(segments)),
                    label='how2matplotlib.com')
ax.add_collection(lc)
ax.set_xlim(x.min(), x.max())
ax.set_ylim(y.min(), y.max())
ax.set_title('Increase the thickness of a line with Matplotlib (Varying Thickness)')
ax.set_xlabel('X-axis')
ax.set_ylabel('Y-axis')
ax.legend()
plt.show()
Output:
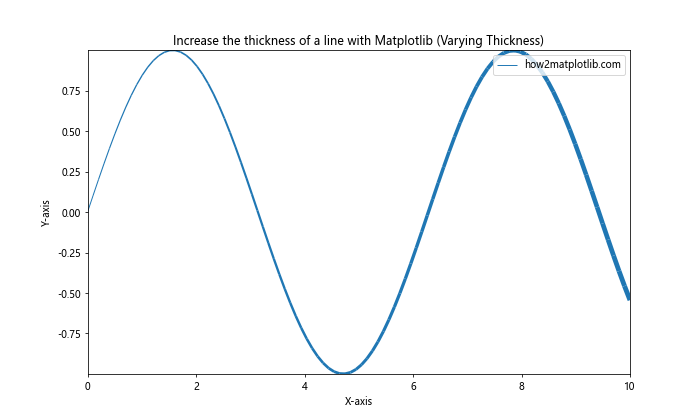
In this example, we’ve created a LineCollection object with varying line thicknesses. The linewidths parameter is set to a linear space from 1 to 5, which creates a gradual increase in line thickness along the path.
2. Using Line Thickness to Represent Data
Another advanced technique is to use line thickness to represent an additional dimension of your data. This can be particularly useful when you want to visualize three-dimensional data on a two-dimensional plot. Here’s an example that demonstrates this concept:
import matplotlib.pyplot as plt
import numpy as np

x = np.linspace(0, 10, 100)
y1 = np.sin(x)
y2 = np.cos(x)
thickness = np.abs(y1 - y2)

fig, ax = plt.subplots(figsize=(10, 6))
for i in range(len(x) - 1):
    ax.plot(x[i:i+2], y1[i:i+2], linewidth=thickness[i]*5, color='blue')
    ax.plot(x[i:i+2], y2[i:i+2], linewidth=thickness[i]*5, color='red')

ax.set_title('Increase the thickness of a line with Matplotlib (Data Representation)')
ax.set_xlabel('X-axis')
ax.set_ylabel('Y-axis')
ax.text(5, 0.5, 'how2matplotlib.com', fontsize=12, ha='center')
plt.show()
Output:
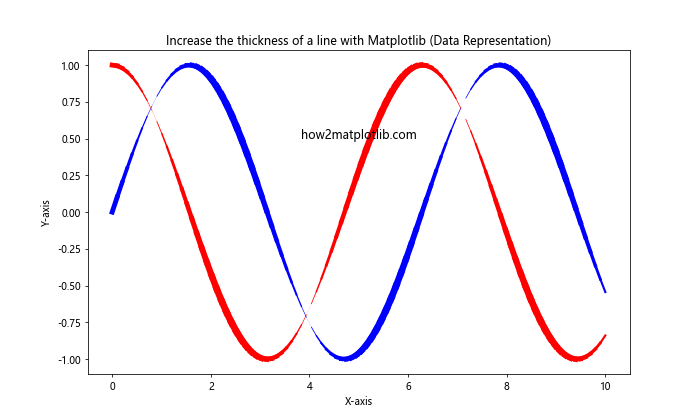
In this example, we’ve used the absolute difference between two sine waves to determine the line thickness. This creates a visual representation of how the two waves diverge and converge over time.
3. Animating Line Thickness Changes
To create more dynamic visualizations, you can animate changes in line thickness. This can be useful for emphasizing certain parts of your data over time or creating engaging presentations. Here’s an example of how to create a simple animation of line thickness changes:
import matplotlib.pyplot as plt
import numpy as np
from matplotlib.animation import FuncAnimation

x = np.linspace(0, 10, 100)
y = np.sin(x)

fig, ax = plt.subplots(figsize=(10, 6))
line, = ax.plot(x, y, label='how2matplotlib.com')
ax.set_title('Increase the thickness of a line with Matplotlib (Animation)')
ax.set_xlabel('X-axis')
ax.set_ylabel('Y-axis')
ax.legend()

def update(frame):
    line.set_linewidth(frame / 10)
    return line,

ani = FuncAnimation(fig, update, frames=np.linspace(1, 50, 200), interval=50, blit=True)
plt.show()
Output:
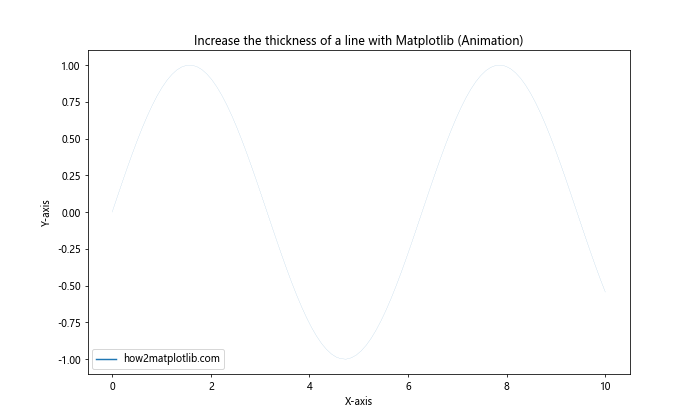
In this example, we’ve created an animation that gradually increases the line thickness over time. The update() function changes the line width based on the current frame number, creating a smooth transition effect.
Best Practices for Increasing Line Thickness
When working to increase the thickness of a line with Matplotlib, it’s important to follow some best practices to ensure your visualizations are effective and visually appealing. Here are some tips to keep in mind:
- Consistency: When using multiple lines in a single plot, maintain consistent line thicknesses unless you’re intentionally emphasizing certain lines.
Readability: While thicker lines can make your plot more visible, excessively thick lines can obscure data points or make it difficult to discern fine details. Strike a balance between visibility and clarity.
Color and Thickness: Consider the relationship between line color and thickness. Lighter colors may require thicker lines to be visible, while darker colors can be effective with thinner lines.
Purpose: Use line thickness purposefully. Increase thickness to highlight important trends or data series, rather than arbitrarily thickening all lines.
Scale: Consider the size of your plot when determining line thickness. What looks good on a small plot may be too thick when the plot is enlarged.
Let’s look at an example that demonstrates these best practices: