How to Turn Off the Axes for Subplots in Matplotlib
How to Turn Off the Axes for Subplots in Matplotlib is an essential skill for data visualization enthusiasts and professionals alike. This article will delve deep into the various methods and techniques to achieve this effect, providing you with a thorough understanding of the process. We’ll explore different scenarios, offer practical examples, and discuss best practices to help you master the art of turning off axes for subplots in Matplotlib.
Understanding the Importance of Turning Off Axes in Matplotlib
Before we dive into the specifics of how to turn off the axes for subplots in Matplotlib, it’s crucial to understand why this technique is valuable. In many data visualization scenarios, you may want to create clean, minimalist plots that focus solely on the data without the distraction of axes. This can be particularly useful when:
- Creating heatmaps or image plots
- Displaying multiple small plots in a grid layout
- Emphasizing the overall pattern or trend rather than specific values
- Designing infographics or artistic visualizations
By learning how to turn off the axes for subplots in Matplotlib, you’ll have greater control over the appearance of your plots and be able to create more visually appealing and effective data visualizations.
Basic Techniques for Turning Off Axes in Matplotlib
Let’s start with some basic techniques for turning off axes in Matplotlib. These methods will work for both single plots and subplots.
Using set_axis_off()
One of the simplest ways to turn off the axes for a subplot in Matplotlib is by using the set_axis_off() method. This method completely removes the axes, including the axis lines, ticks, and labels.
Here’s a simple example:
import matplotlib.pyplot as plt

fig, ax = plt.subplots()
ax.plot([1, 2, 3, 4], [1, 4, 2, 3])
ax.set_axis_off()
plt.title("How to Turn Off the Axes for Subplots in Matplotlib - how2matplotlib.com")
plt.show()
Output:
In this example, we create a simple line plot and then use ax.set_axis_off() to remove the axes completely. The resulting plot will show only the line, without any axes or ticks.
Using set_visible(False)
Another approach to turn off the axes is by using the set_visible(False) method. This method allows you to hide specific elements of the axes, giving you more control over what is displayed.
Here’s an example:
import matplotlib.pyplot as plt

fig, ax = plt.subplots()
ax.plot([1, 2, 3, 4], [1, 4, 2, 3])
ax.spines['top'].set_visible(False)
ax.spines['right'].set_visible(False)
ax.spines['bottom'].set_visible(False)
ax.spines['left'].set_visible(False)
ax.set_xticks([])
ax.set_yticks([])
plt.title("How to Turn Off the Axes for Subplots in Matplotlib - how2matplotlib.com")
plt.show()
Output:

In this example, we hide each spine (the lines that form the box around the plot) individually using set_visible(False). We also remove the ticks by setting them to empty lists. This approach gives you more flexibility in choosing which elements to hide.
Advanced Techniques for Turning Off Axes in Subplots
Now that we’ve covered the basics, let’s explore some more advanced techniques for turning off axes in subplots. These methods are particularly useful when working with multiple subplots or when you need more fine-grained control over the appearance of your plots.
Using plt.subplots_adjust()
When working with multiple subplots, you may want to adjust the spacing between them to create a more compact layout. The plt.subplots_adjust() function allows you to control the spacing around the subplots, which can be useful when turning off axes.
Here’s an example:
import matplotlib.pyplot as plt
import numpy as np

fig, axs = plt.subplots(2, 2, figsize=(8, 8))
fig.suptitle("How to Turn Off the Axes for Subplots in Matplotlib - how2matplotlib.com")

for ax in axs.flat:
    ax.plot(np.random.rand(10))
    ax.set_axis_off()

plt.subplots_adjust(wspace=0, hspace=0)
plt.show()
Output:
In this example, we create a 2×2 grid of subplots, turn off the axes for each subplot, and then use plt.subplots_adjust() to remove the spacing between the subplots. This creates a more compact and seamless appearance.
Using fig.tight_layout()
The tight_layout() function is another useful tool for adjusting the layout of your subplots. It automatically adjusts the spacing between subplots to minimize overlaps and maximize the use of the figure area.
Here’s an example:
import matplotlib.pyplot as plt
import numpy as np

fig, axs = plt.subplots(2, 2, figsize=(8, 8))
fig.suptitle("How to Turn Off the Axes for Subplots in Matplotlib - how2matplotlib.com")

for ax in axs.flat:
    ax.plot(np.random.rand(10))
    ax.set_axis_off()

fig.tight_layout()
plt.show()
Output:
In this example, we create a similar 2×2 grid of subplots, turn off the axes, and then use fig.tight_layout() to automatically adjust the spacing. This can be particularly useful when working with subplots of different sizes or when adding titles and labels.
Turning Off Axes for Specific Types of Plots
Different types of plots may require different approaches to turning off axes. Let’s explore some common plot types and how to effectively turn off their axes.
Heatmaps
Heatmaps are a great example of when you might want to turn off the axes to create a cleaner visualization. Here’s how you can do it:
import matplotlib.pyplot as plt
import numpy as np

data = np.random.rand(10, 10)
fig, ax = plt.subplots()
im = ax.imshow(data, cmap='viridis')
ax.set_axis_off()
plt.colorbar(im)
plt.title("How to Turn Off the Axes for Subplots in Matplotlib - how2matplotlib.com")
plt.show()
Output:
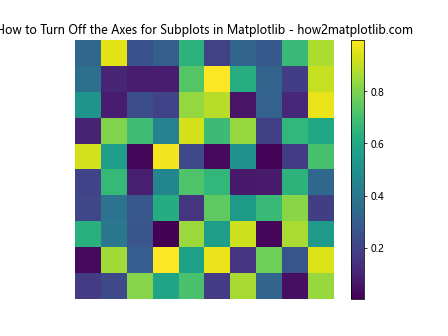
In this example, we create a heatmap using imshow(), turn off the axes, and add a colorbar. The result is a clean heatmap visualization without distracting axes.
Image Plots
When displaying images, you often want to turn off the axes to show the image without any additional elements. Here’s how:
import matplotlib.pyplot as plt
import numpy as np

image = np.random.rand(100, 100)
fig, ax = plt.subplots()
ax.imshow(image, cmap='gray')
ax.set_axis_off()
plt.title("How to Turn Off the Axes for Subplots in Matplotlib - how2matplotlib.com")
plt.show()
Output:
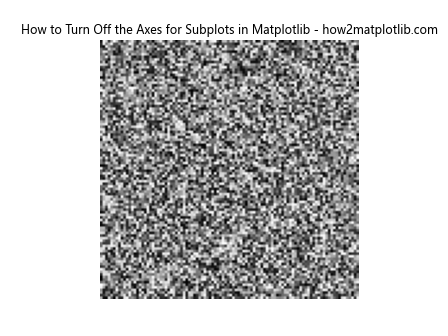
This example creates a grayscale image plot and turns off the axes, resulting in a clean image display.
Polar Plots
Polar plots can also benefit from turning off axes in certain situations. Here’s an example:
import matplotlib.pyplot as plt
import numpy as np

r = np.arange(0, 2, 0.01)
theta = 2 * np.pi * r

fig, ax = plt.subplots(subplot_kw={'projection': 'polar'})
ax.plot(theta, r)
ax.set_axis_off()
plt.title("How to Turn Off the Axes for Subplots in Matplotlib - how2matplotlib.com")
plt.show()
Output:
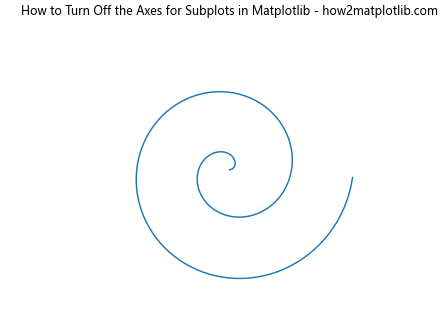
In this example, we create a polar plot and turn off the axes, resulting in a clean spiral visualization.
Customizing Axis Visibility for Subplots
Sometimes, you may want more fine-grained control over which parts of the axes to display or hide. Let’s explore some techniques for customizing axis visibility in subplots.
Selectively Hiding Spines
You can hide specific spines (the lines that form the box around the plot) while keeping others visible. This can be useful for creating plots with a minimalist aesthetic.
import matplotlib.pyplot as plt
import numpy as np

fig, ax = plt.subplots()
x = np.linspace(0, 10, 100)
y = np.sin(x)
ax.plot(x, y)

ax.spines['top'].set_visible(False)
ax.spines['right'].set_visible(False)
ax.spines['left'].set_position(('data', 0))
ax.spines['bottom'].set_position(('data', 0))

plt.title("How to Turn Off the Axes for Subplots in Matplotlib - how2matplotlib.com")
plt.show()
Output:
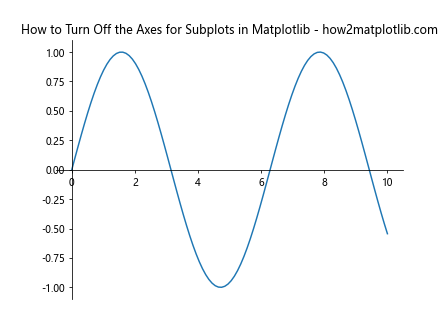
In this example, we hide the top and right spines while keeping the left and bottom spines. We also position the remaining spines at the origin (0, 0) to create a minimalist plot with axes only at the center.
Customizing Tick Visibility
You can also customize the visibility of ticks and tick labels independently of the axes themselves. This allows for more flexibility in your plot design.
import matplotlib.pyplot as plt
import numpy as np

fig, ax = plt.subplots()
x = np.linspace(0, 10, 100)
y = np.cos(x)
ax.plot(x, y)

ax.set_xticks([])
ax.set_yticks([])
ax.spines['top'].set_visible(False)
ax.spines['right'].set_visible(False)

plt.title("How to Turn Off the Axes for Subplots in Matplotlib - how2matplotlib.com")
plt.show()
Output:
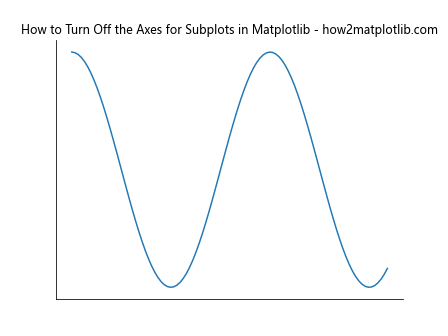
In this example, we remove the ticks using set_xticks([]) and set_yticks([]), while keeping the bottom and left spines visible. This creates a plot with axis lines but no tick marks or labels.
Turning Off Axes for Multiple Subplots
When working with multiple subplots, you may want to turn off axes for some subplots while keeping them for others. Let’s explore some techniques for handling this scenario.
Using a Loop to Turn Off Axes
You can use a loop to iterate through your subplots and selectively turn off axes based on certain conditions.
import matplotlib.pyplot as plt
import numpy as np

fig, axs = plt.subplots(2, 2, figsize=(10, 10))
fig.suptitle("How to Turn Off the Axes for Subplots in Matplotlib - how2matplotlib.com")

for i, ax in enumerate(axs.flat):
    x = np.linspace(0, 10, 100)
    y = np.sin(x + i)
    ax.plot(x, y)

    if i % 2 == 0:  # Turn off axes for even-numbered subplots
        ax.set_axis_off()
    else:
        ax.set_title(f"Subplot {i+1}")

plt.tight_layout()
plt.show()
Output:
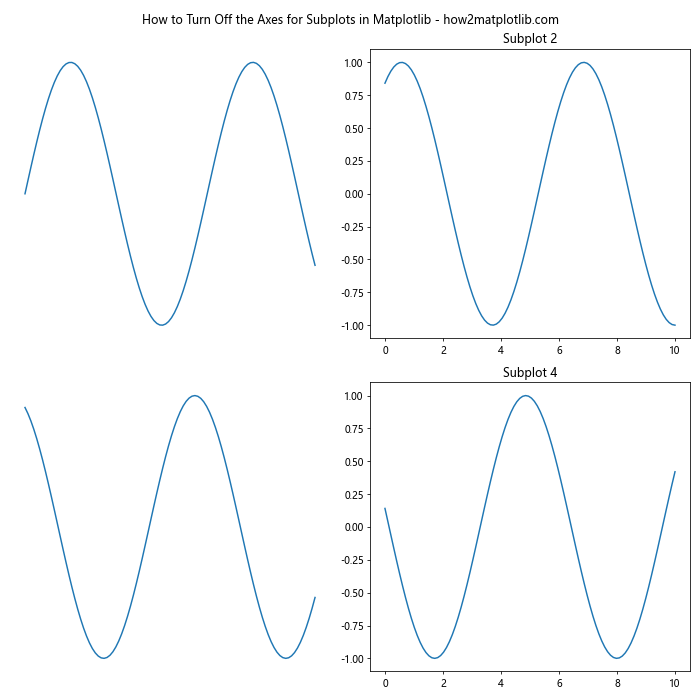
In this example, we create a 2×2 grid of subplots and use a loop to plot different sine waves in each subplot. We then use a condition to turn off the axes for even-numbered subplots while keeping them for odd-numbered subplots.
Using GridSpec for Complex Layouts
For more complex layouts where you want fine-grained control over subplot sizes and axis visibility, you can use GridSpec.
import matplotlib.pyplot as plt
import matplotlib.gridspec as gridspec
import numpy as np

fig = plt.figure(figsize=(12, 8))
gs = gridspec.GridSpec(3, 3)

ax1 = fig.add_subplot(gs[0, :])
ax2 = fig.add_subplot(gs[1, :-1])
ax3 = fig.add_subplot(gs[1:, -1])
ax4 = fig.add_subplot(gs[-1, 0])
ax5 = fig.add_subplot(gs[-1, -2])

axes = [ax1, ax2, ax3, ax4, ax5]

for i, ax in enumerate(axes):
    x = np.linspace(0, 10, 100)
    y = np.sin(x + i)
    ax.plot(x, y)

    if i in [1, 3]:  # Turn off axes for specific subplots
        ax.set_axis_off()
    else:
        ax.set_title(f"Subplot {i+1}")

fig.suptitle("How to Turn Off the Axes for Subplots in Matplotlib - how2matplotlib.com")
plt.tight_layout()
plt.show()
Output:
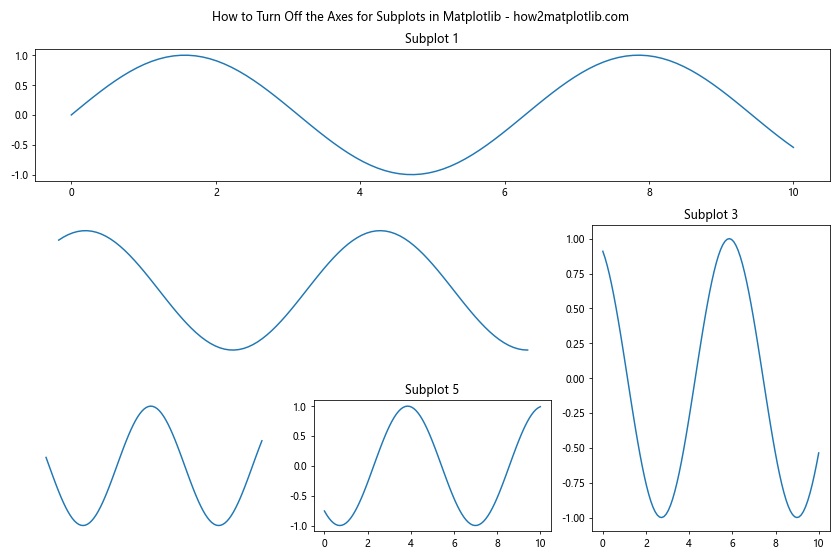
In this example, we use GridSpec to create a complex layout with subplots of different sizes. We then selectively turn off axes for specific subplots while keeping them for others.
Best Practices for Turning Off Axes in Matplotlib
As you become more proficient in turning off axes for subplots in Matplotlib, it’s important to keep some best practices in mind to ensure your visualizations are effective and professional.
Consistency Across Subplots
When working with multiple subplots, it’s important to maintain consistency in how you handle axes visibility. If you’re turning off axes for some subplots, consider whether it makes sense to do so for all of them or if there’s a logical pattern to follow.
import matplotlib.pyplot as plt
import numpy as np

fig, axs = plt.subplots(2, 2, figsize=(10, 10))
fig.suptitle("How to Turn Off the Axes for Subplots in Matplotlib - how2matplotlib.com")

for ax in axs.flat:
    x = np.linspace(0, 10, 100)
    y = np.random.rand(100)
    ax.plot(x, y)
    ax.set_axis_off()

plt.tight_layout()
plt.show()
Output:
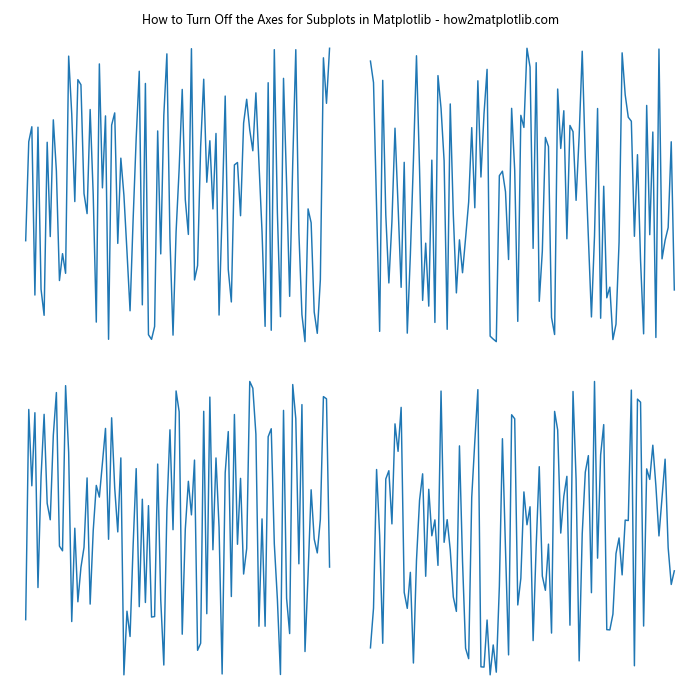
In this example, we maintain consistency by turning off the axes for all subplots in a 2×2 grid.
Providing Context Without Axes
When you turn off axes, it’s important to consider how you’ll provide context for your data. This might involve adding annotations, text labels, or other visual cues to help viewers understand the information being presented.
import matplotlib.pyplot as plt
import numpy as np

fig, ax = plt.subplots(figsize=(8, 6))
x = np.linspace(0, 10, 100)
y = np.sin(x)
ax.plot(x, y)
ax.set_axis_off()

ax.text(5, 0, "Sine Wave", ha='center', va='center', fontsize=16)
ax.annotate("Peak", xy=(np.pi/2, 1), xytext=(np.pi/2, 1.2),
            arrowprops=dict(arrowstyle="->"))
ax.annotate("Trough", xy=(3*np.pi/2, -1), xytext=(3*np.pi/2, -1.2),
            arrowprops=dict(arrowstyle="->"))

plt.title("How to Turn Off the Axes for Subplots in Matplotlib - how2matplotlib.com")
plt.show()
Output:
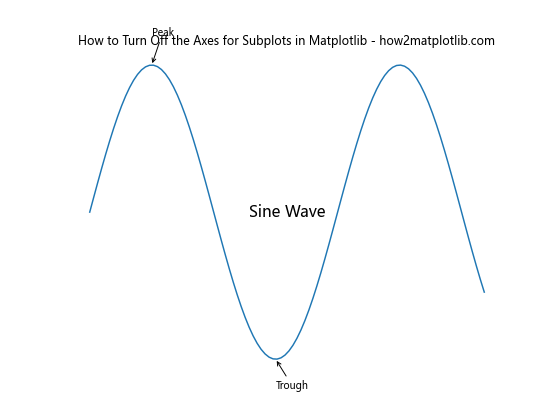
In this example, we turn off the axes but add text labels and annotations to provide context for the sine wave plot.
Balancing Aesthetics and Information
While turning off axes can create cleaner, more visually appealing plots, it’s important to balance aesthetics with the need to convey information. Consider whether removing axes might make it harder for viewers to understand your data.
import matplotlib.pyplot as plt
import numpy as np

fig, (ax1, ax2) = plt.subplots(1, 2, figsize=(12, 5))
fig.suptitle("How to Turn Off the Axes for Subplots in Matplotlib - how2matplotlib.com")

x = np.linspace(0, 10, 100)
y1 = np.sin(x)
y2 = np.cos(x)

ax1.plot(x, y1, label='Sine')
ax1.plot(x, y2, label='Cosine')
ax1.legend()
ax1.set_title("With Axes")

ax2.plot(x, y1, label='Sine')
ax2.plot(x, y2, label='Cosine')
ax2.legend()
ax2.set_axis_off()
ax2.set_title("Without Axes")

plt.tight_layout()
plt.show()
Output:
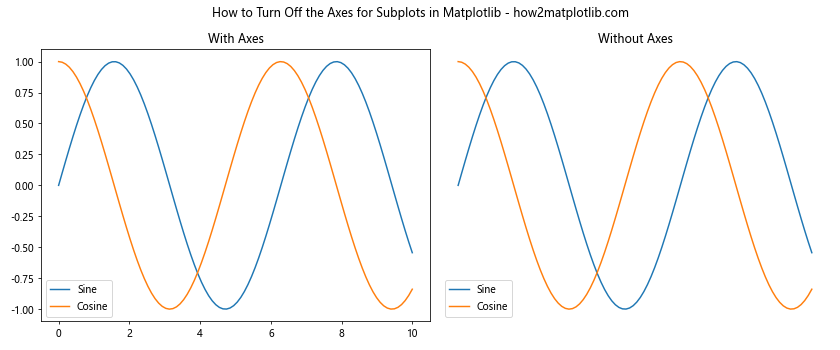
In this example, we create two subplots side by side, one with axes and one without, to demonstrate how turning off axes affects the readability of the plot.
Advanced Techniques for Axis Manipulation in Matplotlib
As you become more comfortable with turning off axes for subplots in Matplotlib, you may want to explore more advanced techniques for manipulating axes. These techniques can help you create even more customized and visually appealing plots.
Using Axis Artists
Axis artists provide a more flexible way to customize individual axis elements. While they’re more complex to use than standard axes, they offer greater control over the appearance of your plots.
import matplotlib.pyplot as plt
from mpl_toolkits.axisartist.axislines import SubplotZero
import numpy as np

fig = plt.figure(figsize=(8, 6))
ax = SubplotZero(fig, 111)
fig.add_subplot(ax)

ax.axis["xzero"].set_visible(True)
ax.axis["xzero"].label.set_text("X axis")
ax.axis["yzero"].set_visible(True)
ax.axis["yzero"].label.set_text("Y axis")

ax.axis["top"].set_visible(False)
ax.axis["right"].set_visible(False)

x = np.linspace(-5, 5, 100)
y = x**2
ax.plot(x, y)

plt.title("How to Turn Off the Axes for Subplots in Matplotlib - how2matplotlib.com")
plt.show()
Output:
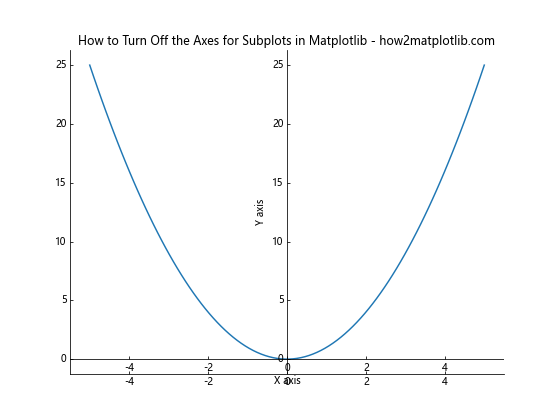
In this example, we use axis artists to create a plot with only the x and y axes visible, positioned at zero. This creates a minimalist plot with axes only where they intersect.
Creating Inset Axes
Inset axes allow you to create smaller plots within your main plot. This can be useful for showing detailed views or related information without cluttering your main plot.
import matplotlib.pyplot as plt
from mpl_toolkits.axes_grid1.inset_locator import inset_axes
import numpy as np

fig, ax = plt.subplots(figsize=(8, 6))

x = np.linspace(0, 10, 100)
y = np.sin(x)
ax.plot(x, y)

axins = inset_axes(ax, width="40%", height="30%", loc=1)
axins.plot(x, y)
axins.set_xlim(2, 4)
axins.set_ylim(0.5, 1)
axins.set_axis_off()

ax.indicate_inset_zoom(axins)

plt.title("How to Turn Off the Axes for Subplots in Matplotlib - how2matplotlib.com")
plt.show()
Output:
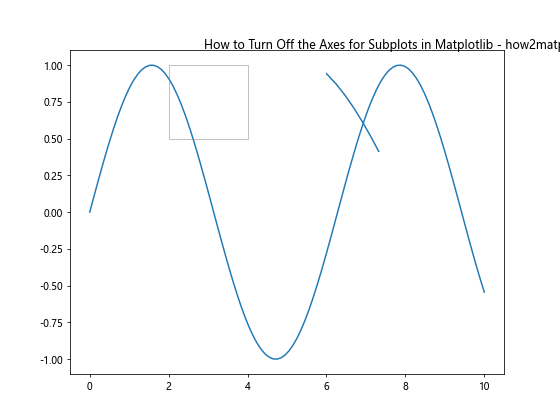
In this example, we create a main plot with a sine wave and an inset plot showing a zoomed-in view of a specific region. We turn off the axes for the inset plot to create a clean, focused view.
Handling Special Cases When Turning Off Axes
There are some special cases where turning off axes requires additional consideration or techniques. Let’s explore a few of these scenarios.
3D Plots
When working with 3D plots, turning off axes can be a bit more complex. Here’s an example of how to handle this:
import matplotlib.pyplot as plt
from mpl_toolkits.mplot3d import Axes3D
import numpy as np

fig = plt.figure(figsize=(8, 6))
ax = fig.add_subplot(111, projection='3d')

x = np.linspace(-5, 5, 100)
y = np.linspace(-5, 5, 100)
X, Y = np.meshgrid(x, y)
Z = np.sin(np.sqrt(X**2 + Y**2))

surf = ax.plot_surface(X, Y, Z, cmap='viridis')

ax.set_axis_off()

plt.title("How to Turn Off the Axes for Subplots in Matplotlib - how2matplotlib.com")
plt.show()
Output:
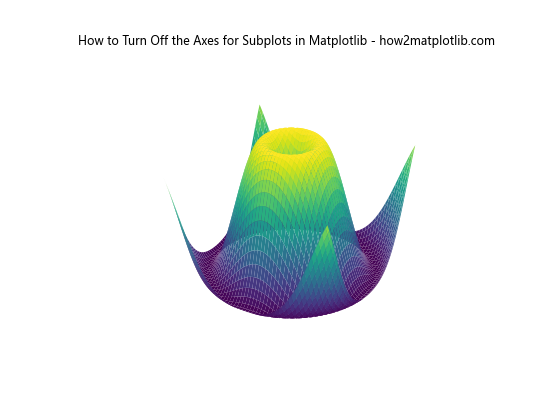
In this example, we create a 3D surface plot and turn off the axes using set_axis_off(). This removes all axis lines, ticks, and labels, creating a clean 3D visualization.
Plots with Colorbars
When working with plots that include colorbars, you may want to turn off the axes for the main plot while keeping the colorbar visible. Here’s how you can achieve this:
import matplotlib.pyplot as plt
import numpy as np

fig, ax = plt.subplots(figsize=(8, 6))

data = np.random.rand(20, 20)
im = ax.imshow(data, cmap='viridis')
ax.set_axis_off()

cbar = plt.colorbar(im)
cbar.set_label('Value')

plt.title("How to Turn Off the Axes for Subplots in Matplotlib - how2matplotlib.com")
plt.show()
Output:
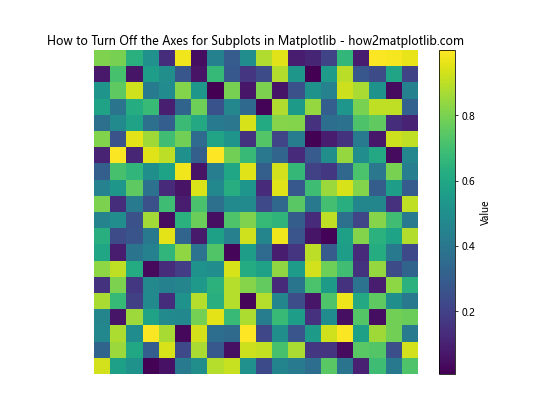
In this example, we create a heatmap using imshow(), turn off the axes for the main plot, and add a colorbar. The colorbar remains visible and provides context for the color scale used in the heatmap.
Troubleshooting Common Issues
When turning off axes for subplots in Matplotlib, you may encounter some common issues. Let’s address a few of these and provide solutions.
Unexpected Whitespace
Sometimes, turning off axes can lead to unexpected whitespace around your plots. This can often be resolved by adjusting the figure size or using tight_layout().
import matplotlib.pyplot as plt
import numpy as np

fig, axs = plt.subplots(2, 2, figsize=(8, 8))
fig.suptitle("How to Turn Off the Axes for Subplots in Matplotlib - how2matplotlib.com")

for ax in axs.flat:
    ax.plot(np.random.rand(10))
    ax.set_axis_off()

plt.tight_layout()
plt.show()
Output:
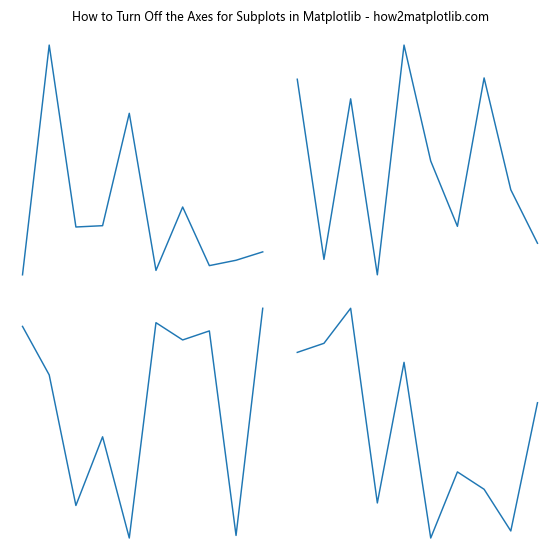
In this example, we use tight_layout() to automatically adjust the spacing between subplots and reduce unwanted whitespace.
Overlapping Elements
When turning off axes, you may find that plot elements overlap in unexpected ways. This can often be resolved by manually adjusting the plot limits or using plt.subplots_adjust().
import matplotlib.pyplot as plt
import numpy as np

fig, axs = plt.subplots(2, 2, figsize=(8, 8))
fig.suptitle("How to Turn Off the Axes for Subplots in Matplotlib - how2matplotlib.com")

for ax in axs.flat:
    ax.plot(np.random.rand(10))
    ax.set_axis_off()

plt.subplots_adjust(wspace=0, hspace=0)
plt.show()
Output:
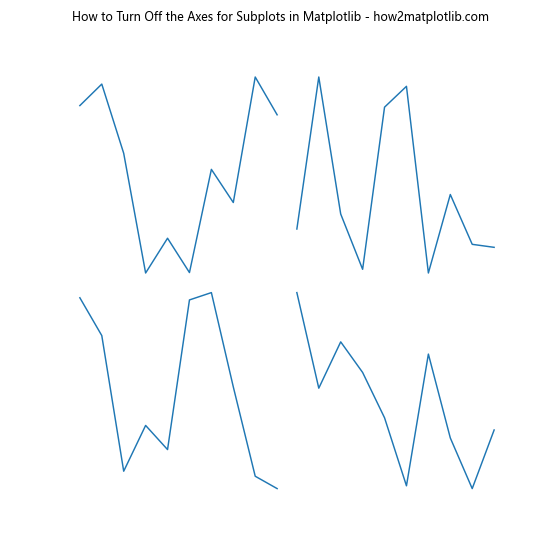
In this example, we use plt.subplots_adjust() to remove the space between subplots, preventing overlap and creating a more compact layout.
Conclusion
Mastering how to turn off the axes for subplots in Matplotlib is a valuable skill that can significantly enhance your data visualizations. By removing unnecessary axes, you can create cleaner, more focused plots that effectively communicate your data.
Throughout this article, we’ve explored various techniques for turning off axes, from basic methods like set_axis_off() to more advanced approaches using axis artists and inset axes. We’ve also covered best practices, special cases, and troubleshooting tips to help you handle a wide range of visualization scenarios.