How to Remove the Duplicate Legend When Overlaying Boxplot and Stripplot in Matplotlib
How to Remove the Duplicate Legend When Overlaying Boxplot and Stripplot is a common challenge faced by data visualization enthusiasts using Matplotlib. This article will provide a detailed exploration of this topic, offering various solutions and techniques to effectively remove duplicate legends when combining boxplots and stripplots. We’ll cover everything from the basics of creating these plots to advanced methods for legend manipulation, ensuring you have a thorough understanding of how to remove duplicate legends in your Matplotlib visualizations.
Understanding Boxplots and Stripplots
Before diving into the specifics of removing duplicate legends, it’s essential to understand what boxplots and stripplots are and how they are typically used in data visualization.
Boxplots
Boxplots, also known as box-and-whisker plots, are a standardized way of displaying the distribution of data based on a five-number summary: minimum, first quartile, median, third quartile, and maximum. They are particularly useful for comparing distributions between several groups or datasets.
Here’s a simple example of creating a boxplot using Matplotlib:
import matplotlib.pyplot as plt
import numpy as np

# Generate sample data
data = np.random.randn(100, 3)

# Create boxplot
fig, ax = plt.subplots()
bp = ax.boxplot(data)

plt.title('How to Remove the Duplicate Legend - Boxplot Example')
plt.xlabel('Groups')
plt.ylabel('Values')
plt.text(0.5, 0.95, 'how2matplotlib.com', transform=ax.transAxes, ha='center')

plt.show()
Output:
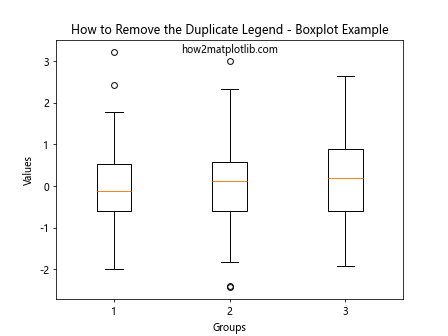
In this example, we create a simple boxplot using random data. The boxplot function from Matplotlib is used to generate the plot, which displays the distribution of three groups of data.
Stripplots
Stripplots, on the other hand, show the individual data points as markers on a one-dimensional scatter plot. They are useful for visualizing the distribution of small datasets and can be particularly effective when combined with other plot types like boxplots.
Here’s an example of creating a stripplot using Matplotlib:
import matplotlib.pyplot as plt
import numpy as np
import seaborn as sns

# Generate sample data
data = np.random.randn(30, 3)

# Create stripplot
fig, ax = plt.subplots()
sns.stripplot(data=data, ax=ax)

plt.title('How to Remove the Duplicate Legend - Stripplot Example')
plt.xlabel('Groups')
plt.ylabel('Values')
plt.text(0.5, 0.95, 'how2matplotlib.com', transform=ax.transAxes, ha='center')

plt.show()
Output:
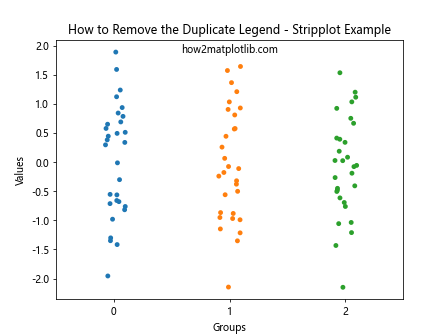
In this example, we use Seaborn’s stripplot function, which is built on top of Matplotlib, to create a stripplot of our sample data. Each point represents an individual data point, allowing us to see the distribution of values within each group.
Overlaying Boxplot and Stripplot
Now that we understand boxplots and stripplots individually, let’s explore how to overlay them to create a more informative visualization. Combining these two plot types can provide a comprehensive view of the data, showing both the overall distribution and individual data points.
Here’s an example of how to overlay a boxplot and stripplot:
import matplotlib.pyplot as plt
import numpy as np
import seaborn as sns

# Generate sample data
data = np.random.randn(30, 3)

# Create figure and axis
fig, ax = plt.subplots()

# Create boxplot
bp = ax.boxplot(data)

# Create stripplot
sns.stripplot(data=data, ax=ax, color='red', alpha=0.5)

plt.title('How to Remove the Duplicate Legend - Overlaid Boxplot and Stripplot')
plt.xlabel('Groups')
plt.ylabel('Values')
plt.text(0.5, 0.95, 'how2matplotlib.com', transform=ax.transAxes, ha='center')

plt.show()
Output:
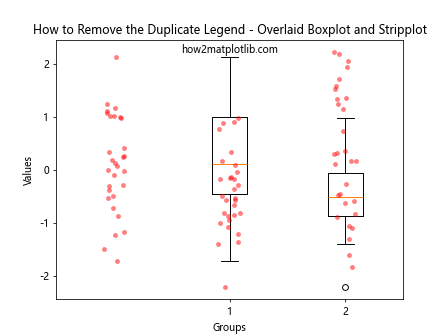
In this example, we first create a boxplot using Matplotlib’s boxplot function, and then overlay a stripplot using Seaborn’s stripplot function. The stripplot points are colored red with some transparency (alpha=0.5) to distinguish them from the boxplot.
The Problem of Duplicate Legends
When overlaying boxplots and stripplots, you may encounter the issue of duplicate legends. This occurs because both the boxplot and stripplot functions can generate their own legends, leading to redundant information in the plot.
Here’s an example that demonstrates this problem:
import matplotlib.pyplot as plt
import numpy as np
import seaborn as sns

# Generate sample data
data = np.random.randn(30, 3)

# Create figure and axis
fig, ax = plt.subplots()

# Create boxplot with legend
bp = ax.boxplot(data, patch_artist=True, labels=['Group 1', 'Group 2', 'Group 3'])
for patch in bp['boxes']:
    patch.set_facecolor('lightblue')

# Create stripplot with legend
sns.stripplot(data=data, ax=ax, color='red', alpha=0.5, label='Data Points')

plt.title('How to Remove the Duplicate Legend - Problem Demonstration')
plt.xlabel('Groups')
plt.ylabel('Values')
plt.legend()
plt.text(0.5, 0.95, 'how2matplotlib.com', transform=ax.transAxes, ha='center')

plt.show()
Output:
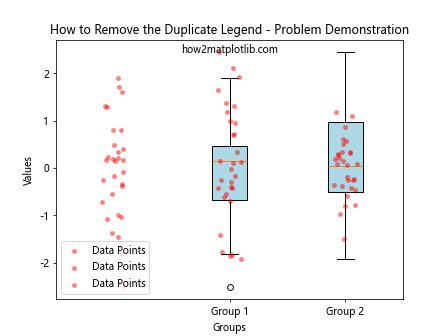
In this example, both the boxplot and stripplot have their own legend entries, resulting in a duplicate legend that can be confusing and cluttered.
Solutions to Remove Duplicate Legends
Now that we’ve identified the problem, let’s explore various solutions to remove duplicate legends when overlaying boxplots and stripplots.
Solution 1: Using a Single Legend for Both Plots
One straightforward approach is to create a single legend that represents both the boxplot and stripplot. This can be achieved by manually creating legend handles and labels.
import matplotlib.pyplot as plt
import numpy as np
import seaborn as sns

# Generate sample data
data = np.random.randn(30, 3)

# Create figure and axis
fig, ax = plt.subplots()

# Create boxplot without legend
bp = ax.boxplot(data, patch_artist=True)
for patch in bp['boxes']:
    patch.set_facecolor('lightblue')

# Create stripplot without legend
sns.stripplot(data=data, ax=ax, color='red', alpha=0.5)

# Create custom legend
legend_elements = [plt.Rectangle((0,0),1,1,fc='lightblue', edgecolor='black', label='Boxplot'),
                   plt.Line2D([0], [0], marker='o', color='w', markerfacecolor='red', markersize=10, alpha=0.5, label='Data Points')]

plt.legend(handles=legend_elements)

plt.title('How to Remove the Duplicate Legend - Single Legend Solution')
plt.xlabel('Groups')
plt.ylabel('Values')
plt.text(0.5, 0.95, 'how2matplotlib.com', transform=ax.transAxes, ha='center')

plt.show()
Output:
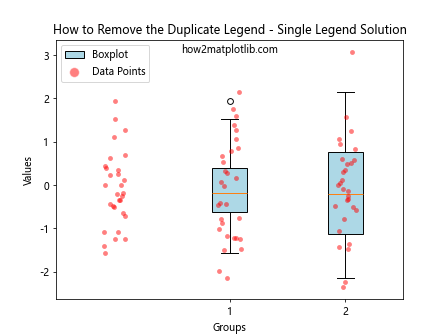
In this solution, we create the boxplot and stripplot without their individual legends. Then, we manually create legend elements using Rectangle for the boxplot and Line2D for the stripplot data points. Finally, we add a single legend using these custom elements.
Solution 2: Removing Duplicate Legend Entries
Another approach is to create both plots with their legends and then remove the duplicate entries programmatically.
import matplotlib.pyplot as plt
import numpy as np
import seaborn as sns

# Generate sample data
data = np.random.randn(30, 3)

# Create figure and axis
fig, ax = plt.subplots()

# Create boxplot with legend
bp = ax.boxplot(data, patch_artist=True, labels=['Group 1', 'Group 2', 'Group 3'])
for patch in bp['boxes']:
    patch.set_facecolor('lightblue')

# Create stripplot with legend
sns.stripplot(data=data, ax=ax, color='red', alpha=0.5, label='Data Points')

# Get legend handles and labels
handles, labels = plt.gca().get_legend_handles_labels()

# Remove duplicate labels
unique = [(h, l) for i, (h, l) in enumerate(zip(handles, labels)) if l not in labels[:i]]
handles, labels = zip(*unique)

plt.legend(handles, labels)

plt.title('How to Remove the Duplicate Legend - Removing Duplicates')
plt.xlabel('Groups')
plt.ylabel('Values')
plt.text(0.5, 0.95, 'how2matplotlib.com', transform=ax.transAxes, ha='center')

plt.show()
Output:
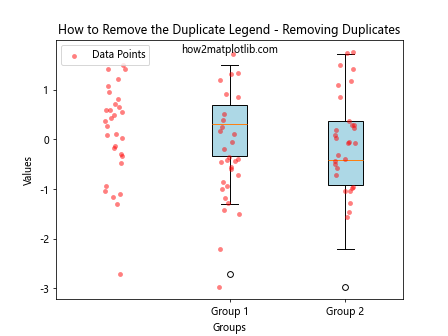
In this solution, we create both plots with their legends, then use a list comprehension to remove duplicate labels. We then create a new legend with the unique handles and labels.
Solution 3: Using Seaborn’s boxplot and stripplot Functions
Seaborn provides a convenient way to create both boxplots and stripplots with better control over the legend. Here’s how you can use Seaborn to avoid duplicate legends:
import matplotlib.pyplot as plt
import numpy as np
import seaborn as sns
import pandas as pd

# Generate sample data
data = pd.DataFrame(np.random.randn(90, 1), columns=['value'])
data['group'] = np.repeat(['A', 'B', 'C'], 30)

# Create figure and axis
fig, ax = plt.subplots()

# Create boxplot and stripplot using Seaborn
sns.boxplot(x='group', y='value', data=data, ax=ax)
sns.stripplot(x='group', y='value', data=data, ax=ax, color='red', alpha=0.5)

plt.title('How to Remove the Duplicate Legend - Seaborn Solution')
plt.xlabel('Groups')
plt.ylabel('Values')
plt.text(0.5, 0.95, 'how2matplotlib.com', transform=ax.transAxes, ha='center')

plt.show()
Output:
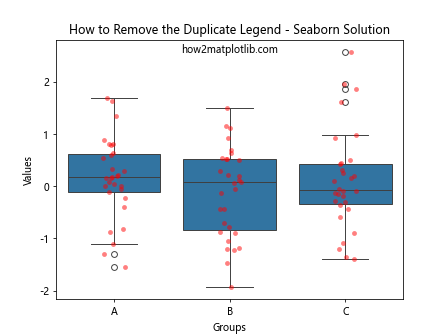
In this solution, we use Seaborn’s boxplot and stripplot functions, which automatically handle the legend without creating duplicates.
Advanced Techniques for Legend Manipulation
While the previous solutions work well for simple cases, you might encounter more complex scenarios that require advanced legend manipulation. Let’s explore some advanced techniques for handling legends when overlaying boxplots and stripplots.
Technique 1: Using plt.gca().add_artist()
This technique allows you to add the legend as an artist to the plot, giving you more control over its placement and appearance.
import matplotlib.pyplot as plt
import numpy as np
import seaborn as sns

# Generate sample data
data = np.random.randn(30, 3)

# Create figure and axis
fig, ax = plt.subplots()

# Create boxplot
bp = ax.boxplot(data, patch_artist=True)
for patch in bp['boxes']:
    patch.set_facecolor('lightblue')

# Create stripplot
sns.stripplot(data=data, ax=ax, color='red', alpha=0.5)

# Create custom legend
legend1 = plt.legend(['Boxplot'], loc='upper left')
plt.gca().add_artist(legend1)
plt.legend(['Data Points'], loc='upper right')

plt.title('How to Remove the Duplicate Legend - Using add_artist()')
plt.xlabel('Groups')
plt.ylabel('Values')
plt.text(0.5, 0.95, 'how2matplotlib.com', transform=ax.transAxes, ha='center')

plt.show()
Output:
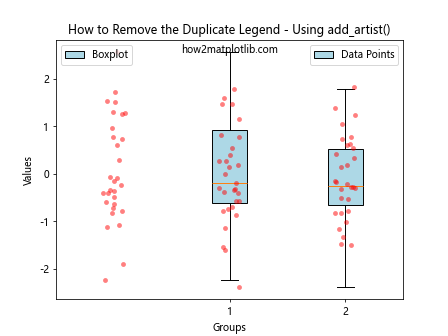
In this example, we create two separate legends and add one of them as an artist to the plot. This allows us to have two non-overlapping legends without duplicates.
Technique 2: Using ax.get_legend_handles_labels()
This technique gives you fine-grained control over which legend entries to include and how to order them.
import matplotlib.pyplot as plt
import numpy as np
import seaborn as sns

# Generate sample data
data = np.random.randn(30, 3)

# Create figure and axis
fig, ax = plt.subplots()

# Create boxplot
bp = ax.boxplot(data, patch_artist=True)
for patch in bp['boxes']:
    patch.set_facecolor('lightblue')

# Create stripplot
sns.stripplot(data=data, ax=ax, color='red', alpha=0.5)

# Get handles and labels
handles, labels = ax.get_legend_handles_labels()

# Add custom handles
handles.append(plt.Rectangle((0,0),1,1,fc='lightblue', edgecolor='black'))
labels.append('Boxplot')

# Create legend with custom handles and labels
ax.legend(handles, labels)

plt.title('How to Remove the Duplicate Legend - Using get_legend_handles_labels()')
plt.xlabel('Groups')
plt.ylabel('Values')
plt.text(0.5, 0.95, 'how2matplotlib.com', transform=ax.transAxes, ha='center')

plt.show()
Output:
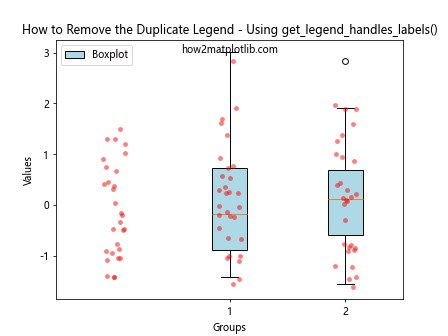
In this example, we use ax.get_legend_handles_labels() to get the existing handles and labels, then manually add a custom handle for the boxplot. This gives us complete control over the legend entries.
Handling Multiple Groups and Categories
When dealing with more complex datasets that involve multiple groups or categories, removing duplicate legends can become more challenging. Let’s explore some techniques to handle these scenarios.
Technique 1: Using a DataFrame and Seaborn
When working with multiple groups or categories, using a pandas DataFrame in combination with Seaborn can simplify the process of creating plots without duplicate legends.
import matplotlib.pyplot as plt
import numpy as np
import seaborn as sns
import pandas as pd

# Generate sample data
np.random.seed(0)
data = pd.DataFrame({
    'group': np.repeat(['A', 'B', 'C'], 40),
    'subgroup': np.tile(np.repeat(['X', 'Y'], 20), 3),
    'value': np.random.randn(120)
})

# Create figure and axis
fig, ax = plt.subplots(figsize=(10, 6))

# Create boxplot and stripplot using Seaborn
sns.boxplot(x='group', y='value', hue='subgroup', data=data, ax=ax)
sns.stripplot(x='group', y='value', hue='subgroup', data=data, ax=ax, dodge=True, alpha=0.5)

# Remove the legend title
ax.get_legend().set_title(None)

plt.title('How to Remove the Duplicate Legend - Multiple Groups')
plt.xlabel('Groups')
plt.ylabel('Values')
plt.text(0.5, 0.95, 'how2matplotlib.com', transform=ax.transAxes, ha='center')

plt.show()
Output:
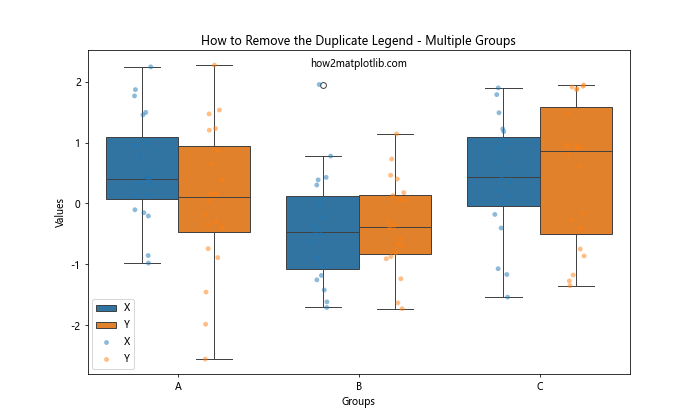
In this example, we use a DataFrame to store our data with multiple groups and subgroups. Seaborn’s boxplot and stripplot functions handle the legend automatically, avoiding duplicates.
Technique 2: Manual Legend Creation for Complex Plots
For more complex plots where automatic legend creation doesn’t suffice, you can manually create a legend that accurately represents all elements of your plot.
import matplotlib.pyplot as plt
import numpy as np
import seaborn as sns

# Generate sample data
np.random.seed(0)
data1 = np.random.randn(30, 3)
data2 = np.random.randn(30, 3) + 1

# Create figure and axis
fig, ax = plt.subplots(figsize=(10, 6))

# Create boxplots
bp1 = ax.boxplot(data1, positions=[1, 2, 3], patch_artist=True, widths=0.5)
bp2 = ax.boxplot(data2, positions=[1.5, 2.5, 3.5], patch_artist=True, widths=0.5)

for patch in bp1['boxes']:
    patch.set_facecolor('lightblue')
for patch in bp2['boxes']:
    patch.set_facecolor('lightgreen')

# Create stripplots
sns.stripplot(data=data1, ax=ax, color='red', alpha=0.5, jitter=True, dodge=True)
sns.stripplot(data=data2, ax=ax, color='blue', alpha=0.5, jitter=True, dodge=True)

# Create custom legend
legend_elements = [
    plt.Rectangle((0,0),1,1,fc='lightblue', edgecolor='black', label='Group A'),
    plt.Rectangle((0,0),1,1,fc='lightgreen', edgecolor='black', label='Group B'),
    plt.Line2D([0], [0], marker='o', color='w', markerfacecolor='red', markersize=10, alpha=0.5, label='Data Points A'),
    plt.Line2D([0], [0], marker='o', color='w', markerfacecolor='blue', markersize=10, alpha=0.5, label='Data Points B')
]

ax.legend(handles=legend_elements, loc='upper right')

plt.title('How to Remove the Duplicate Legend - Complex Plot')
plt.xlabel('Subgroups')
plt.ylabel('Values')
plt.text(0.5, 0.95, 'how2matplotlib.com', transform=ax.transAxes, ha='center')

plt.show()
Output:
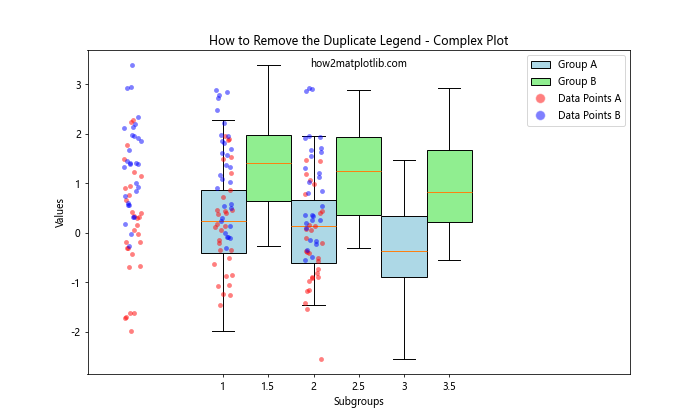
In this example, we manually create two sets of boxplots and stripplots, then create a custom legend that accurately represents all elements of the plot without duplicates.
Best Practices for Legend Placement
When removing duplicate legends and creating custom legends, it’s important to consider the placement of the legend to ensure it doesn’t obscure important data or interfere with the readability of the plot. Here are some best practices for legend placement:
- Use the
locparameter: Matplotlib provides several predefined locations for legend placement, such as ‘upper right’, ‘lower left’, etc. You can specify these using thelocparameter in thelegend()function. Use the
bbox_to_anchorparameter: For more precise control over legend placement, you can use thebbox_to_anchorparameter to specify the exact coordinates of the legend.Place the legend outside the plot area: If your plot is crowded, consider placing the legend outside the plot area to avoid obscuring data.
Here’s an example demonstrating these practices: