How to Create a Swarm Plot with Matplotlib
How to Create a Swarm Plot with Matplotlib is an essential skill for data visualization enthusiasts and professionals alike. Swarm plots are an excellent way to display the distribution of data points, especially when dealing with categorical variables. In this comprehensive guide, we’ll explore the ins and outs of creating swarm plots using Matplotlib, one of the most popular plotting libraries in Python.
Understanding Swarm Plots and Their Importance
Before diving into the technical aspects of how to create a swarm plot with Matplotlib, it’s crucial to understand what swarm plots are and why they’re valuable in data visualization. A swarm plot is a type of one-dimensional scatter plot that displays the distribution of data points for categorical variables. Unlike traditional box plots or violin plots, swarm plots show individual data points, making them ideal for smaller datasets or when you want to highlight the density of data points in specific regions.
Swarm plots are particularly useful when you want to:
- Visualize the distribution of data points across categories
- Identify outliers or unusual patterns in your data
- Compare multiple groups or categories side by side
- Show the raw data alongside summary statistics
Now that we understand the importance of swarm plots, let’s explore how to create them using Matplotlib.
Creating Your First Swarm Plot with Matplotlib
Now that we have our environment set up, let’s dive deeper into creating swarm plots with Matplotlib. While Seaborn provides a convenient wrapper for creating swarm plots, we can achieve similar results using Matplotlib directly. Here’s an example of how to create a swarm plot using Matplotlib:
import matplotlib.pyplot as plt
import numpy as np

# Create sample data
np.random.seed(42)
categories = ['A', 'B', 'C', 'D']
data = [np.random.normal(0, std, 100) for std in range(1, 5)]

# Create the swarm plot
fig, ax = plt.subplots(figsize=(10, 6))

for i, d in enumerate(data):
    y = d
    x = np.random.normal(i, 0.04, len(y))
    ax.plot(x, y, 'o', alpha=0.5, markersize=6)

ax.set_xticks(range(len(categories)))
ax.set_xticklabels(categories)
ax.set_xlabel('Categories')
ax.set_ylabel('Values')
ax.set_title('How to Create a Swarm Plot with Matplotlib - how2matplotlib.com')

plt.tight_layout()
plt.show()
Output:
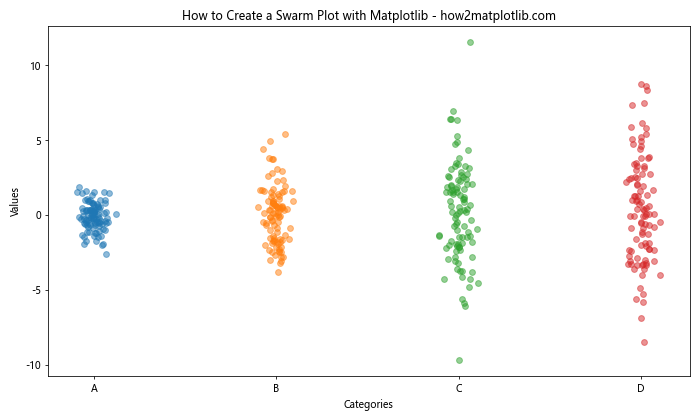
In this example, we create a swarm plot using Matplotlib’s plot function with scatter markers. We add some random jitter to the x-coordinates to create the swarm effect. This approach gives you more control over the appearance of your swarm plot.
Customizing Your Swarm Plot with Matplotlib
One of the advantages of using Matplotlib to create swarm plots is the level of customization it offers. Let’s explore some ways to customize your swarm plot:
Changing Colors and Markers
import matplotlib.pyplot as plt
import numpy as np

np.random.seed(42)
categories = ['A', 'B', 'C', 'D']
data = [np.random.normal(0, std, 100) for std in range(1, 5)]

fig, ax = plt.subplots(figsize=(10, 6))

colors = ['#1f77b4', '#ff7f0e', '#2ca02c', '#d62728']
markers = ['o', 's', '^', 'D']

for i, (d, color, marker) in enumerate(zip(data, colors, markers)):
    y = d
    x = np.random.normal(i, 0.04, len(y))
    ax.plot(x, y, marker, color=color, alpha=0.7, markersize=8)

ax.set_xticks(range(len(categories)))
ax.set_xticklabels(categories)
ax.set_xlabel('Categories')
ax.set_ylabel('Values')
ax.set_title('How to Create a Swarm Plot with Matplotlib - Custom Colors and Markers\nhow2matplotlib.com')

plt.tight_layout()
plt.show()
Output:
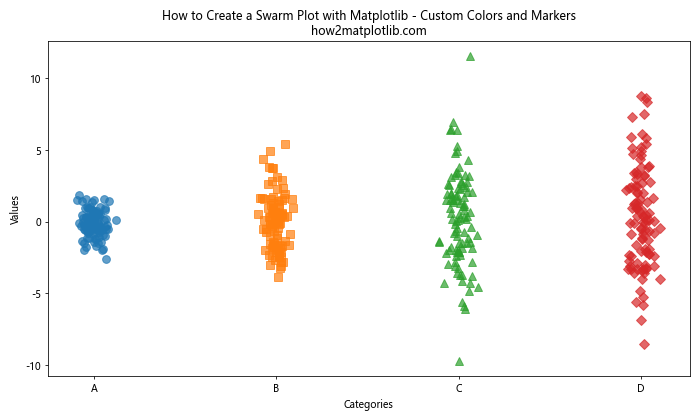
In this example, we customize the colors and markers for each category in our swarm plot. This can help distinguish between different groups more easily.
Adding a Color Gradient
import matplotlib.pyplot as plt
import numpy as np

np.random.seed(42)
categories = ['A', 'B', 'C', 'D']
data = [np.random.normal(0, std, 100) for std in range(1, 5)]

fig, ax = plt.subplots(figsize=(10, 6))

for i, d in enumerate(data):
    y = d
    x = np.random.normal(i, 0.04, len(y))
    scatter = ax.scatter(x, y, c=y, cmap='viridis', alpha=0.7, s=50)

ax.set_xticks(range(len(categories)))
ax.set_xticklabels(categories)
ax.set_xlabel('Categories')
ax.set_ylabel('Values')
ax.set_title('How to Create a Swarm Plot with Matplotlib - Color Gradient\nhow2matplotlib.com')

plt.colorbar(scatter)
plt.tight_layout()
plt.show()
Output:
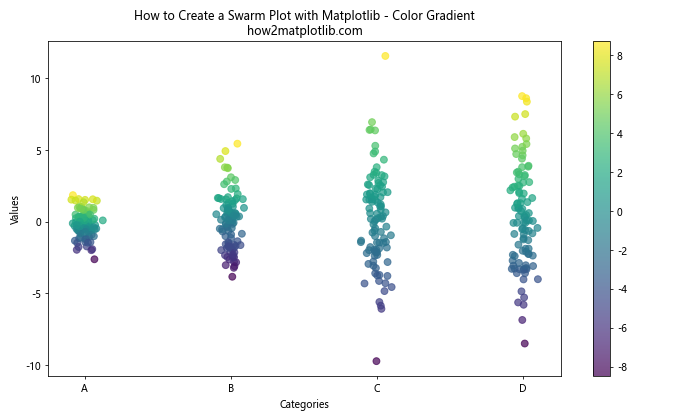
This example demonstrates how to add a color gradient to your swarm plot based on the values of the data points. This can help highlight trends or patterns in your data.
Combining Swarm Plots with Other Plot Types
Swarm plots can be combined with other plot types to provide additional context or information. Let’s explore some common combinations:
Swarm Plot with Box Plot
import matplotlib.pyplot as plt
import seaborn as sns
import numpy as np
import pandas as pd

np.random.seed(42)
data = pd.DataFrame({
    'category': ['A', 'B', 'C', 'D'] * 25,
    'value': np.random.randn(100)
})

fig, ax = plt.subplots(figsize=(10, 6))

sns.boxplot(x='category', y='value', data=data, ax=ax, whis=np.inf, color='lightgray')
sns.swarmplot(x='category', y='value', data=data, ax=ax, color='darkblue', alpha=0.7)

ax.set_title('How to Create a Swarm Plot with Matplotlib - Combined with Box Plot\nhow2matplotlib.com')
plt.tight_layout()
plt.show()
Output:
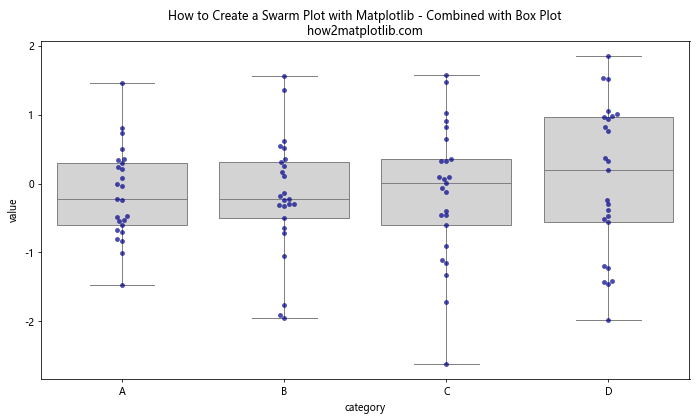
This example shows how to combine a swarm plot with a box plot, providing both individual data points and summary statistics in a single visualization.
Swarm Plot with Violin Plot
import matplotlib.pyplot as plt
import seaborn as sns
import numpy as np
import pandas as pd

np.random.seed(42)
data = pd.DataFrame({
    'category': ['A', 'B', 'C', 'D'] * 25,
    'value': np.random.randn(100)
})

fig, ax = plt.subplots(figsize=(10, 6))

sns.violinplot(x='category', y='value', data=data, ax=ax, inner=None, color='lightgray')
sns.swarmplot(x='category', y='value', data=data, ax=ax, color='darkblue', alpha=0.7)

ax.set_title('How to Create a Swarm Plot with Matplotlib - Combined with Violin Plot\nhow2matplotlib.com')
plt.tight_layout()
plt.show()
Output:
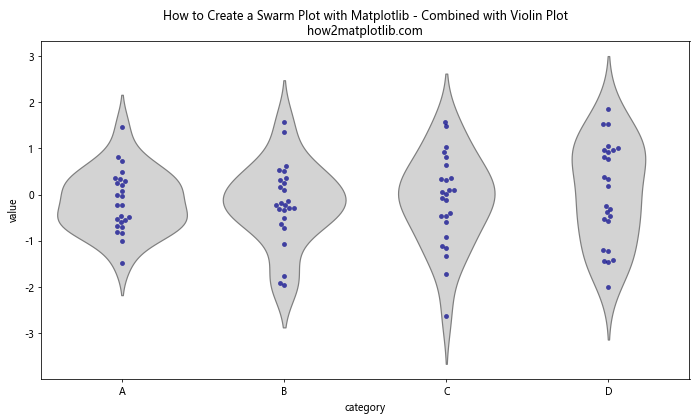
This example demonstrates how to combine a swarm plot with a violin plot, showing both the distribution of data and individual data points.
Handling Large Datasets in Swarm Plots
When dealing with large datasets, swarm plots can become cluttered and difficult to read. Here are some strategies to handle large datasets:
Subsampling
import matplotlib.pyplot as plt
import seaborn as sns
import numpy as np
import pandas as pd

np.random.seed(42)
data = pd.DataFrame({
    'category': ['A', 'B', 'C', 'D'] * 250,
    'value': np.random.randn(1000)
})

fig, (ax1, ax2) = plt.subplots(1, 2, figsize=(15, 6))

# Full dataset
sns.swarmplot(x='category', y='value', data=data, ax=ax1)
ax1.set_title('Full Dataset\nhow2matplotlib.com')

# Subsampled dataset
sampled_data = data.groupby('category').apply(lambda x: x.sample(n=50)).reset_index(drop=True)
sns.swarmplot(x='category', y='value', data=sampled_data, ax=ax2)
ax2.set_title('Subsampled Dataset\nhow2matplotlib.com')

plt.tight_layout()
plt.show()
Output:
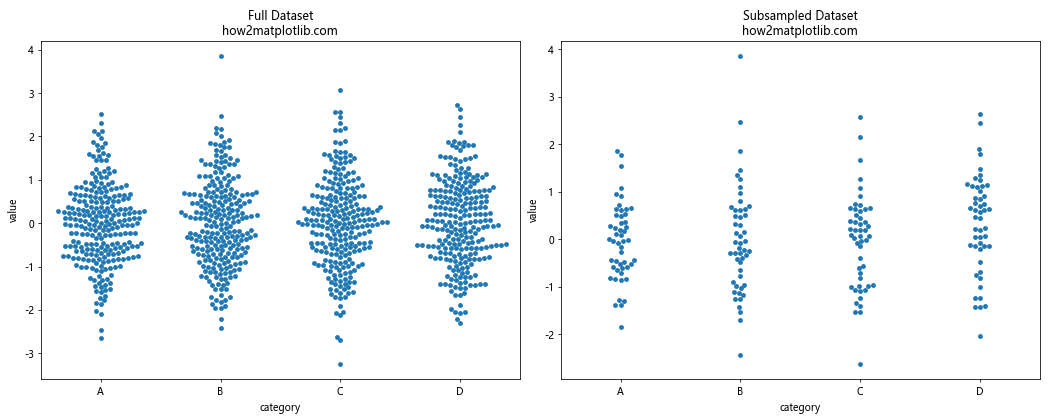
This example shows how to subsample your data to create a more readable swarm plot when dealing with large datasets.
Using Transparency
import matplotlib.pyplot as plt
import seaborn as sns
import numpy as np
import pandas as pd

np.random.seed(42)
data = pd.DataFrame({
    'category': ['A', 'B', 'C', 'D'] * 250,
    'value': np.random.randn(1000)
})

fig, ax = plt.subplots(figsize=(10, 6))

sns.swarmplot(x='category', y='value', data=data, ax=ax, alpha=0.3)

ax.set_title('How to Create a Swarm Plot with Matplotlib - Large Dataset with Transparency\nhow2matplotlib.com')
plt.tight_layout()
plt.show()
Output:
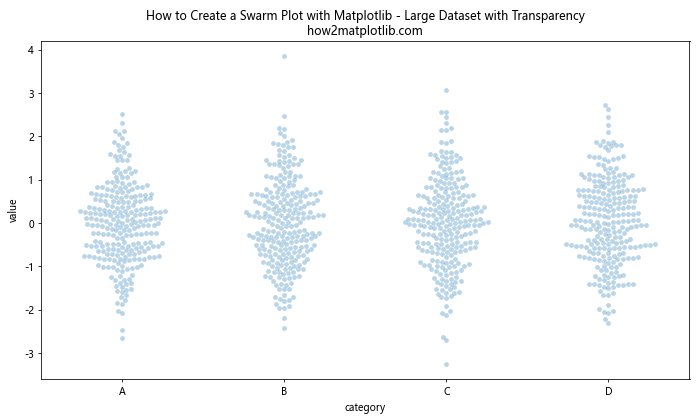
This example demonstrates how to use transparency to make swarm plots more readable when dealing with large datasets.
Advanced Techniques for Swarm Plots with Matplotlib
Now that we’ve covered the basics of how to create a swarm plot with Matplotlib, let’s explore some advanced techniques to enhance your visualizations.
Multiple Swarm Plots in a Single Figure
import matplotlib.pyplot as plt
import seaborn as sns
import numpy as np
import pandas as pd

np.random.seed(42)
data1 = pd.DataFrame({
    'category': ['A', 'B', 'C'] * 20,
    'value': np.random.randn(60)
})
data2 = pd.DataFrame({
    'category': ['X', 'Y', 'Z'] * 20,
    'value': np.random.randn(60) + 1
})

fig, (ax1, ax2) = plt.subplots(1, 2, figsize=(15, 6))

sns.swarmplot(x='category', y='value', data=data1, ax=ax1)
ax1.set_title('Dataset 1\nhow2matplotlib.com')

sns.swarmplot(x='category', y='value', data=data2, ax=ax2)
ax2.set_title('Dataset 2\nhow2matplotlib.com')

plt.suptitle('How to Create Multiple Swarm Plots with Matplotlib', fontsize=16)
plt.tight_layout()
plt.show()
Output:
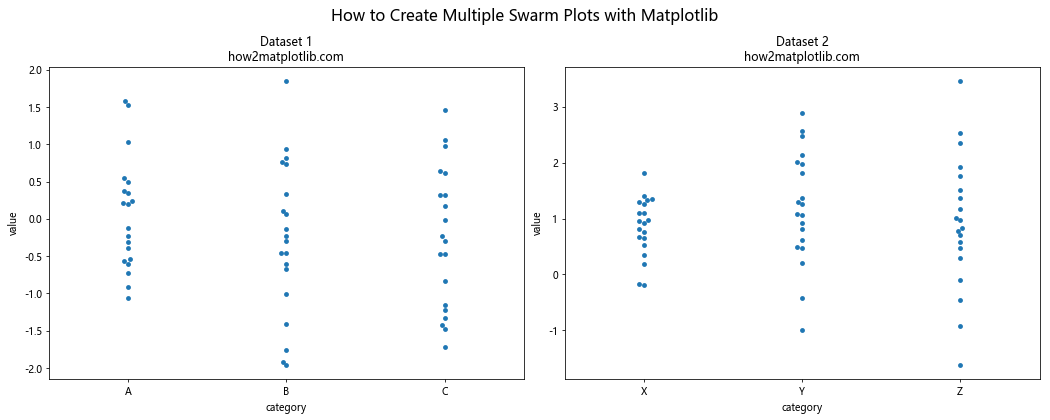
This example shows how to create multiple swarm plots in a single figure, allowing for easy comparison between different datasets.
Swarm Plot with Grouped Categories
import matplotlib.pyplot as plt
import seaborn as sns
import numpy as np
import pandas as pd

np.random.seed(42)
data = pd.DataFrame({
    'category': ['A', 'B', 'C'] * 40,
    'group': ['Group 1', 'Group 2'] * 60,
    'value': np.random.randn(120)
})

fig, ax = plt.subplots(figsize=(12, 6))

sns.swarmplot(x='category', y='value', hue='group', data=data, ax=ax)

ax.set_title('How to Create a Swarm Plot with Matplotlib - Grouped Categories\nhow2matplotlib.com')
plt.tight_layout()
plt.show()
Output:
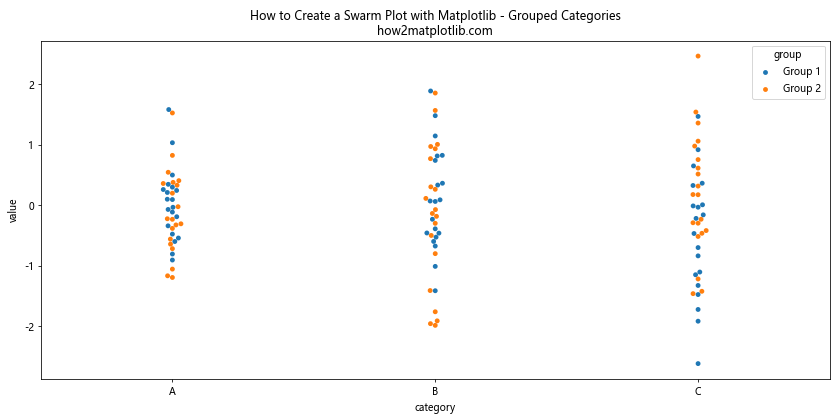
This example demonstrates how to create a swarm plot with grouped categories, allowing for comparison between groups within each category.
Swarm Plot with Custom Ordering
import matplotlib.pyplot as plt
import seaborn as sns
import numpy as np
import pandas as pd

np.random.seed(42)
data = pd.DataFrame({
    'category': ['A', 'B', 'C', 'D'] * 25,
    'value': np.random.randn(100)
})

# Calculate mean values for each category
category_means = data.groupby('category')['value'].mean().sort_values(ascending=False)
custom_order = category_means.index.tolist()

fig, ax = plt.subplots(figsize=(10, 6))

sns.swarmplot(x='category', y='value', data=data, ax=ax, order=custom_order)

ax.set_title('How to Create a Swarm Plot with Matplotlib - Custom Ordering\nhow2matplotlib.com')
plt.tight_layout()
plt.show()
Output:
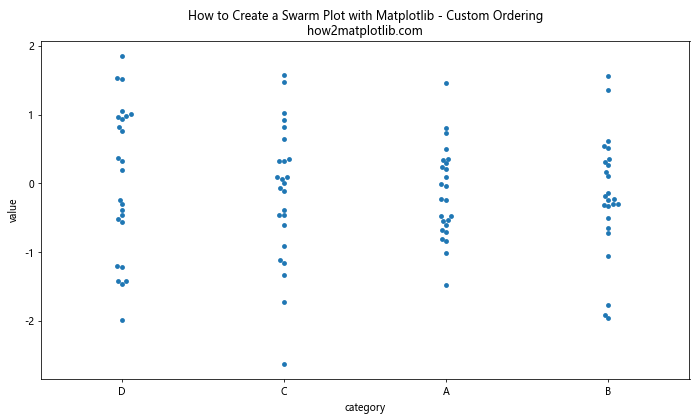
This example shows how to create a swarm plot with custom ordering based on the mean values of each category.
Best Practices for Creating Swarm Plots with Matplotlib
When creating swarm plots with Matplotlib, it’s important to follow some best practices to ensure your visualizations are effective and easy to interpret. Here are some tips to keep in mind:
- Choose appropriate colors: Use colors that are visually distinct and colorblind-friendly.
- Add labels and titles: Always include clear labels for axes and a descriptive title for your plot.
- Adjust point size: Choose an appropriate point size that balances visibility and overlap.
- Use transparency: When dealing with large datasets, use transparency to show density.
- Combine with other plot types: Consider combining swarm plots with box plots or violin plots for additional context.
- Handle overlapping points: Use jittering or other techniques to handle overlapping points in dense areas.
- Scale appropriately: Adjust the figure size to ensure your swarm plot is easily readable.
Let’s implement some of these best practices in an example:
import matplotlib.pyplot as plt
import seaborn as sns
import numpy as np
import pandas as pd

np.random.seed(42)
data = pd.DataFrame({
    'category': ['A', 'B', 'C', 'D'] * 50,
    'value': np.random.randn(200)
})

fig, ax = plt.subplots(figsize=(12, 6))

# Use a colorblind-friendly palette
colors = sns.color_palette("colorblind")

# Create the swarm plot with best practices
sns.swarmplot(x='category', y='value', data=data, ax=ax, palette=colors, size=5, alpha=0.7)

# Add labels and title
ax.set_xlabel('Categories', fontsize=12)
ax.set_ylabel('Values', fontsize=12)
ax.set_title('How to Create an Effective Swarm Plot with Matplotlib\nhow2matplotlib.com', fontsize=14)

# Add a horizontal line at y=0 for reference
ax.axhline(y=0, color='gray', linestyle='--', alpha=0.5)

# Adjust the layout and display the plot
plt.tight_layout()
plt.show()
Output:
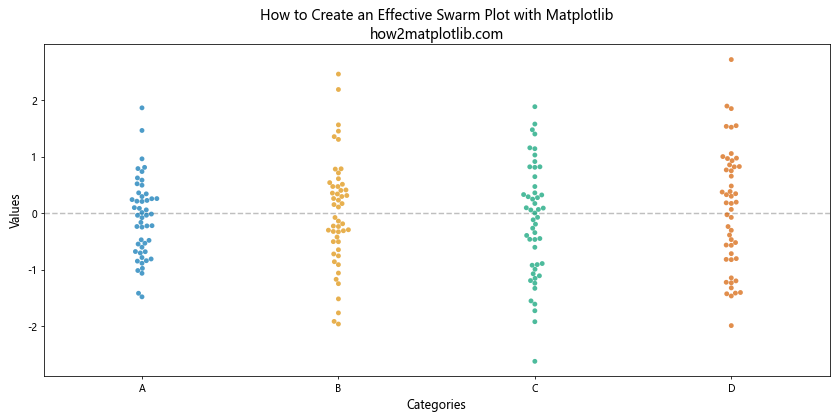
This example incorporates several best practices, including using a colorblind-friendly palette, adding clear labels and titles, adjusting point size and transparency, and adding a reference line.
Troubleshooting Common Issues When Creating Swarm Plots with Matplotlib
When learning how to create a swarm plot with Matplotlib, you may encounter some common issues. Here are some problems you might face and how to solve them:
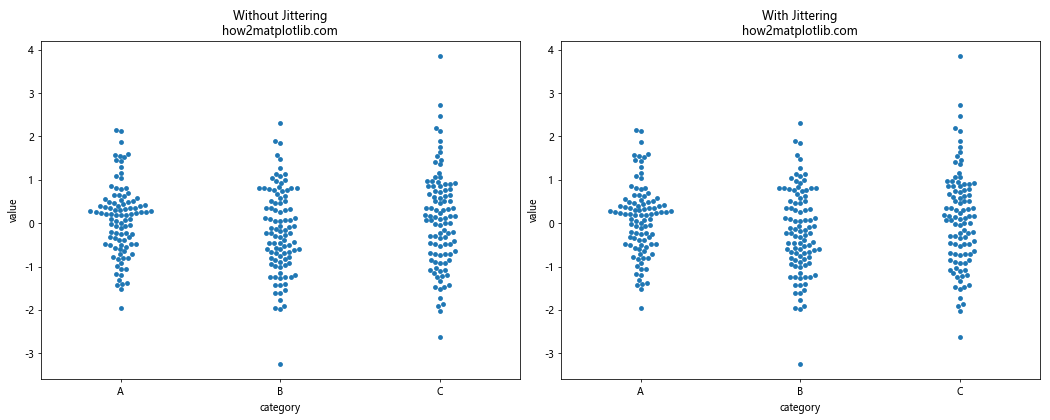
1. Overlapping Points
Problem: In dense areas, points may overlap, making it difficult to see individual data points.
Solution: Use jittering or adjust the plot size.
import matplotlib.pyplot as plt
import seaborn as sns
import numpy as np
import pandas as pd

np.random.seed(42)
data = pd.DataFrame({
    'category': ['A', 'B', 'C'] * 100,
    'value': np.random.randn(300)
})

fig, (ax1, ax2) = plt.subplots(1, 2, figsize=(15, 6))

# Without jittering
sns.swarmplot(x='category', y='value', data=data, ax=ax1)
ax1.set_title('Without Jittering\nhow2matplotlib.com')

# With jittering
sns.swarmplot(x='category', y='value', data=data, ax=ax2, dodge=True)
ax2.set_title('With Jittering\nhow2matplotlib.com')

plt.tight_layout()
plt.show()
Output:
2. Incorrect Data Types
Problem: Swarm plots require categorical data for the x-axis and numerical data for the y-axis.
Solution: Ensure your data types are correct before plotting.
import matplotlib.pyplot as plt
import seaborn as sns
import numpy as np
import pandas as pd

np.random.seed(42)
data = pd.DataFrame({
    'category': ['A', 'B', 'C'] * 33,
    'value': np.random.randn(99)
})

# Incorrect data type
data['category'] = data['category'].astype(float)

fig, (ax1, ax2) = plt.subplots(1, 2, figsize=(15, 6))

# Incorrect plot (will raise an error)
try:
    sns.swarmplot(x='category', y='value', data=data, ax=ax1)
except TypeError as e:
    ax1.text(0.5, 0.5, f"Error: {str(e)}", ha='center', va='center', wrap=True)
ax1.set_title('Incorrect Data Type\nhow2matplotlib.com')

# Correct the data type
data['category'] = data['category'].astype('category')

# Correct plot
sns.swarmplot(x='category', y='value', data=data, ax=ax2)
ax2.set_title('Correct Data Type\nhow2matplotlib.com')

plt.tight_layout()
plt.show()
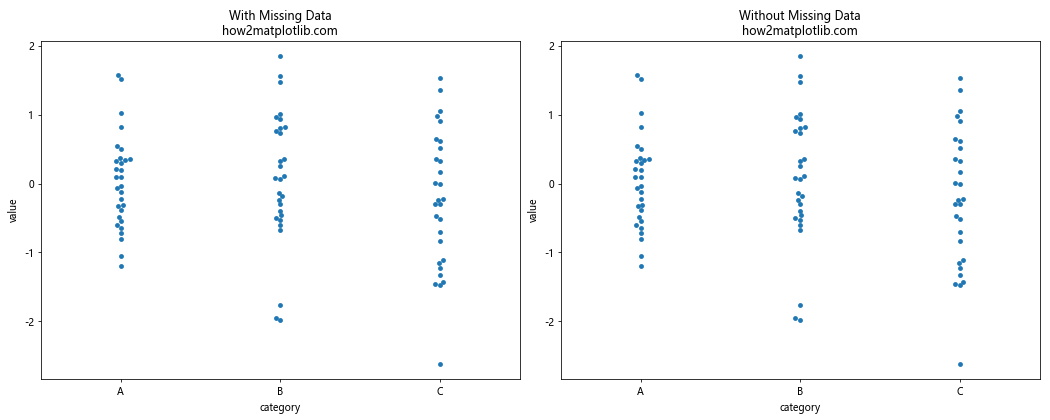
3. Handling Missing Data
Problem: Missing data can cause issues when creating swarm plots.
Solution: Handle missing data before plotting or use Seaborn’s built-in missing data handling.
import matplotlib.pyplot as plt
import seaborn as sns
import numpy as np
import pandas as pd

np.random.seed(42)
data = pd.DataFrame({
    'category': ['A', 'B', 'C'] * 33,
    'value': np.random.randn(99)
})

# Introduce some missing values
data.loc[10:20, 'value'] = np.nan

fig, (ax1, ax2) = plt.subplots(1, 2, figsize=(15, 6))

# Plot with missing data
sns.swarmplot(x='category', y='value', data=data, ax=ax1)
ax1.set_title('With Missing Data\nhow2matplotlib.com')

# Plot without missing data
sns.swarmplot(x='category', y='value', data=data.dropna(), ax=ax2)
ax2.set_title('Without Missing Data\nhow2matplotlib.com')

plt.tight_layout()
plt.show()
Output:
Advanced Customization Techniques for Swarm Plots with Matplotlib
As you become more proficient in creating swarm plots with Matplotlib, you may want to explore more advanced customization techniques. Here are some examples:
1. Custom Color Mapping
import matplotlib.pyplot as plt
import seaborn as sns
import numpy as np
import pandas as pd

np.random.seed(42)
data = pd.DataFrame({
    'category': ['A', 'B', 'C', 'D'] * 25,
    'value': np.random.randn(100),
    'size': np.random.randint(10, 100, 100)
})

fig, ax = plt.subplots(figsize=(10, 6))

scatter = ax.scatter(x=data['category'].map({'A': 0, 'B': 1, 'C': 2, 'D': 3}),
                     y=data['value'],
                     c=data['size'],
                     cmap='viridis',
                     s=data['size'],
                     alpha=0.7)

ax.set_xticks([0, 1, 2, 3])
ax.set_xticklabels(['A', 'B', 'C', 'D'])
ax.set_xlabel('Category')
ax.set_ylabel('Value')
ax.set_title('How to Create a Swarm Plot with Matplotlib - Custom Color Mapping\nhow2matplotlib.com')

plt.colorbar(scatter, label='Size')
plt.tight_layout()
plt.show()
Output:
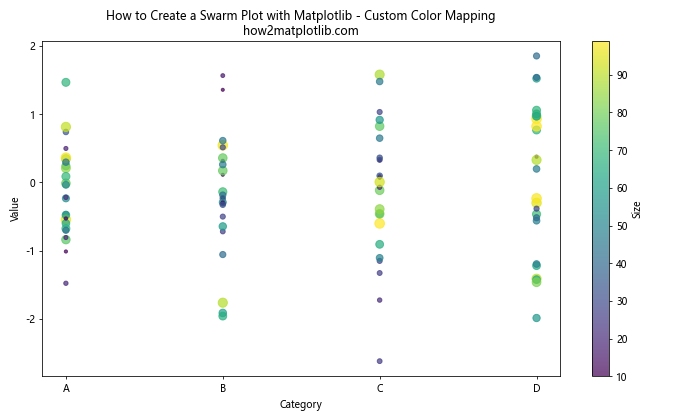
This example demonstrates how to create a swarm plot with custom color mapping based on a third variable.
2. Adding Error Bars
import matplotlib.pyplot as plt
import seaborn as sns
import numpy as np
import pandas as pd

np.random.seed(42)
data = pd.DataFrame({
    'category': ['A', 'B', 'C', 'D'] * 25,
    'value': np.random.randn(100)
})

fig, ax = plt.subplots(figsize=(10, 6))

# Calculate mean and standard error for each category
means = data.groupby('category')['value'].mean()
sems = data.groupby('category')['value'].sem()

# Create the swarm plot
sns.swarmplot(x='category', y='value', data=data, ax=ax, alpha=0.7)

# Add error bars
ax.errorbar(x=range(len(means)), y=means, yerr=sems, fmt='none', c='black', capsize=5)

ax.set_title('How to Create a Swarm Plot with Matplotlib - With Error Bars\nhow2matplotlib.com')
plt.tight_layout()
plt.show()
Output:
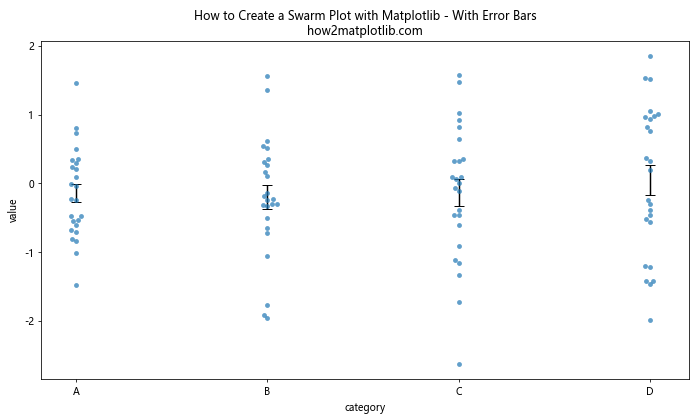
This example shows how to add error bars to your swarm plot to display the mean and standard error for each category.
3. Animated Swarm Plot
import matplotlib.pyplot as plt
import matplotlib.animation as animation
import seaborn as sns
import numpy as np
import pandas as pd

np.random.seed(42)
data = pd.DataFrame({
    'category': ['A', 'B', 'C', 'D'] * 25,
    'value': np.random.randn(100)
})

fig, ax = plt.subplots(figsize=(10, 6))

def animate(frame):
    ax.clear()
    subset = data.iloc[:frame]
    sns.swarmplot(x='category', y='value', data=subset, ax=ax)
    ax.set_title(f'How to Create an Animated Swarm Plot with Matplotlib\nFrame {frame}\nhow2matplotlib.com')
    ax.set_ylim(data['value'].min() - 0.5, data['value'].max() + 0.5)

ani = animation.FuncAnimation(fig, animate, frames=len(data), repeat=False)
plt.tight_layout()
plt.show()
Output:
This example demonstrates how to create an animated swarm plot that builds up over time.
Comparing Swarm Plots to Other Visualization Techniques
When learning how to create a swarm plot with Matplotlib, it’s important to understand when to use swarm plots compared to other visualization techniques. Let’s compare swarm plots to some similar plot types:
Swarm Plot vs. Box Plot
import matplotlib.pyplot as plt
import seaborn as sns
import numpy as np
import pandas as pd

np.random.seed(42)
data = pd.DataFrame({
    'category': ['A', 'B', 'C', 'D'] * 25,
    'value': np.random.randn(100)
})

fig, (ax1, ax2) = plt.subplots(1, 2, figsize=(15, 6))

# Swarm Plot
sns.swarmplot(x='category', y='value', data=data, ax=ax1)
ax1.set_title('Swarm Plot\nhow2matplotlib.com')

# Box Plot
sns.boxplot(x='category', y='value', data=data, ax=ax2)
ax2.set_title('Box Plot\nhow2matplotlib.com')

plt.tight_layout()
plt.show()
Output:
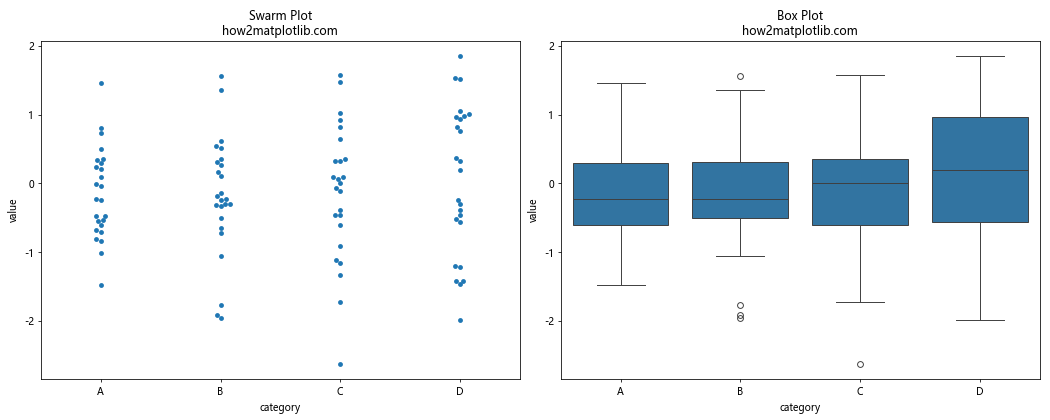
Swarm plots show individual data points, making them ideal for smaller datasets and for identifying outliers. Box plots provide a summary of the data distribution but don’t show individual points.
Swarm Plot vs. Violin Plot
import matplotlib.pyplot as plt
import seaborn as sns
import numpy as np
import pandas as pd

np.random.seed(42)
data = pd.DataFrame({
    'category': ['A', 'B', 'C', 'D'] * 25,
    'value': np.random.randn(100)
})

fig, (ax1, ax2) = plt.subplots(1, 2, figsize=(15, 6))

# Swarm Plot
sns.swarmplot(x='category', y='value', data=data, ax=ax1)
ax1.set_title('Swarm Plot\nhow2matplotlib.com')

# Violin Plot
sns.violinplot(x='category', y='value', data=data, ax=ax2)
ax2.set_title('Violin Plot\nhow2matplotlib.com')

plt.tight_layout()
plt.show()
Output:
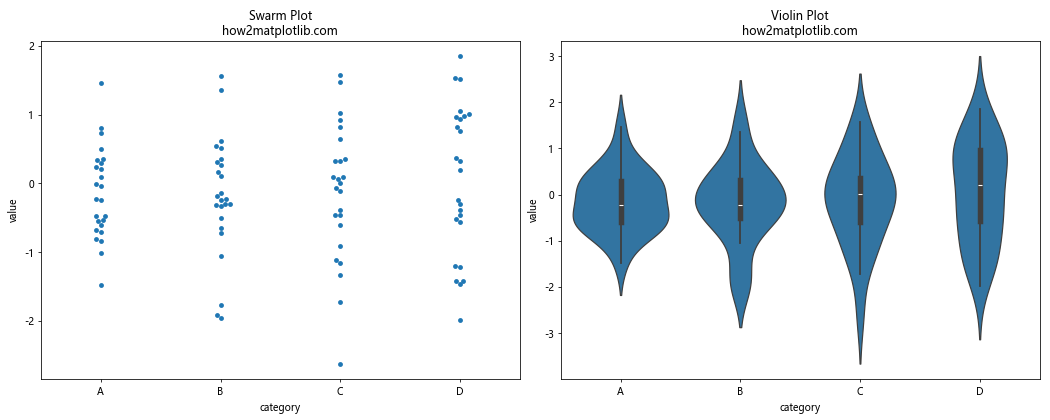
Swarm plots show individual data points, while violin plots show the distribution of data. Violin plots are better for larger datasets and for visualizing the probability density of the data.
Conclusion: Mastering How to Create a Swarm Plot with Matplotlib
In this comprehensive guide, we’ve explored how to create a swarm plot with Matplotlib in great detail. We’ve covered everything from the basics of creating simple swarm plots to advanced techniques for customization and animation. Here’s a summary of the key points we’ve discussed:
- Understanding the importance and use cases of swarm plots
- Setting up your environment for creating swarm plots with Matplotlib
- Creating basic swarm plots and customizing their appearance
- Combining swarm plots with other plot types for more informative visualizations
- Handling large datasets in swarm plots
- Advanced techniques for creating and customizing swarm plots
- Troubleshooting common issues when creating swarm plots
- Comparing swarm plots to other visualization techniques
By mastering how to create a swarm plot with Matplotlib, you’ve added a powerful tool to your data visualization toolkit. Swarm plots are excellent for displaying the distribution of data points across categories, especially for smaller datasets or when you want to highlight individual data points.
Remember to consider your data and visualization goals when choosing between swarm plots and other plot types. While swarm plots excel at showing individual data points and their distribution, they may not be the best choice for very large datasets or when you need to emphasize summary statistics.