How is violinplot() Different from boxplot()
How is violinplot() different from boxplot()? This is a common question among data visualization enthusiasts and professionals alike. Both violinplot() and boxplot() are powerful tools in Matplotlib for visualizing the distribution of data, but they have distinct characteristics and use cases. In this comprehensive guide, we’ll explore the differences between violinplot() and boxplot(), their unique features, and when to use each one. We’ll also provide numerous examples to illustrate these differences and help you master both techniques.
Understanding the Basics: violinplot() vs boxplot()
Before we dive into the specifics of how violinplot() is different from boxplot(), let’s start with a basic understanding of each plot type.
What is a violinplot()?
A violinplot() is a statistical visualization that combines aspects of a box plot with a kernel density plot. It shows the distribution of data across different categories, with the width of each “violin” representing the frequency of data points at that value. The violinplot() is particularly useful for visualizing the full distribution of data, including any multimodal characteristics.
What is a boxplot()?
A boxplot(), also known as a box-and-whisker plot, is a standardized way of displaying the distribution of data based on five summary statistics: minimum, first quartile, median, third quartile, and maximum. It also shows outliers as individual points beyond the whiskers.
Now that we have a basic understanding, let’s explore how violinplot() is different from boxplot() in more detail.
Key Differences: How is violinplot() Different from boxplot()?
- Distribution Representation
- violinplot(): Shows the full probability density of the data at different values.
- boxplot(): Displays summary statistics and outliers.
- Shape
- violinplot(): Resembles a violin or kernel density plot.
- boxplot(): Has a rectangular box with whiskers.
- Detail Level
- violinplot(): Provides more detailed information about the distribution.
- boxplot(): Offers a simpler, more concise summary.
- Multimodal Distribution
- violinplot(): Can clearly show multimodal distributions.
- boxplot(): May not effectively represent multimodal distributions.
- Outlier Representation
- violinplot(): Typically includes outliers within the plot shape.
- boxplot(): Shows outliers as individual points.
Let’s explore these differences with some examples using Matplotlib.
Example 1: Basic violinplot() vs boxplot()
Let’s start with a simple comparison of how violinplot() is different from boxplot() using the same dataset.
import matplotlib.pyplot as plt
import numpy as np

# Generate sample data
np.random.seed(42)
data = [np.random.normal(0, std, 100) for std in range(1, 4)]

fig, (ax1, ax2) = plt.subplots(ncols=2, figsize=(10, 5))

# Violinplot
ax1.violinplot(data)
ax1.set_title("Violinplot - how2matplotlib.com")
ax1.set_ylabel("Value")
ax1.set_xticks([1, 2, 3])
ax1.set_xticklabels(["A", "B", "C"])

# Boxplot
ax2.boxplot(data)
ax2.set_title("Boxplot - how2matplotlib.com")
ax2.set_ylabel("Value")
ax2.set_xticks([1, 2, 3])
ax2.set_xticklabels(["A", "B", "C"])

plt.tight_layout()
plt.show()
Output:
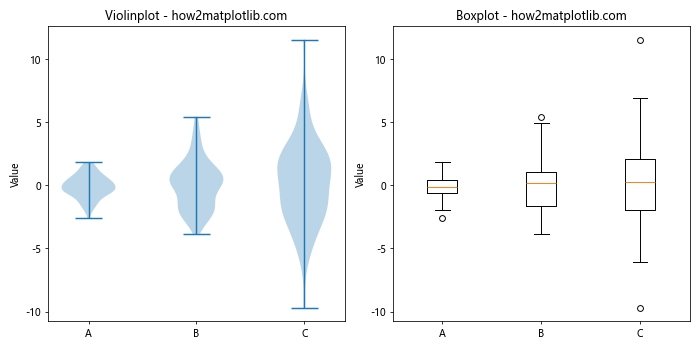
In this example, we create both a violinplot() and a boxplot() side by side to illustrate how violinplot() is different from boxplot(). The violinplot() shows the full distribution of the data, while the boxplot() displays the summary statistics.
Example 2: Multimodal Distribution
One key difference in how violinplot() is different from boxplot() is the ability to represent multimodal distributions effectively.
import matplotlib.pyplot as plt
import numpy as np

# Generate multimodal data
np.random.seed(42)
data1 = np.concatenate([np.random.normal(-2, 0.5, 1000), np.random.normal(2, 0.5, 1000)])
data2 = np.concatenate([np.random.normal(-2, 0.5, 1000), np.random.normal(2, 0.5, 1000)])

fig, (ax1, ax2) = plt.subplots(ncols=2, figsize=(10, 5))

# Violinplot
ax1.violinplot([data1, data2])
ax1.set_title("Violinplot (Multimodal) - how2matplotlib.com")
ax1.set_ylabel("Value")
ax1.set_xticks([1, 2])
ax1.set_xticklabels(["Data 1", "Data 2"])

# Boxplot
ax2.boxplot([data1, data2])
ax2.set_title("Boxplot (Multimodal) - how2matplotlib.com")
ax2.set_ylabel("Value")
ax2.set_xticks([1, 2])
ax2.set_xticklabels(["Data 1", "Data 2"])

plt.tight_layout()
plt.show()
Output:
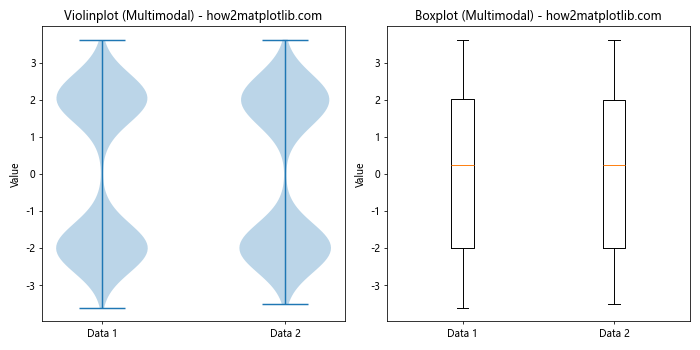
This example demonstrates how violinplot() is different from boxplot() when dealing with multimodal distributions. The violinplot() clearly shows the two peaks in the data, while the boxplot() doesn’t capture this information.
Example 3: Outlier Representation
Another aspect of how violinplot() is different from boxplot() is the way they handle outliers.
import matplotlib.pyplot as plt
import numpy as np

# Generate data with outliers
np.random.seed(42)
data = np.random.normal(0, 1, 1000)
outliers = np.random.uniform(10, 20, 20)
data_with_outliers = np.concatenate([data, outliers])

fig, (ax1, ax2) = plt.subplots(ncols=2, figsize=(10, 5))

# Violinplot
ax1.violinplot([data_with_outliers])
ax1.set_title("Violinplot with Outliers - how2matplotlib.com")
ax1.set_ylabel("Value")
ax1.set_xticks([1])
ax1.set_xticklabels(["Data"])

# Boxplot
ax2.boxplot([data_with_outliers])
ax2.set_title("Boxplot with Outliers - how2matplotlib.com")
ax2.set_ylabel("Value")
ax2.set_xticks([1])
ax2.set_xticklabels(["Data"])

plt.tight_layout()
plt.show()
Output:
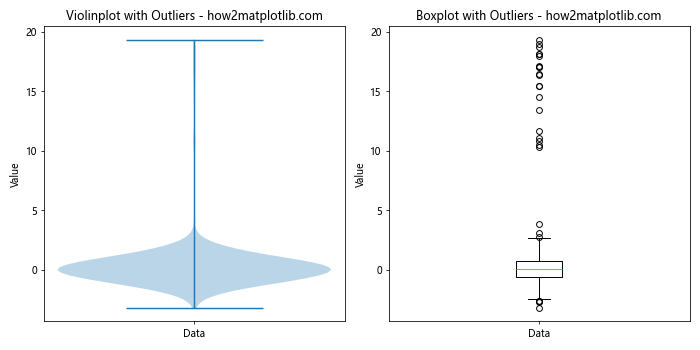
This example shows how violinplot() is different from boxplot() in representing outliers. The violinplot() includes the outliers within its shape, while the boxplot() shows them as individual points.
Customizing violinplot() and boxplot()
Now that we understand how violinplot() is different from boxplot(), let’s explore some customization options for each plot type.
Customizing violinplot()
import matplotlib.pyplot as plt
import numpy as np

# Generate sample data
np.random.seed(42)
data = [np.random.normal(0, std, 100) for std in range(1, 4)]

fig, ax = plt.subplots(figsize=(8, 6))

# Customized violinplot
parts = ax.violinplot(data, showmeans=True, showextrema=False, showmedians=True)

# Customize colors
for pc in parts['bodies']:
    pc.set_facecolor('#D43F3A')
    pc.set_edgecolor('black')
    pc.set_alpha(0.7)

parts['cmeans'].set_color('black')
parts['cmedians'].set_color('blue')

ax.set_title("Customized Violinplot - how2matplotlib.com")
ax.set_ylabel("Value")
ax.set_xticks([1, 2, 3])
ax.set_xticklabels(["A", "B", "C"])

plt.show()
Output:
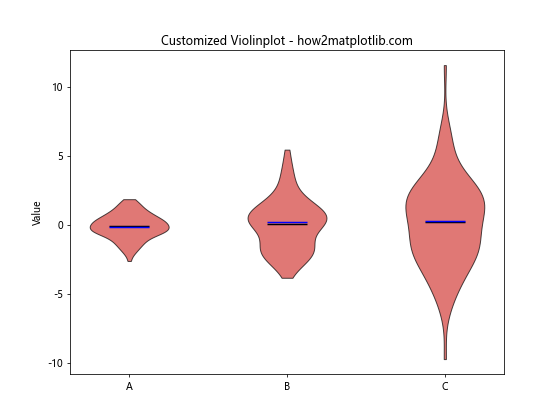
This example demonstrates how to customize a violinplot() by changing colors, adding mean and median lines, and adjusting transparency.
Customizing boxplot()
import matplotlib.pyplot as plt
import numpy as np

# Generate sample data
np.random.seed(42)
data = [np.random.normal(0, std, 100) for std in range(1, 4)]

fig, ax = plt.subplots(figsize=(8, 6))

# Customized boxplot
bp = ax.boxplot(data, patch_artist=True)

# Customize colors
for element in ['boxes', 'whiskers', 'fliers', 'means', 'medians', 'caps']:
    plt.setp(bp[element], color='black')

for patch in bp['boxes']:
    patch.set_facecolor('#D43F3A')
    patch.set_alpha(0.7)

ax.set_title("Customized Boxplot - how2matplotlib.com")
ax.set_ylabel("Value")
ax.set_xticks([1, 2, 3])
ax.set_xticklabels(["A", "B", "C"])

plt.show()
Output:
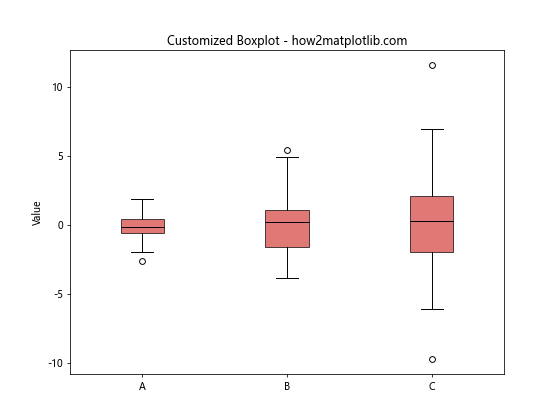
This example shows how to customize a boxplot() by changing colors, adding fill to the boxes, and adjusting the appearance of various elements.
Combining violinplot() and boxplot()
Since we now understand how violinplot() is different from boxplot(), we can explore how to combine them for a more comprehensive visualization.
import matplotlib.pyplot as plt
import numpy as np

# Generate sample data
np.random.seed(42)
data = [np.random.normal(0, std, 100) for std in range(1, 4)]

fig, ax = plt.subplots(figsize=(8, 6))

# Violinplot
parts = ax.violinplot(data, showmeans=False, showextrema=False, showmedians=False)

for pc in parts['bodies']:
    pc.set_facecolor('#D43F3A')
    pc.set_edgecolor('black')
    pc.set_alpha(0.7)

# Boxplot
bp = ax.boxplot(data, positions=[1, 2, 3], widths=0.3, patch_artist=True)

for element in ['boxes', 'whiskers', 'fliers', 'means', 'medians', 'caps']:
    plt.setp(bp[element], color='black')

for patch in bp['boxes']:
    patch.set_facecolor('white')

ax.set_title("Combined Violinplot and Boxplot - how2matplotlib.com")
ax.set_ylabel("Value")
ax.set_xticks([1, 2, 3])
ax.set_xticklabels(["A", "B", "C"])

plt.show()
Output:
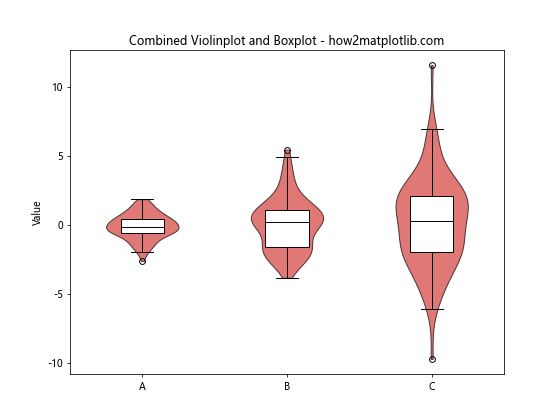
This example combines violinplot() and boxplot() to show how they can complement each other, leveraging the strengths of both visualization techniques.
When to Use violinplot() vs boxplot()
Now that we’ve explored how violinplot() is different from boxplot(), let’s discuss when to use each type of plot:
Use violinplot() when:
- You want to show the full distribution of the data.
- The data may have multimodal characteristics.
- You need to compare distributions across multiple categories.
- You want to visualize the probability density at different values.
Use boxplot() when:
- You need a simple, concise summary of the data.
- You want to focus on key statistics (median, quartiles, outliers).
- You’re comparing distributions across many categories and need a compact representation.
- You’re working with stakeholders who are more familiar with traditional statistical summaries.
Advanced Techniques: Enhancing violinplot() and boxplot()
Let’s explore some advanced techniques to further enhance our understanding of how violinplot() is different from boxplot().
Adding Individual Data Points to violinplot()
import matplotlib.pyplot as plt
import numpy as np
import seaborn as sns

# Generate sample data
np.random.seed(42)
data = [np.random.normal(0, std, 30) for std in range(1, 4)]

fig, ax = plt.subplots(figsize=(8, 6))

# Violinplot with individual points
parts = ax.violinplot(data, showmeans=True, showextrema=False, showmedians=True)

# Customize violinplot
for pc in parts['bodies']:
    pc.set_facecolor('#D43F3A')
    pc.set_edgecolor('black')
    pc.set_alpha(0.7)

parts['cmeans'].set_color('black')
parts['cmedians'].set_color('blue')

# Add individual points
for i, d in enumerate(data):
    sns.stripplot(x=np.full_like(d, i+1), y=d, ax=ax, color='black', alpha=0.5, jitter=True)

ax.set_title("Violinplot with Individual Points - how2matplotlib.com")
ax.set_ylabel("Value")
ax.set_xticks([1, 2, 3])
ax.set_xticklabels(["A", "B", "C"])

plt.show()
Output:
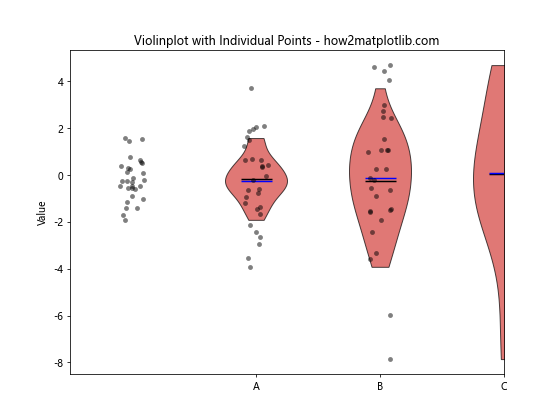
This example demonstrates how to add individual data points to a violinplot(), providing a more detailed view of the data distribution.
Creating a Horizontal boxplot()
import matplotlib.pyplot as plt
import numpy as np

# Generate sample data
np.random.seed(42)
data = [np.random.normal(0, std, 100) for std in range(1, 4)]

fig, ax = plt.subplots(figsize=(8, 6))

# Horizontal boxplot
bp = ax.boxplot(data, vert=False, patch_artist=True)

# Customize boxplot
for element in ['boxes', 'whiskers', 'fliers', 'means', 'medians', 'caps']:
    plt.setp(bp[element], color='black')

for patch in bp['boxes']:
    patch.set_facecolor('#D43F3A')
    patch.set_alpha(0.7)

ax.set_title("Horizontal Boxplot - how2matplotlib.com")
ax.set_xlabel("Value")
ax.set_yticks([1, 2, 3])
ax.set_yticklabels(["A", "B", "C"])

plt.show()
Output:
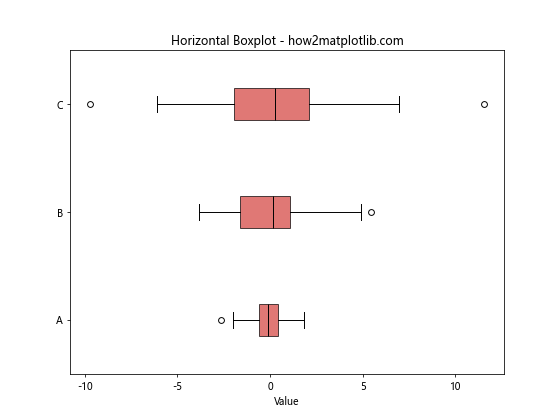
This example shows how to create a horizontal boxplot(), which can be useful when dealing with long category names or when you want to emphasize the horizontal comparison of distributions.
Comparing Multiple Groups: violinplot() vs boxplot()
Let’s explore how violinplot() is different from boxplot() when comparing multiple groups of data.
import matplotlib.pyplot as plt
import numpy as np

# Generate sample data
np.random.seed(42)
data1 = [np.random.normal(0, std, 100) for std in range(1, 4)]
data2 = [np.random.normal(1, std, 100) for std in range(1, 4)]

fig, (ax1, ax2) = plt.subplots(nrows=2, figsize=(10, 10))

# Violinplot
parts = ax1.violinplot(data1 + data2, positions=[1, 2, 3, 5, 6, 7], showmeans=True, showmedians=True)

# Customize violinplot
for pc in parts['bodies'][:3]:
    pc.set_facecolor('#D43F3A')
    pc.set_alpha(0.7)

for pc in parts['bodies'][3:]:
    pc.set_facecolor('#357EBD')
    pc.set_alpha(0.7)

ax1.set_title("Violinplot: Multiple Groups - how2matplotlib.com")
ax1.set_ylabel("Value")
ax1.set_xticks([1, 2, 3, 5, 6, 7])
ax1.set_xticklabels(["A1", "B1", "C1", "A2", "B2", "C2"])

# Boxplot
bp = ax2.boxplot(data1 + data2, positions=[1, 2, 3, 5, 6, 7], patch_artist=True)

# Customize boxplot
for element in ['boxes', 'whiskers', 'fliers', 'means', 'medians', 'caps']:
    plt.setp(bp[element], color='black')

for patch in bp['boxes'][:3]:
    patch.set_facecolor('#D43F3A')
    patch.set_alpha(0.7)

for patch in bp['boxes'][3:]:
    patch.set_facecolor('#357EBD')
    patch.set_alpha(0.7)

ax2.set_title("Boxplot: Multiple Groups - how2matplotlib.com")
ax2.set_ylabel("Value")
ax2.set_xticks([1, 2, 3, 5, 6, 7])
ax2.set_xticklabels(["A1", "B1", "C1", "A2", "B2", "C2"])

plt.tight_layout()
plt.show()
Output:
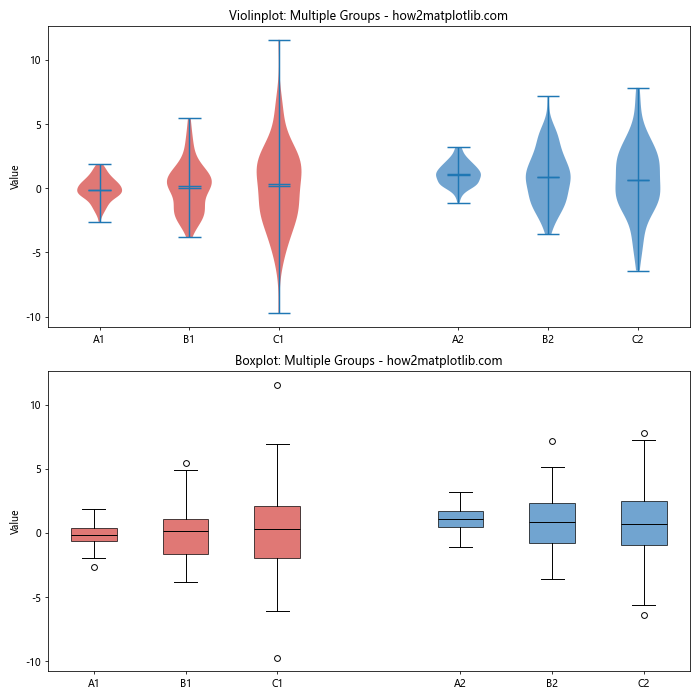
This example illustrates how violinplot() is different from boxplot() when comparing multiple groups of data. The violinplot() provides a more detailed view of the distribution, while the boxplot() offers a concise summary of key statistics.
Handling Categorical Data: violinplot() vs boxplot()
Let’s explore how violinplot() is different from boxplot() when dealing with categorical data.
import matplotlib.pyplot as plt
import numpy as np
import pandas as pd

# Generate sample data
np.random.seed(42)
categories = ['Low', 'Medium', 'High']
data = pd.DataFrame({
    'Category': np.random.choice(categories, 300),
    'Value': np.concatenate([
        np.random.normal(10, 2, 100),
        np.random.normal(20, 3, 100),
        np.random.normal(30, 4, 100)
    ])
})

fig, (ax1, ax2) = plt.subplots(ncols=2, figsize=(12, 6))

# Violinplot
ax1.violinplot([data[data['Category'] == cat]['Value'] for cat in categories],
               showmeans=True, showmedians=True)
ax1.set_title("Violinplot: Categorical Data - how2matplotlib.com")
ax1.set_ylabel("Value")
ax1.set_xticks([1, 2, 3])
ax1.set_xticklabels(categories)

# Boxplot
ax2.boxplot([data[data['Category'] == cat]['Value'] for cat in categories])
ax2.set_title("Boxplot: Categorical Data - how2matplotlib.com")
ax2.set_ylabel("Value")
ax2.set_xticks([1, 2, 3])
ax2.set_xticklabels(categories)

plt.tight_layout()
plt.show()
Output:
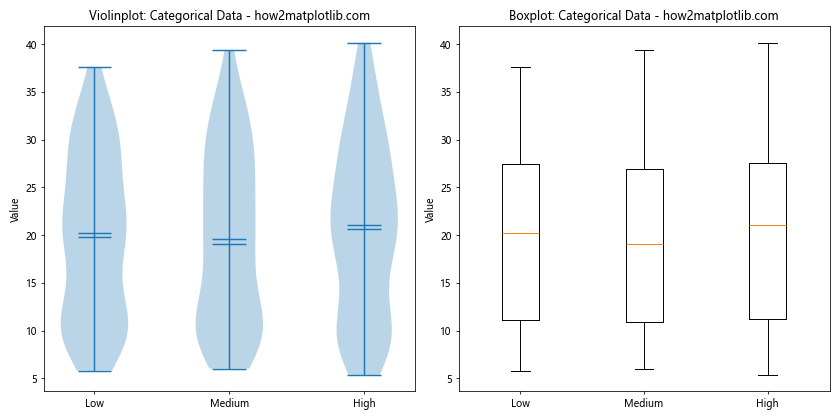
This example demonstrates how violinplot() is different from boxplot() when visualizing categorical data. The violinplot() shows the full distribution for each category, while the boxplot() provides a summary of key statistics.
Comparing Asymmetric Distributions: violinplot() vs boxplot()
Let’s examine how violinplot() is different from boxplot() when dealing with asymmetric distributions.
import matplotlib.pyplot as plt
import numpy as np
from scipy import stats

# Generate asymmetric distributions
np.random.seed(42)
data1 = stats.skewnorm.rvs(a=5, loc=0, scale=1, size=1000)
data2 = stats.skewnorm.rvs(a=-5, loc=0, scale=1, size=1000)

fig, (ax1, ax2) = plt.subplots(ncols=2, figsize=(12, 6))

# Violinplot
ax1.violinplot([data1, data2], showmeans=True, showmedians=True)
ax1.set_title("Violinplot: Asymmetric Distributions - how2matplotlib.com")
ax1.set_ylabel("Value")
ax1.set_xticks([1, 2])
ax1.set_xticklabels(["Right-skewed", "Left-skewed"])

# Boxplot
ax2.boxplot([data1, data2])
ax2.set_title("Boxplot: Asymmetric Distributions - how2matplotlib.com")
ax2.set_ylabel("Value")
ax2.set_xticks([1, 2])
ax2.set_xticklabels(["Right-skewed", "Left-skewed"])

plt.tight_layout()
plt.show()
Output:
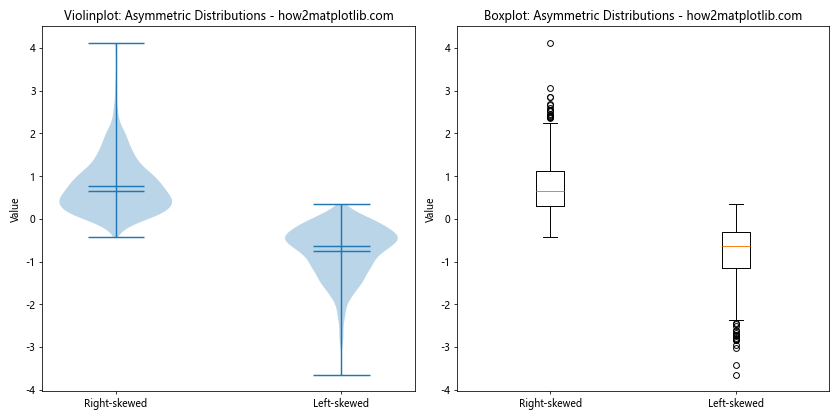
This example illustrates how violinplot() is different from boxplot() when visualizing asymmetric distributions. The violinplot() clearly shows the skewness of the distributions, while the boxplot() may not capture this information as effectively.
Comparing Small Sample Sizes: violinplot() vs boxplot()
Let’s explore how violinplot() is different from boxplot() when dealing with small sample sizes.
import matplotlib.pyplot as plt
import numpy as np

# Generate small sample data
np.random.seed(42)
data1 = np.random.normal(0, 1, 10)
data2 = np.random.normal(2, 1, 10)

fig, (ax1, ax2) = plt.subplots(ncols=2, figsize=(12, 6))

# Violinplot
ax1.violinplot([data1, data2], showmeans=True, showmedians=True)
ax1.set_title("Violinplot: Small Sample Size - how2matplotlib.com")
ax1.set_ylabel("Value")
ax1.set_xticks([1, 2])
ax1.set_xticklabels(["Sample 1", "Sample 2"])

# Boxplot
ax2.boxplot([data1, data2])
ax2.set_title("Boxplot: Small Sample Size - how2matplotlib.com")
ax2.set_ylabel("Value")
ax2.set_xticks([1, 2])
ax2.set_xticklabels(["Sample 1", "Sample 2"])

plt.tight_layout()
plt.show()
Output:
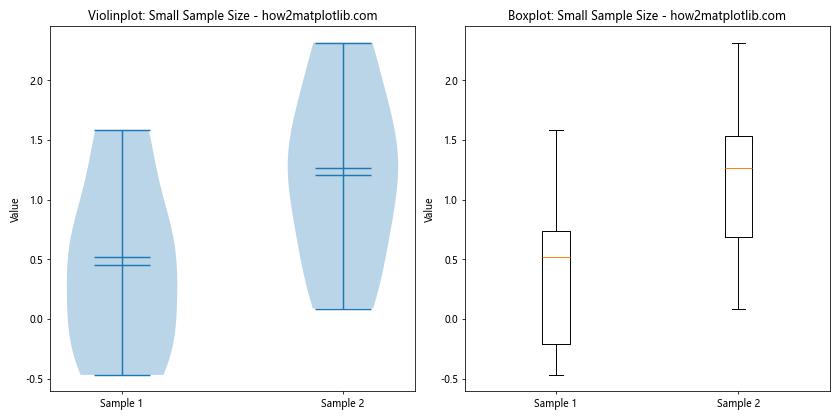
This example demonstrates how violinplot() is different from boxplot() when working with small sample sizes. The violinplot() may provide less reliable information about the distribution, while the boxplot() can still offer a meaningful summary of the data.
Conclusion: How is violinplot() Different from boxplot()?
In this comprehensive guide, we’ve explored the question “How is violinplot() different from boxplot()” in great detail. We’ve seen that while both violinplot() and boxplot() are valuable tools for visualizing data distributions, they have distinct characteristics and use cases.
Key takeaways on how violinplot() is different from boxplot():
- Distribution representation: violinplot() shows the full probability density, while boxplot() displays summary statistics.
- Shape: violinplot() resembles a violin or kernel density plot, while boxplot() has a rectangular box with whiskers.
- Detail level: violinplot() provides more detailed information about the distribution, while boxplot() offers a simpler, more concise summary.
- Multimodal distribution: violinplot() can clearly show multimodal distributions, while boxplot() may not effectively represent them.
- Outlier representation: violinplot() typically includes outliers within the plot shape, while boxplot() shows outliers as individual points.
When deciding between violinplot() and boxplot(), consider the following:
- Use violinplot() when you want to show the full distribution of the data, especially for multimodal distributions or when comparing distributions across multiple categories.
- Use boxplot() when you need a simple, concise summary of the data, focusing on key statistics like median, quartiles, and outliers.
Both violinplot() and boxplot() have their strengths and weaknesses, and the choice between them depends on your specific data visualization needs and the characteristics of your dataset. By understanding how violinplot() is different from boxplot(), you can make informed decisions about which plot type to use in your data analysis and presentation.