How to Change the Transparency of a Graph Plot in Matplotlib
How to Change the Transparency of a Graph Plot in Matplotlib is an essential skill for data visualization enthusiasts and professionals alike. Matplotlib, a powerful plotting library for Python, offers various ways to adjust the transparency of graph elements, allowing users to create more visually appealing and informative plots. In this comprehensive guide, we’ll explore different techniques to change the transparency of graph plots in Matplotlib, providing detailed explanations and easy-to-understand code examples.
Understanding Transparency in Matplotlib
Before diving into the specifics of how to change the transparency of a graph plot in Matplotlib, it’s crucial to understand what transparency means in the context of data visualization. Transparency, also known as opacity, refers to the degree to which an object or color is see-through. In Matplotlib, transparency is typically represented by a value between 0 (completely transparent) and 1 (completely opaque).
Changing the transparency of graph elements can serve several purposes:
- Highlighting specific data points or regions
- Reducing visual clutter in dense plots
- Creating layered visualizations
- Enhancing the overall aesthetic appeal of the graph
Now, let’s explore various methods to change the transparency of different graph elements in Matplotlib.
Changing Line Plot Transparency
One of the most common ways to change the transparency of a graph plot in Matplotlib is by adjusting the transparency of line plots. This can be particularly useful when dealing with multiple overlapping lines or when you want to emphasize certain trends in your data.
Here’s a simple example of how to change the transparency of a line plot:
import matplotlib.pyplot as plt
import numpy as np

x = np.linspace(0, 10, 100)
y1 = np.sin(x)
y2 = np.cos(x)

plt.figure(figsize=(10, 6))
plt.plot(x, y1, label='Sine', alpha=0.5)
plt.plot(x, y2, label='Cosine', alpha=0.7)
plt.title('How to Change the Transparency of a Graph Plot in Matplotlib')
plt.xlabel('X-axis')
plt.ylabel('Y-axis')
plt.legend()
plt.text(5, 0.5, 'Visit how2matplotlib.com for more tips!', ha='center')
plt.show()
Output:
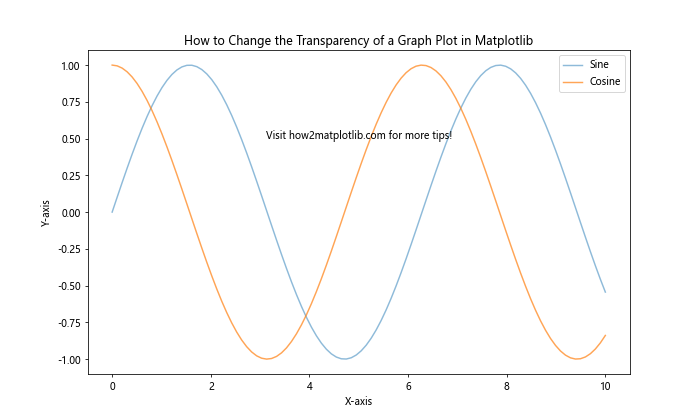
In this example, we’ve created two line plots representing sine and cosine functions. The alpha parameter is used to set the transparency of each line. The sine curve has an alpha value of 0.5 (50% transparent), while the cosine curve has an alpha value of 0.7 (30% transparent).
Adjusting Scatter Plot Transparency
Scatter plots are another common type of graph where changing transparency can be beneficial, especially when dealing with dense or overlapping data points. Here’s how to change the transparency of a scatter plot in Matplotlib:
import matplotlib.pyplot as plt
import numpy as np

np.random.seed(42)
x = np.random.rand(500)
y = np.random.rand(500)

plt.figure(figsize=(10, 6))
plt.scatter(x, y, alpha=0.3, s=50)
plt.title('How to Change the Transparency of a Graph Plot in Matplotlib')
plt.xlabel('X-axis')
plt.ylabel('Y-axis')
plt.text(0.5, 0.95, 'Visit how2matplotlib.com for more tips!', ha='center')
plt.show()
Output:
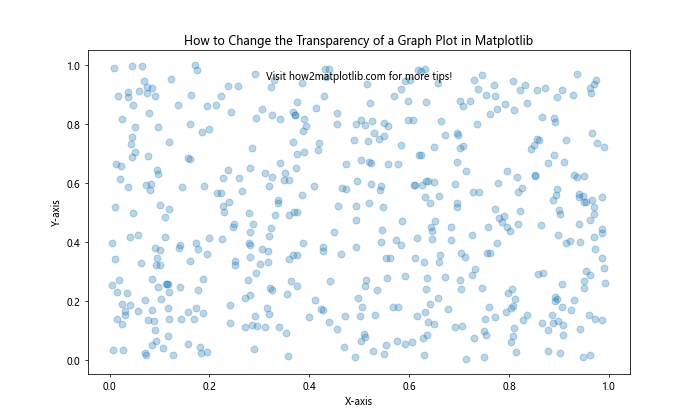
In this example, we’ve created a scatter plot with 500 random data points. The alpha parameter is set to 0.3, making each point 70% transparent. This helps to reveal overlapping points and density patterns in the data.
Modifying Bar Plot Transparency
Bar plots can also benefit from transparency adjustments, especially when comparing multiple categories or dealing with stacked bars. Here’s an example of how to change the transparency of a bar plot in Matplotlib:
import matplotlib.pyplot as plt
import numpy as np

categories = ['A', 'B', 'C', 'D', 'E']
values1 = [4, 7, 3, 8, 5]
values2 = [3, 6, 2, 7, 4]

x = np.arange(len(categories))
width = 0.35

plt.figure(figsize=(10, 6))
plt.bar(x - width/2, values1, width, alpha=0.7, label='Group 1')
plt.bar(x + width/2, values2, width, alpha=0.5, label='Group 2')

plt.title('How to Change the Transparency of a Graph Plot in Matplotlib')
plt.xlabel('Categories')
plt.ylabel('Values')
plt.xticks(x, categories)
plt.legend()
plt.text(2, 8.5, 'Visit how2matplotlib.com for more tips!', ha='center')
plt.show()
Output:
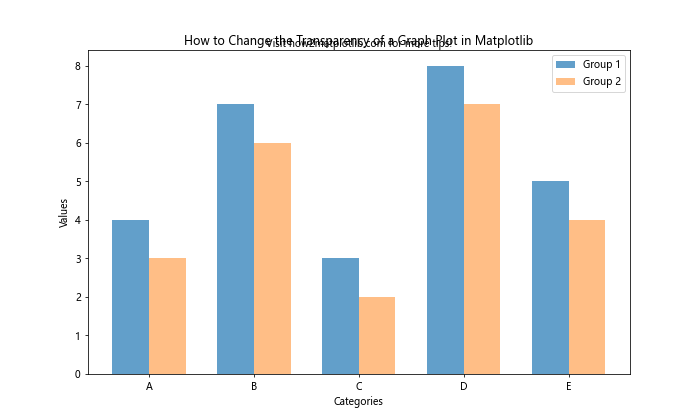
In this example, we’ve created a grouped bar plot with two sets of data. The first group has an alpha value of 0.7 (30% transparent), while the second group has an alpha value of 0.5 (50% transparent). This helps to visually distinguish between the two groups while still allowing for easy comparison.
Adjusting Fill Area Transparency
When working with filled areas in plots, such as in area plots or between two curves, changing the transparency can help to reveal underlying patterns or data. Here’s an example of how to change the transparency of filled areas in Matplotlib:
import matplotlib.pyplot as plt
import numpy as np

x = np.linspace(0, 10, 100)
y1 = np.sin(x)
y2 = np.cos(x)

plt.figure(figsize=(10, 6))
plt.fill_between(x, y1, y2, alpha=0.3, label='Area between curves')
plt.plot(x, y1, label='Sine')
plt.plot(x, y2, label='Cosine')

plt.title('How to Change the Transparency of a Graph Plot in Matplotlib')
plt.xlabel('X-axis')
plt.ylabel('Y-axis')
plt.legend()
plt.text(5, 0.5, 'Visit how2matplotlib.com for more tips!', ha='center')
plt.show()
Output:
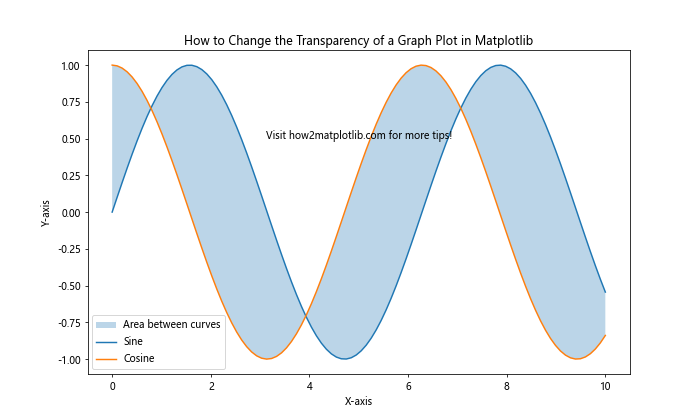
In this example, we’ve used the fill_between() function to create a filled area between the sine and cosine curves. The alpha parameter is set to 0.3, making the filled area 70% transparent. This allows the underlying curves to remain visible while highlighting the area between them.
Changing Heatmap Transparency
Heatmaps are an excellent way to visualize 2D data, and adjusting their transparency can help to reveal underlying patterns or combine them with other plot elements. Here’s how to change the transparency of a heatmap in Matplotlib:
import matplotlib.pyplot as plt
import numpy as np

data = np.random.rand(10, 10)

plt.figure(figsize=(10, 8))
plt.imshow(data, cmap='viridis', alpha=0.7)
plt.colorbar(label='Values')

plt.title('How to Change the Transparency of a Graph Plot in Matplotlib')
plt.xlabel('X-axis')
plt.ylabel('Y-axis')
plt.text(5, -1, 'Visit how2matplotlib.com for more tips!', ha='center')
plt.show()
Output:
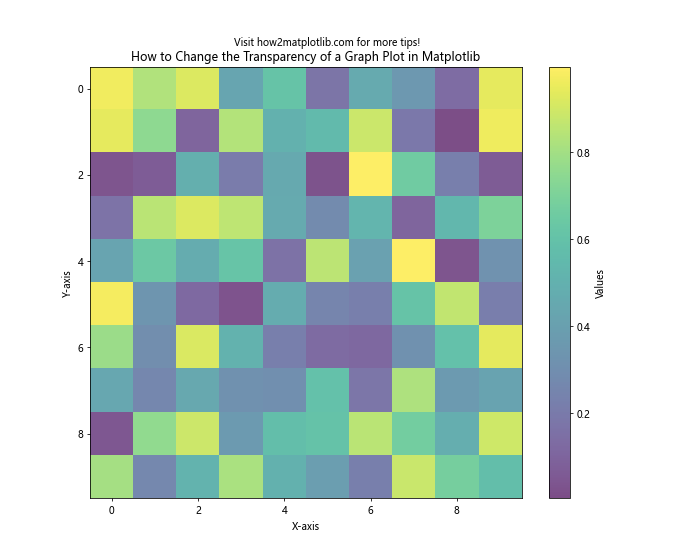
In this example, we’ve created a heatmap using random data. The alpha parameter in the imshow() function is set to 0.7, making the heatmap 30% transparent. This can be particularly useful when overlaying the heatmap on other plot elements or background images.
Adjusting Contour Plot Transparency
Contour plots are useful for visualizing 3D data on a 2D plane. Changing their transparency can help to reveal underlying patterns or combine them with other plot elements. Here’s an example of how to change the transparency of a contour plot in Matplotlib:
import matplotlib.pyplot as plt
import numpy as np

x = np.linspace(-3, 3, 100)
y = np.linspace(-3, 3, 100)
X, Y = np.meshgrid(x, y)
Z = np.sin(X) * np.cos(Y)

plt.figure(figsize=(10, 8))
contour = plt.contourf(X, Y, Z, levels=20, cmap='viridis', alpha=0.6)
plt.colorbar(contour, label='Values')

plt.title('How to Change the Transparency of a Graph Plot in Matplotlib')
plt.xlabel('X-axis')
plt.ylabel('Y-axis')
plt.text(0, -3.5, 'Visit how2matplotlib.com for more tips!', ha='center')
plt.show()
Output:
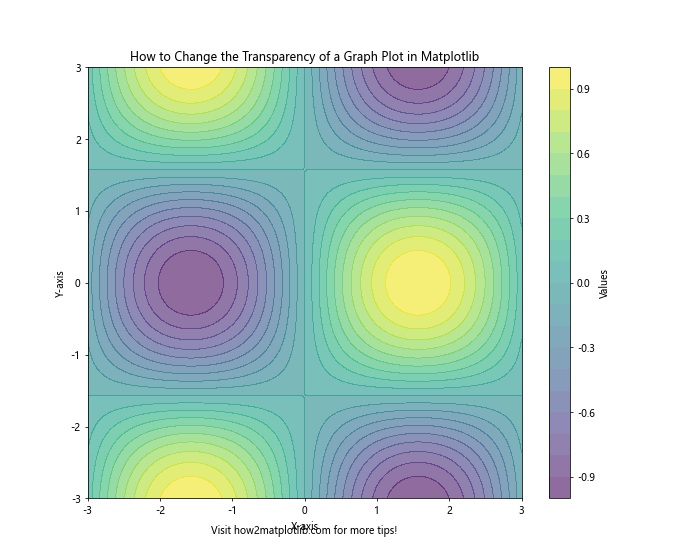
In this example, we’ve created a contour plot using the contourf() function. The alpha parameter is set to 0.6, making the contour fill 40% transparent. This can be helpful when overlaying contour plots on other visualizations or background images.
Adjusting 3D Plot Transparency
Matplotlib also supports 3D plotting, and changing the transparency of 3D plot elements can greatly enhance their visual appeal and clarity. Here’s an example of how to change the transparency of a 3D surface plot in Matplotlib:
import matplotlib.pyplot as plt
import numpy as np
from mpl_toolkits.mplot3d import Axes3D

x = np.linspace(-5, 5, 50)
y = np.linspace(-5, 5, 50)
X, Y = np.meshgrid(x, y)
Z = np.sin(np.sqrt(X**2 + Y**2))

fig = plt.figure(figsize=(12, 8))
ax = fig.add_subplot(111, projection='3d')
surf = ax.plot_surface(X, Y, Z, cmap='viridis', alpha=0.7)

ax.set_xlabel('X-axis')
ax.set_ylabel('Y-axis')
ax.set_zlabel('Z-axis')
ax.set_title('How to Change the Transparency of a Graph Plot in Matplotlib')
plt.colorbar(surf, label='Values')
ax.text2D(0.5, -0.05, 'Visit how2matplotlib.com for more tips!', ha='center', transform=ax.transAxes)
plt.show()
Output:
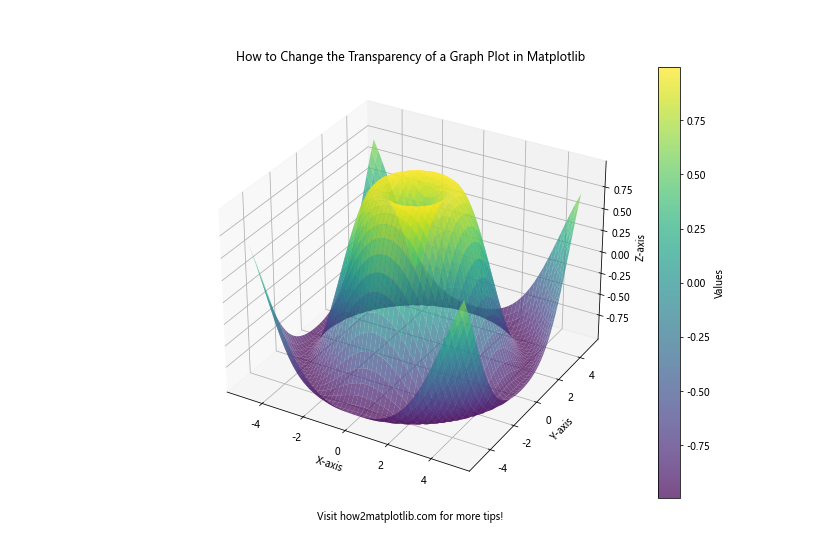
In this example, we’ve created a 3D surface plot using the plot_surface() function. The alpha parameter is set to 0.7, making the surface 30% transparent. This can be particularly useful when visualizing complex 3D data or overlaying multiple surfaces.
Changing Transparency for Specific Plot Elements
Sometimes, you may want to change the transparency of specific plot elements rather than the entire plot. Matplotlib allows you to do this by accessing individual plot elements and adjusting their properties. Here’s an example of how to change the transparency of specific line segments in a plot:
import matplotlib.pyplot as plt
import numpy as np
from matplotlib.collections import LineCollection

x = np.linspace(0, 10, 100)
y = np.sin(x)

points = np.array([x, y]).T.reshape(-1, 1, 2)
segments = np.concatenate([points[:-1], points[1:]], axis=1)

fig, ax = plt.subplots(figsize=(10, 6))
lc = LineCollection(segments, alpha=np.linspace(0.1, 1, len(segments)))
ax.add_collection(lc)

ax.set_xlim(x.min(), x.max())
ax.set_ylim(y.min(), y.max())
ax.set_title('How to Change the Transparency of a Graph Plot in Matplotlib')
ax.set_xlabel('X-axis')
ax.set_ylabel('Y-axis')
ax.text(5, -0.8, 'Visit how2matplotlib.com for more tips!', ha='center')
plt.show()
Output:
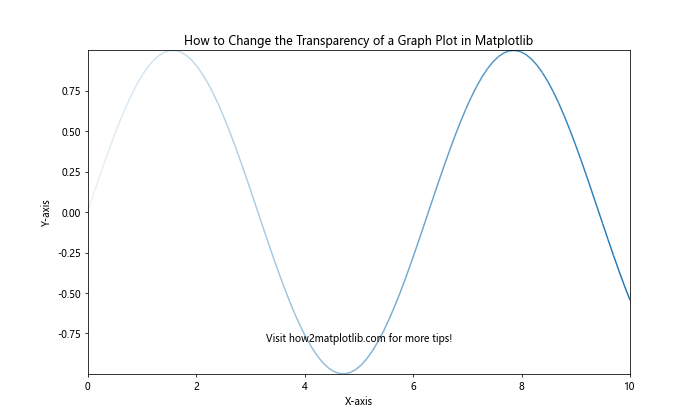
In this example, we’ve created a line plot where the transparency of each line segment gradually changes from 10% to 100% opacity. This technique can be useful for emphasizing specific parts of a plot or creating visual effects.
Adjusting Transparency in Subplots
When working with multiple subplots, you may want to change the transparency of individual plots or elements within each subplot. Here’s an example of how to change the transparency of different elements in a subplot layout:
import matplotlib.pyplot as plt
import numpy as np

fig, axs = plt.subplots(2, 2, figsize=(12, 10))
fig.suptitle('How to Change the Transparency of a Graph Plot in Matplotlib')

# Subplot 1: Line plot with varying transparency
x = np.linspace(0, 10, 100)
y1 = np.sin(x)
y2 = np.cos(x)
axs[0, 0].plot(x, y1, alpha=0.5, label='Sine')
axs[0, 0].plot(x, y2, alpha=0.7, label='Cosine')
axs[0, 0].set_title('Line Plot')
axs[0, 0].legend()

# Subplot 2: Scatter plot with transparency
np.random.seed(42)
x = np.random.rand(100)
y = np.random.rand(100)
axs[0, 1].scatter(x, y, alpha=0.5)
axs[0, 1].set_title('Scatter Plot')

# Subplot 3: Bar plot with transparency
categories = ['A', 'B', 'C', 'D']
values = [4, 7, 3, 8]
axs[1, 0].bar(categories, values, alpha=0.6)
axs[1, 0].set_title('Bar Plot')

# Subplot 4: Heatmap with transparency
data = np.random.rand(10, 10)
im = axs[1, 1].imshow(data, cmap='viridis', alpha=0.7)
axs[1, 1].set_title('Heatmap')
fig.colorbar(im, ax=axs[1, 1])

plt.tight_layout()
fig.text(0.5, 0.02, 'Visit how2matplotlib.com for more tips!', ha='center')
plt.show()
Output:
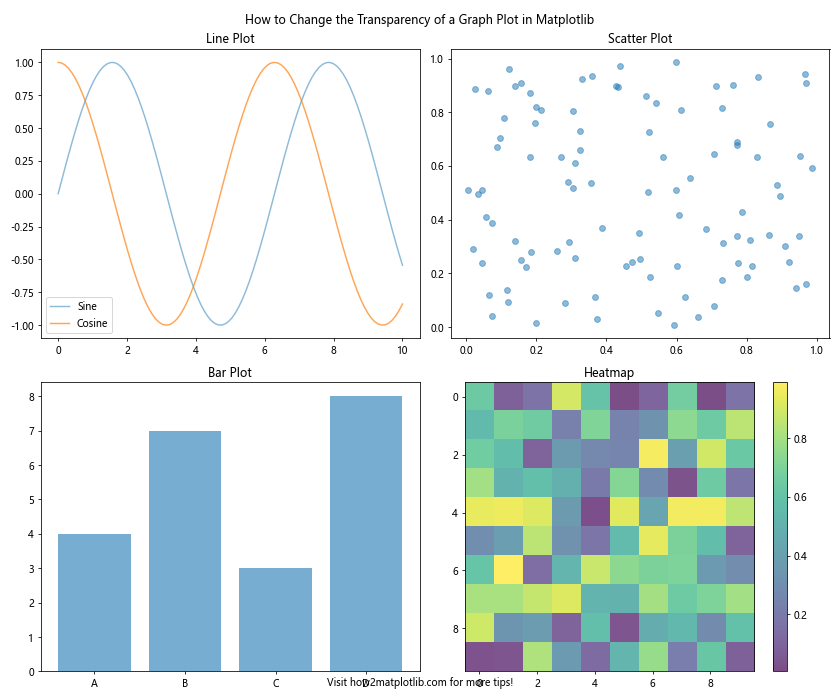
In this example, we’ve created a 2×2 subplot layout with different types of plots, each demonstrating a different use of transparency. This approach allows you to compare and contrast various transparency effects within a single figure.
Using Transparency to Create Layered Visualizations
Transparency can be particularly useful when creating layered visualizations, where multiple plot elements overlap. Here’s an example of how to use transparency to create a layered visualization combining a scatter plot and a contour plot:
import matplotlib.pyplot as plt
import numpy as np

# Generate data for contour plot
x = np.linspace(-3, 3, 100)
y = np.linspace(-3, 3, 100)
X, Y = np.meshgrid(x, y)
Z = np.sin(X) * np.cos(Y)

# Generate data for scatter plot
np.random.seed(42)
scatter_x = np.random.uniform(-3, 3, 200)
scatter_y = np.random.uniform(-3, 3, 200)
scatter_colors = np.random.rand(200)

plt.figure(figsize=(12, 8))

# Create contour plot
contour = plt.contourf(X, Y, Z, levels=20, cmap='viridis', alpha=0.5)
plt.colorbar(contour, label='Contour Values')

# Create scatter plot
scatter = plt.scatter(scatter_x, scatter_y, c=scatter_colors, cmap='plasma', alpha=0.7)
plt.colorbar(scatter, label='Scatter Values')

plt.title('How to Change the Transparency of a Graph Plot in Matplotlib')
plt.xlabel('X-axis')
plt.ylabel('Y-axis')
plt.text(0, -3.5, 'Visit how2matplotlib.com for more tips!', ha='center')
plt.show()
Output:
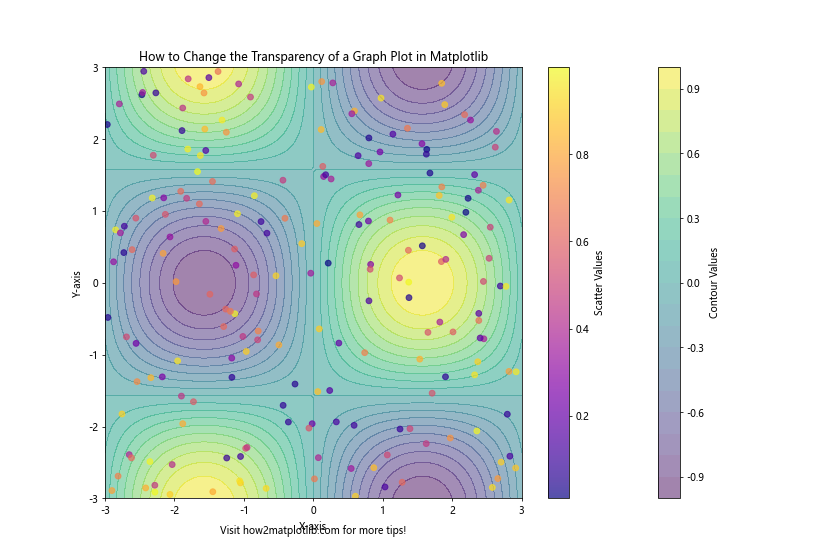
In this example, we’ve combined a contour plot with a scatter plot, using transparency to allow both elements to be visible simultaneously. The contour plot has an alpha value of 0.5, while the scatter plot has an alpha value of 0.7. This layered approach can be useful for visualizing relationships between different datasets or highlighting specific data points within a broader context.
Animating Transparency Changes
Changing transparency dynamically can be an effective way to draw attention to specific aspects of a plot or to create engaging animations. Here’s an example of how to create an animation that changes the transparency of a plot element over time:
import matplotlib.pyplot as plt
import numpy as np
from matplotlib.animation import FuncAnimation

fig, ax = plt.subplots(figsize=(10, 6))
x = np.linspace(0, 2 * np.pi, 100)
line, = ax.plot(x, np.sin(x), alpha=0)

ax.set_xlim(0, 2 * np.pi)
ax.set_ylim(-1.1, 1.1)
ax.set_title('How to Change the Transparency of a Graph Plot in Matplotlib')
ax.text(np.pi, -1.3, 'Visit how2matplotlib.com for more tips!', ha='center')

def update(frame):
    line.set_alpha(frame / 100)
    return line,

ani = FuncAnimation(fig, update, frames=np.linspace(0, 100, 50), blit=True)
plt.show()
Output:
In this example, we’ve created an animation that gradually increases the transparency of a sine wave from completely transparent to fully opaque. This technique can be useful for revealing plot elements sequentially or creating attention-grabbing visualizations.
Adjusting Transparency in 3D Scatter Plots
When working with 3D scatter plots, adjusting transparency can help reveal the structure and density of data points. Here’s an example of how to change the transparency of a 3D scatter plot in Matplotlib:
import matplotlib.pyplot as plt
import numpy as np
from mpl_toolkits.mplot3d import Axes3D

np.random.seed(42)
n_points = 1000
x = np.random.normal(0, 1, n_points)
y = np.random.normal(0, 1, n_points)
z = np.random.normal(0, 1, n_points)

fig = plt.figure(figsize=(10, 8))
ax = fig.add_subplot(111, projection='3d')

scatter = ax.scatter(x, y, z, c=z, cmap='viridis', alpha=0.3)
plt.colorbar(scatter, label='Z-values')

ax.set_xlabel('X-axis')
ax.set_ylabel('Y-axis')
ax.set_zlabel('Z-axis')
ax.set_title('How to Change the Transparency of a Graph Plot in Matplotlib')
ax.text2D(0.5, -0.05, 'Visit how2matplotlib.com for more tips!', ha='center', transform=ax.transAxes)
plt.show()
Output:
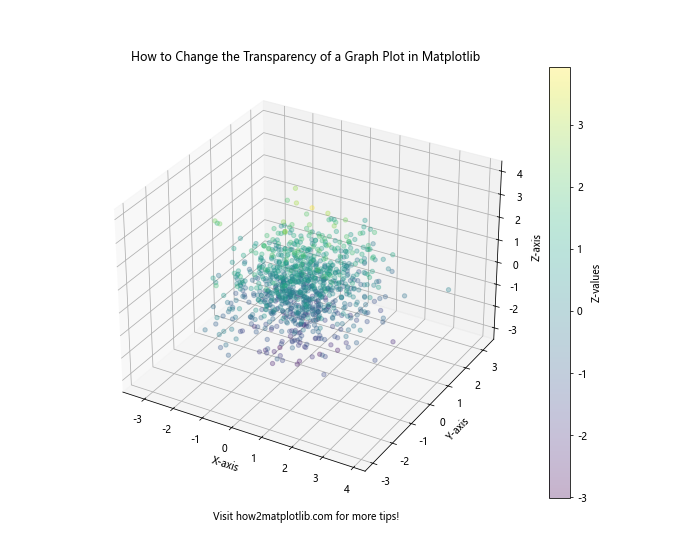
In this example, we’ve created a 3D scatter plot with 1000 points, using the alpha parameter to set the transparency to 0.3 (70% transparent). This allows us to see through the outer layers of points and observe the internal structure of the data cloud.
Conclusion
Learning how to change the transparency of a graph plot in Matplotlib is a valuable skill that can significantly enhance your data visualizations. Throughout this comprehensive guide, we’ve explored various techniques for adjusting transparency in different types of plots, including line plots, scatter plots, bar charts, heatmaps, contour plots, pie charts, and 3D visualizations.
By mastering these techniques, you can:
- Highlight important data points or trends
- Reduce visual clutter in dense plots
- Create layered visualizations that combine multiple data sets
- Enhance the overall aesthetic appeal of your graphs
- Convey additional information through varying levels of transparency
Remember that the key to effective data visualization is finding the right balance between clarity and aesthetics. Experiment with different transparency levels and combinations to find the most effective way to communicate your data insights.