How to Change the Size of Figures Drawn with Matplotlib
How to change the size of figures drawn with matplotlib is an essential skill for data visualization enthusiasts and professionals alike. Matplotlib, a powerful plotting library for Python, offers various methods to adjust figure sizes, allowing users to create visually appealing and properly scaled plots. In this comprehensive guide, we’ll explore different techniques to change figure sizes in Matplotlib, providing detailed explanations and easy-to-understand code examples.
Understanding Figure Size in Matplotlib
Before diving into the methods of changing figure sizes, it’s crucial to understand what figure size means in Matplotlib. The figure size refers to the overall dimensions of the plot, including the axes, labels, and any additional elements. By default, Matplotlib creates figures with a size of 6.4 inches in width and 4.8 inches in height. However, these dimensions can be easily modified to suit your specific needs.
Let’s start with a basic example to illustrate the default figure size:
import matplotlib.pyplot as plt

# Create a simple plot
plt.plot([1, 2, 3, 4], [1, 4, 2, 3])
plt.title("Default Figure Size - how2matplotlib.com")
plt.show()
Output:
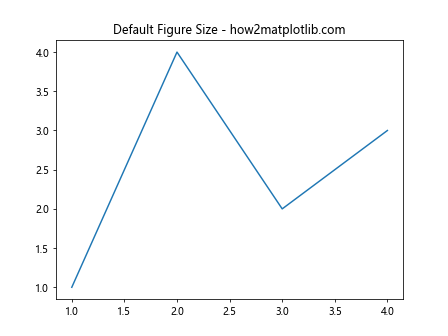
This code creates a simple line plot using the default figure size. Now, let’s explore various methods to change the size of figures drawn with Matplotlib.
Changing Figure Size Using plt.figure()
One of the most straightforward ways to change the size of figures drawn with Matplotlib is by using the plt.figure() function. This function allows you to create a new figure with custom dimensions.
Here’s an example of how to change the figure size using plt.figure():
import matplotlib.pyplot as plt

# Create a figure with custom size
plt.figure(figsize=(10, 6))

# Create a simple plot
plt.plot([1, 2, 3, 4], [1, 4, 2, 3])
plt.title("Custom Figure Size - how2matplotlib.com")
plt.show()
Output:
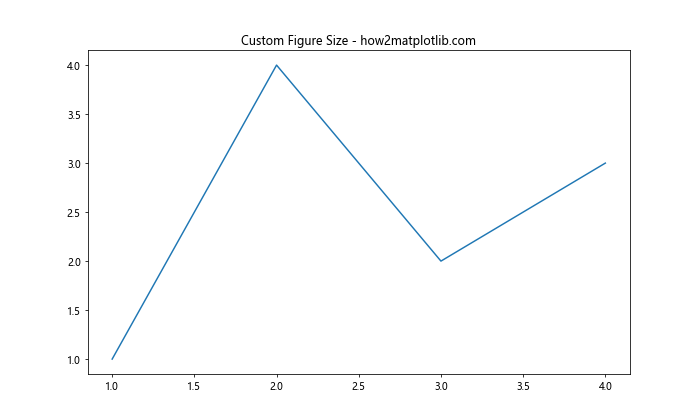
In this example, we use plt.figure(figsize=(10, 6)) to create a figure with a width of 10 inches and a height of 6 inches. The figsize parameter takes a tuple of (width, height) in inches.
Adjusting Figure Size with rcParams
Another way to change the size of figures drawn with Matplotlib is by modifying the rcParams dictionary. This method allows you to set the default figure size for all plots in your script or notebook.
Here’s how you can change the figure size using rcParams:
import matplotlib.pyplot as plt

# Set the default figure size
plt.rcParams['figure.figsize'] = [8, 5]

# Create a simple plot
plt.plot([1, 2, 3, 4], [1, 4, 2, 3])
plt.title("Figure Size Set with rcParams - how2matplotlib.com")
plt.show()
Output:
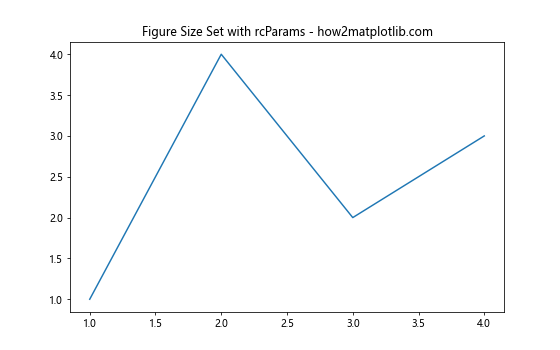
In this example, we set the default figure size to 8 inches in width and 5 inches in height using plt.rcParams['figure.figsize'] = [8, 5]. This change will affect all subsequent plots in your script.
Changing Figure Size for Subplots
When working with subplots, you might want to change the size of the entire figure containing multiple subplots. Here’s how you can do that:
import matplotlib.pyplot as plt

# Create a figure with custom size and subplots
fig, (ax1, ax2) = plt.subplots(1, 2, figsize=(12, 5))

# Plot data on the subplots
ax1.plot([1, 2, 3, 4], [1, 4, 2, 3])
ax1.set_title("Subplot 1 - how2matplotlib.com")

ax2.plot([1, 2, 3, 4], [3, 2, 4, 1])
ax2.set_title("Subplot 2 - how2matplotlib.com")

plt.show()
Output:
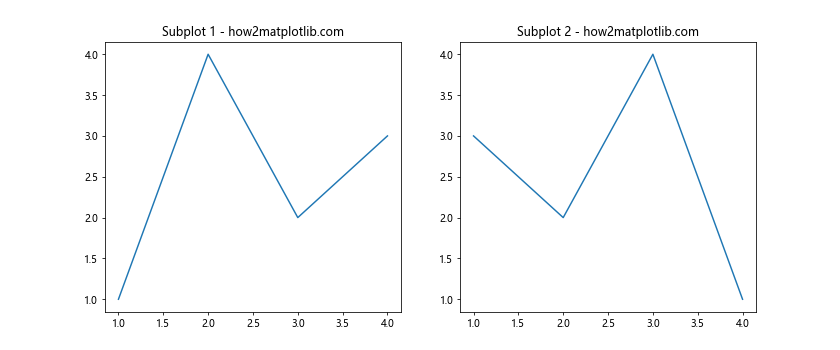
In this example, we use plt.subplots(1, 2, figsize=(12, 5)) to create a figure with two subplots side by side, with a total width of 12 inches and a height of 5 inches.
Adjusting Figure Size Dynamically
Sometimes, you may need to change the size of figures drawn with Matplotlib dynamically based on certain conditions or data. Here’s an example of how to do this:
import matplotlib.pyplot as plt
import numpy as np

def plot_with_dynamic_size(data):
    # Calculate figure size based on data length
    fig_width = max(6, len(data) * 0.5)
    fig_height = fig_width * 0.6

    # Create figure with dynamic size
    plt.figure(figsize=(fig_width, fig_height))

    # Plot the data
    plt.plot(data)
    plt.title(f"Dynamic Figure Size - how2matplotlib.com (Data Length: {len(data)})")
    plt.show()

# Example usage
data1 = np.random.randn(10)
data2 = np.random.randn(20)

plot_with_dynamic_size(data1)
plot_with_dynamic_size(data2)
In this example, we define a function plot_with_dynamic_size() that calculates the figure size based on the length of the input data. This allows for flexible figure sizes that adapt to the amount of data being plotted.
Changing Figure Size for Specific Plot Types
Different types of plots may require different figure sizes for optimal visualization. Let’s explore how to change the size of figures drawn with Matplotlib for specific plot types.
Changing Figure Size for Scatter Plots
Scatter plots often benefit from a square aspect ratio. Here’s how you can create a scatter plot with a custom figure size:
import matplotlib.pyplot as plt
import numpy as np

# Generate random data
x = np.random.randn(100)
y = np.random.randn(100)

# Create a square figure
plt.figure(figsize=(8, 8))

# Create scatter plot
plt.scatter(x, y)
plt.title("Scatter Plot with Custom Size - how2matplotlib.com")
plt.xlabel("X-axis")
plt.ylabel("Y-axis")
plt.show()
Output:
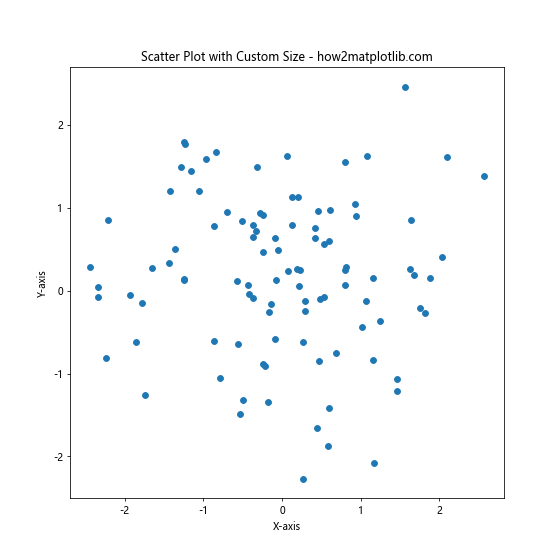
In this example, we use plt.figure(figsize=(8, 8)) to create a square figure with dimensions of 8×8 inches, which is suitable for a scatter plot.
Changing Figure Size for Bar Plots
Bar plots often require more horizontal space, especially when dealing with many categories. Here’s an example of how to change the size of figures drawn with Matplotlib for a bar plot:
import matplotlib.pyplot as plt

categories = ['Category A', 'Category B', 'Category C', 'Category D', 'Category E']
values = [23, 45, 56, 78, 32]

# Create a wide figure
plt.figure(figsize=(12, 6))

# Create bar plot
plt.bar(categories, values)
plt.title("Bar Plot with Custom Size - how2matplotlib.com")
plt.xlabel("Categories")
plt.ylabel("Values")
plt.show()
Output:
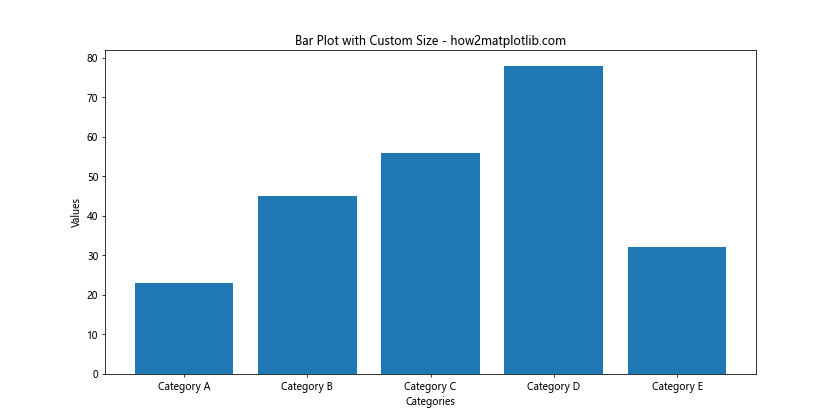
In this example, we use plt.figure(figsize=(12, 6)) to create a wide figure that accommodates the bar plot comfortably.
Advanced Techniques for Changing Figure Size
Let’s explore some advanced techniques for changing the size of figures drawn with Matplotlib.
Using Tight Layout
The tight_layout() function can automatically adjust the padding between plot elements. This can be useful when changing figure sizes:
import matplotlib.pyplot as plt
import numpy as np

# Generate some data
x = np.linspace(0, 10, 100)
y1 = np.sin(x)
y2 = np.cos(x)

# Create a figure with subplots
fig, (ax1, ax2) = plt.subplots(2, 1, figsize=(8, 10))

ax1.plot(x, y1)
ax1.set_title("Sine Wave - how2matplotlib.com")
ax1.set_xlabel("X-axis")
ax1.set_ylabel("Y-axis")

ax2.plot(x, y2)
ax2.set_title("Cosine Wave - how2matplotlib.com")
ax2.set_xlabel("X-axis")
ax2.set_ylabel("Y-axis")

# Apply tight layout
plt.tight_layout()

plt.show()
Output:
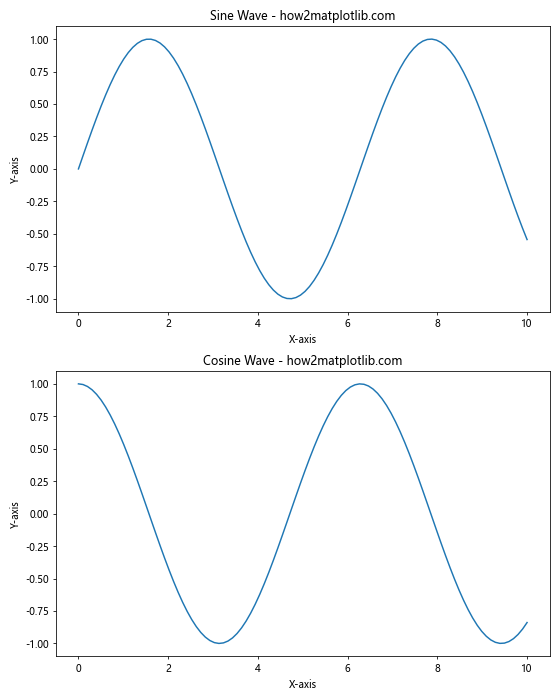
In this example, plt.tight_layout() is used to automatically adjust the spacing between subplots after changing the figure size.
Changing Figure Size with Object-Oriented Interface
Matplotlib’s object-oriented interface provides more control over figure properties. Here’s how to change figure size using this approach:
import matplotlib.pyplot as plt
import numpy as np

# Generate some data
x = np.linspace(0, 10, 100)
y = np.exp(x)

# Create a figure and axis objects
fig, ax = plt.subplots(figsize=(10, 6))

ax.plot(x, y)
ax.set_title("Exponential Function - how2matplotlib.com")
ax.set_xlabel("X-axis")
ax.set_ylabel("Y-axis")

# Adjust figure size after creation
fig.set_size_inches(12, 8)

plt.show()
Output:
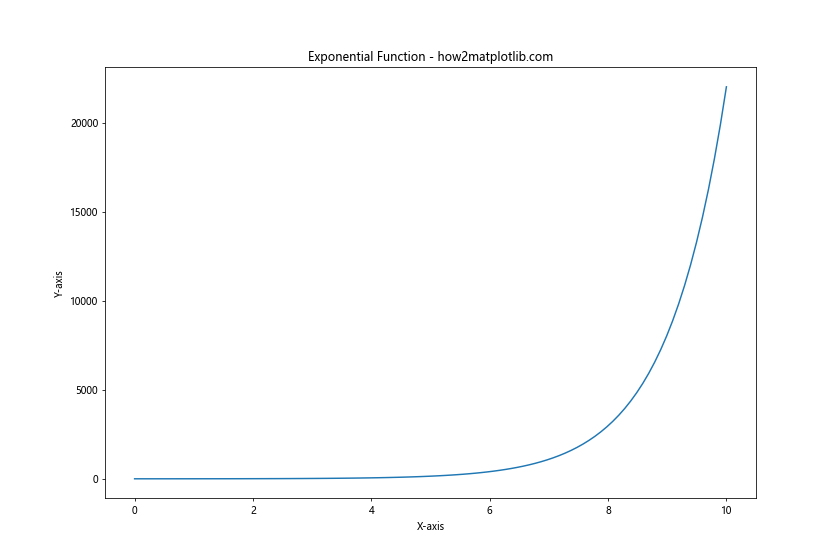
In this example, we use fig.set_size_inches(12, 8) to change the figure size after creating the plot.
Changing Figure Size for Different Screen Resolutions
When creating visualizations for different screen resolutions, you might need to adjust the figure size accordingly. Here’s an example of how to change the size of figures drawn with Matplotlib based on screen resolution:
import matplotlib.pyplot as plt
import numpy as np

def plot_for_resolution(dpi):
    # Calculate figure size based on DPI
    width_inches = 1920 / dpi
    height_inches = 1080 / dpi

    # Generate some data
    x = np.linspace(0, 10, 100)
    y = np.sin(x) * np.exp(-0.1 * x)

    # Create a figure with size adjusted for DPI
    fig, ax = plt.subplots(figsize=(width_inches, height_inches), dpi=dpi)

    ax.plot(x, y)
    ax.set_title(f"Plot for {dpi} DPI - how2matplotlib.com")
    ax.set_xlabel("X-axis")
    ax.set_ylabel("Y-axis")

    plt.show()

# Example usage
plot_for_resolution(96)  # Standard resolution
plot_for_resolution(192)  # High DPI (Retina) resolution
In this example, we define a function plot_for_resolution() that calculates the appropriate figure size based on the given DPI (dots per inch) value. This allows the plot to maintain a consistent physical size across different screen resolutions.
Changing Figure Size for Animation
When creating animations with Matplotlib, you might want to set a specific figure size for the entire animation. Here’s how you can do that:
import matplotlib.pyplot as plt
import matplotlib.animation as animation
import numpy as np

# Set up the figure and axis
fig, ax = plt.subplots(figsize=(10, 6))

# Generate initial data
x = np.linspace(0, 2 * np.pi, 100)
line, = ax.plot(x, np.sin(x))

# Animation update function
def update(frame):
    line.set_ydata(np.sin(x + frame / 10))
    return line,

# Create the animation
ani = animation.FuncAnimation(fig, update, frames=100, interval=50, blit=True)

ax.set_title("Animated Sine Wave - how2matplotlib.com")
ax.set_xlabel("X-axis")
ax.set_ylabel("Y-axis")

plt.show()
Output:
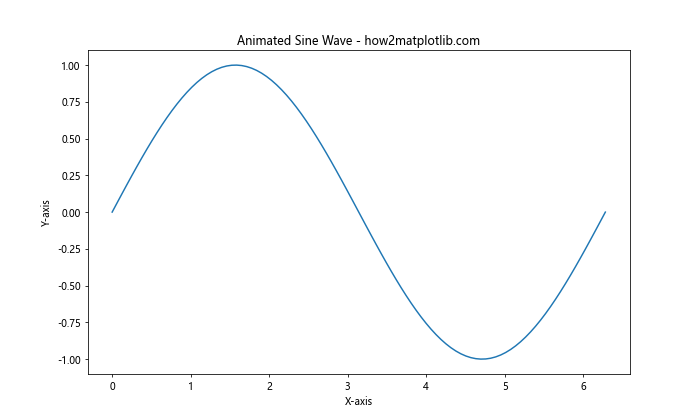
In this example, we set the figure size to 10×6 inches using plt.subplots(figsize=(10, 6)) when creating the figure for the animation.
Changing Figure Size for 3D Plots
Three-dimensional plots often require different figure sizes to ensure proper visibility of all elements. Here’s an example of how to change the size of figures drawn with Matplotlib for a 3D plot:
import matplotlib.pyplot as plt
import numpy as np
from mpl_toolkits.mplot3d import Axes3D

# Generate data for the 3D plot
x = np.linspace(-5, 5, 50)
y = np.linspace(-5, 5, 50)
X, Y = np.meshgrid(x, y)
Z = np.sin(np.sqrt(X**2 + Y**2))

## Create a figure with a larger size for 3D plot
fig = plt.figure(figsize=(12, 8))
ax = fig.add_subplot(111, projection='3d')

# Create the 3D surface plot
surf = ax.plot_surface(X, Y, Z, cmap='viridis')

ax.set_title("3D Surface Plot - how2matplotlib.com")
ax.set_xlabel("X-axis")
ax.set_ylabel("Y-axis")
ax.set_zlabel("Z-axis")

# Add a color bar
fig.colorbar(surf)

plt.show()
Output:
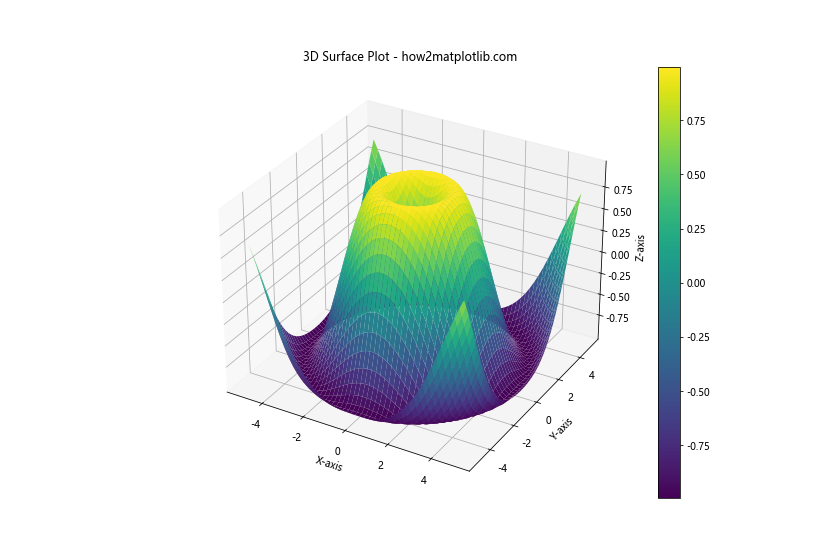
In this example, we use plt.figure(figsize=(12, 8)) to create a larger figure that can accommodate the 3D plot and its associated color bar.
Changing Figure Size for Multiple Plots in a Grid
When creating multiple plots arranged in a grid, you might want to adjust the overall figure size as well as the size of individual subplots. Here’s how you can change the size of figures drawn with Matplotlib for a grid of plots:
import matplotlib.pyplot as plt
import numpy as np

# Generate some data
x = np.linspace(0, 10, 100)
y1 = np.sin(x)
y2 = np.cos(x)
y3 = np.tan(x)
y4 = np.exp(x)

# Create a figure with a 2x2 grid of subplots
fig, axs = plt.subplots(2, 2, figsize=(12, 10))

# Plot data on each subplot
axs[0, 0].plot(x, y1)
axs[0, 0].set_title("Sine - how2matplotlib.com")

axs[0, 1].plot(x, y2)
axs[0, 1].set_title("Cosine - how2matplotlib.com")

axs[1, 0].plot(x, y3)
axs[1, 0].set_title("Tangent - how2matplotlib.com")

axs[1, 1].plot(x, y4)
axs[1, 1].set_title("Exponential - how2matplotlib.com")

# Adjust spacing between subplots
plt.tight_layout()

plt.show()
Output:
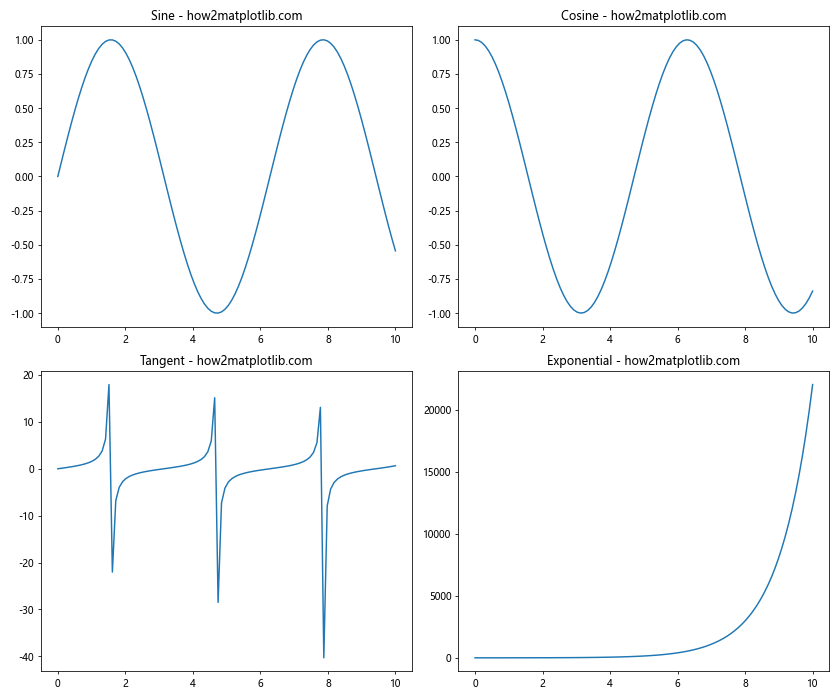
In this example, we use plt.subplots(2, 2, figsize=(12, 10)) to create a figure with a 2×2 grid of subplots and an overall size of 12×10 inches.
Changing Figure Size for Polar Plots
Polar plots often look best with a square aspect ratio. Here’s how to change the size of figures drawn with Matplotlib for a polar plot:
import matplotlib.pyplot as plt
import numpy as np

# Generate data for the polar plot
theta = np.linspace(0, 2*np.pi, 100)
r = np.cos(4*theta)

# Create a square figure for the polar plot
fig, ax = plt.subplots(figsize=(8, 8), subplot_kw=dict(projection='polar'))

# Create the polar plot
ax.plot(theta, r)
ax.set_title("Polar Plot - how2matplotlib.com")

plt.show()
Output:
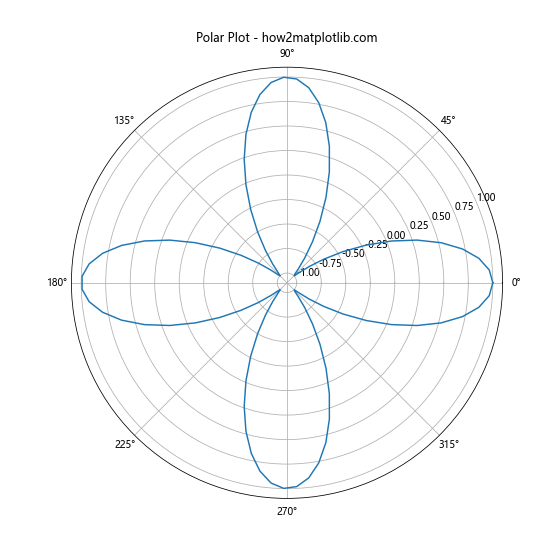
In this example, we use plt.subplots(figsize=(8, 8)) to create a square figure that’s suitable for a polar plot.
Changing Figure Size for Logarithmic Plots
Logarithmic plots may require different aspect ratios depending on the range of data. Here’s an example of how to change the size of figures drawn with Matplotlib for a logarithmic plot:
import matplotlib.pyplot as plt
import numpy as np

# Generate data for the logarithmic plot
x = np.logspace(0, 5, 100)
y = x**2

# Create a figure with a wider aspect ratio
fig, ax = plt.subplots(figsize=(12, 6))

# Create the logarithmic plot
ax.loglog(x, y)
ax.set_title("Logarithmic Plot - how2matplotlib.com")
ax.set_xlabel("X-axis (log scale)")
ax.set_ylabel("Y-axis (log scale)")

# Add a grid
ax.grid(True)

plt.show()
Output:
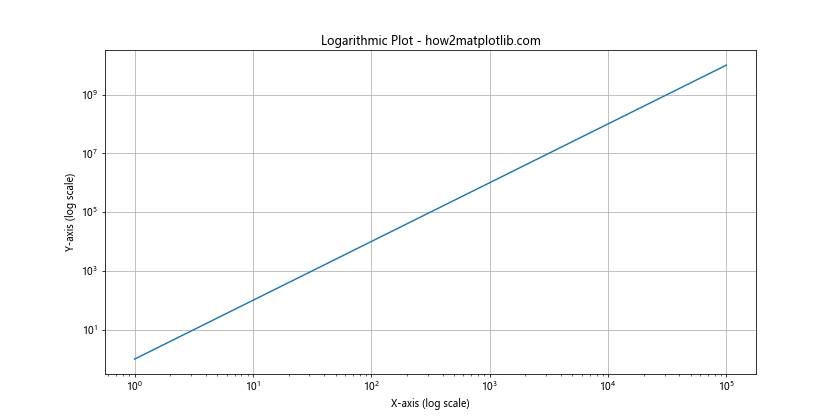
In this example, we use plt.subplots(figsize=(12, 6)) to create a wider figure that can accommodate the logarithmic scales on both axes.
Changing Figure Size for Heatmaps
Heatmaps often require square figures to ensure that each cell is represented equally. Here’s how to change the size of figures drawn with Matplotlib for a heatmap:
import matplotlib.pyplot as plt
import numpy as np

# Generate data for the heatmap
data = np.random.rand(10, 10)

# Create a square figure for the heatmap
fig, ax = plt.subplots(figsize=(10, 10))

# Create the heatmap
im = ax.imshow(data, cmap='viridis')

# Add a color bar
cbar = ax.figure.colorbar(im, ax=ax)

ax.set_title("Heatmap - how2matplotlib.com")
ax.set_xlabel("X-axis")
ax.set_ylabel("Y-axis")

plt.show()
Output:
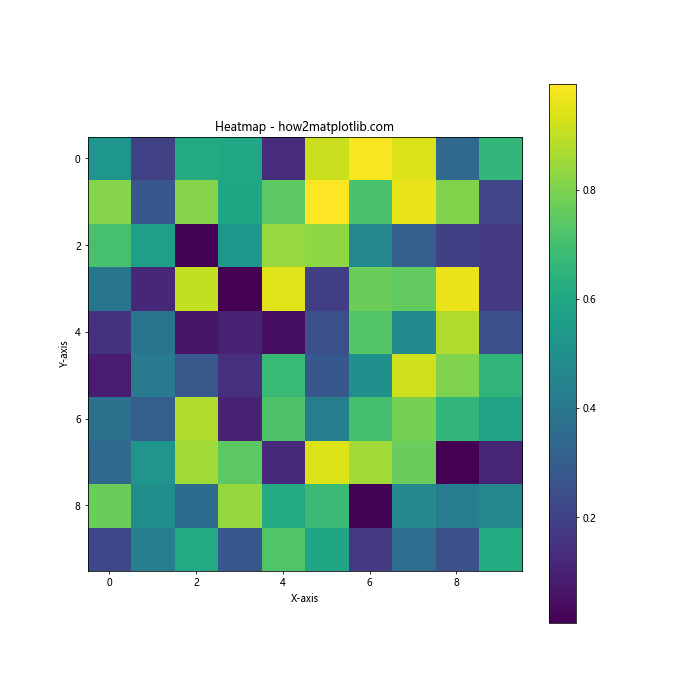
In this example, we use plt.subplots(figsize=(10, 10)) to create a square figure that’s suitable for a heatmap.
Conclusion
Changing the size of figures drawn with Matplotlib is a crucial skill for creating effective and visually appealing data visualizations. Throughout this comprehensive guide, we’ve explored various techniques to adjust figure sizes, including:
- Using
plt.figure()to set custom sizes - Modifying
rcParamsfor global figure size changes - Adjusting sizes for different plot types (scatter, bar, 3D, polar, etc.)
- Changing sizes for saved images and different output formats
- Implementing dynamic sizing based on data or screen resolution
- Utilizing advanced techniques like tight layout and the object-oriented interface
By mastering these methods, you’ll be able to create professional-looking plots that effectively communicate your data insights. Remember that the optimal figure size often depends on the specific data you’re visualizing, the plot type, and the intended display medium. Experiment with different sizes to find the best fit for your particular use case.