How to Change the Size of Axis Labels in Matplotlib
How to change the size of axis labels in Matplotlib is an essential skill for data visualization enthusiasts and professionals alike. Matplotlib, a powerful plotting library for Python, offers various ways to customize the appearance of your plots, including the size of axis labels. In this comprehensive guide, we’ll explore different methods to change the size of axis labels in Matplotlib, providing you with the knowledge and tools to create visually appealing and informative plots.
Understanding Axis Labels in Matplotlib
Before diving into how to change the size of axis labels in Matplotlib, it’s crucial to understand what axis labels are and their importance in data visualization. Axis labels provide context and meaning to your plots, helping viewers interpret the data correctly. In Matplotlib, axis labels typically refer to the text that describes the x-axis and y-axis of a plot.
Let’s start with a basic example to illustrate axis labels:
import matplotlib.pyplot as plt

# Create a simple plot
plt.plot([1, 2, 3, 4], [1, 4, 2, 3])

# Add axis labels
plt.xlabel('X-axis label - how2matplotlib.com')
plt.ylabel('Y-axis label - how2matplotlib.com')

# Display the plot
plt.show()
Output:
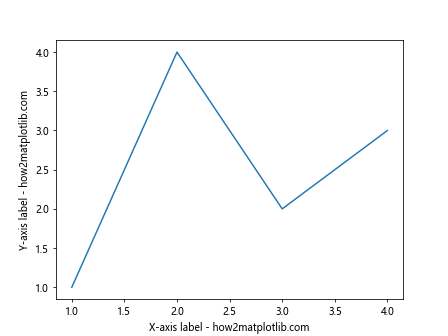
In this example, we’ve created a simple line plot and added labels to both the x-axis and y-axis. However, you might notice that the default size of these labels may not always be suitable for your specific needs. This is where knowing how to change the size of axis labels in Matplotlib becomes crucial.
Methods to Change the Size of Axis Labels in Matplotlib
Now that we understand the importance of axis labels, let’s explore various methods to change their size in Matplotlib. We’ll cover several approaches, each with its own advantages and use cases.
Method 1: Using plt.xlabel() and plt.ylabel() with fontsize Parameter
One of the simplest ways to change the size of axis labels in Matplotlib is by using the fontsize parameter in the plt.xlabel() and plt.ylabel() functions. This method allows you to set the font size directly when adding the labels.
Here’s an example of how to change the size of axis labels using this method:
import matplotlib.pyplot as plt

# Create a simple plot
plt.plot([1, 2, 3, 4], [1, 4, 2, 3])

# Add axis labels with custom font size
plt.xlabel('X-axis label - how2matplotlib.com', fontsize=16)
plt.ylabel('Y-axis label - how2matplotlib.com', fontsize=16)

# Display the plot
plt.show()
Output:
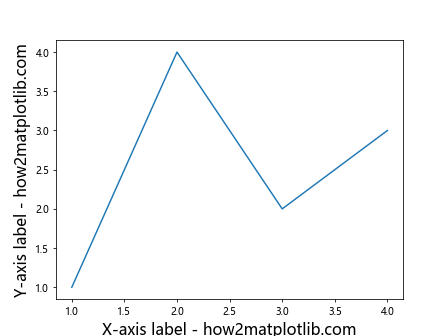
In this example, we’ve set the fontsize parameter to 16 for both the x-axis and y-axis labels. You can adjust this value to make the labels larger or smaller according to your preferences.
Method 2: Using plt.tick_params() to Change Axis Label Size
Another approach to change the size of axis labels in Matplotlib is by using the plt.tick_params() function. This method allows you to modify various properties of the tick marks and labels, including their size.
Here’s an example of how to change the size of axis labels using plt.tick_params():
import matplotlib.pyplot as plt

# Create a simple plot
plt.plot([1, 2, 3, 4], [1, 4, 2, 3])

# Add axis labels
plt.xlabel('X-axis label - how2matplotlib.com')
plt.ylabel('Y-axis label - how2matplotlib.com')

# Change the size of axis labels
plt.tick_params(axis='both', which='major', labelsize=14)

# Display the plot
plt.show()
Output:
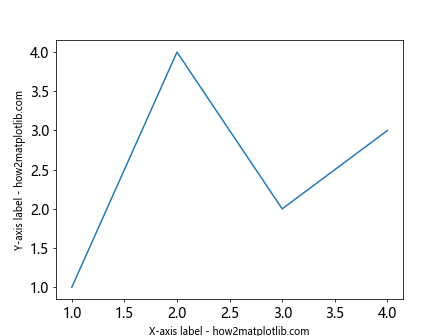
In this example, we’ve used plt.tick_params() to set the labelsize to 14 for both axes. The axis='both' parameter ensures that the changes apply to both the x-axis and y-axis, while which='major' specifies that we’re modifying the major tick labels.
Method 3: Using ax.set_xlabel() and ax.set_ylabel() in Object-Oriented Interface
Matplotlib offers an object-oriented interface that provides more fine-grained control over plot elements. When using this approach, you can change the size of axis labels using the set_xlabel() and set_ylabel() methods of the axes object.
Here’s an example of how to change the size of axis labels using the object-oriented interface:
import matplotlib.pyplot as plt

# Create a figure and axis objects
fig, ax = plt.subplots()

# Plot data
ax.plot([1, 2, 3, 4], [1, 4, 2, 3])

# Set axis labels with custom font size
ax.set_xlabel('X-axis label - how2matplotlib.com', fontsize=18)
ax.set_ylabel('Y-axis label - how2matplotlib.com', fontsize=18)

# Display the plot
plt.show()
Output:
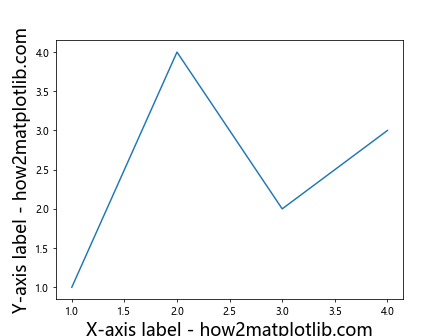
In this example, we’ve created a figure and axis object using plt.subplots(). We then use the set_xlabel() and set_ylabel() methods of the axis object to set the labels and their font size.
Method 4: Using rcParams to Set Default Font Size
If you want to change the size of axis labels globally for all plots in your script or notebook, you can use Matplotlib’s rcParams to set the default font size. This approach is particularly useful when you want to maintain consistency across multiple plots.
Here’s an example of how to change the size of axis labels using rcParams:
import matplotlib.pyplot as plt

# Set the default font size for axis labels
plt.rcParams['axes.labelsize'] = 16

# Create a simple plot
plt.plot([1, 2, 3, 4], [1, 4, 2, 3])

# Add axis labels
plt.xlabel('X-axis label - how2matplotlib.com')
plt.ylabel('Y-axis label - how2matplotlib.com')

# Display the plot
plt.show()
Output:
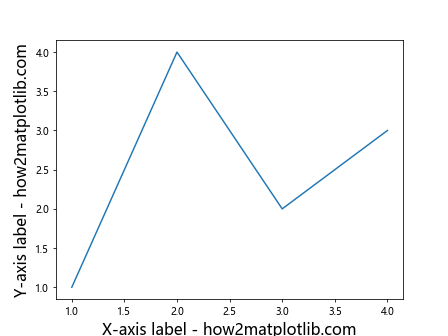
In this example, we’ve set the default font size for axis labels to 16 using plt.rcParams['axes.labelsize']. This setting will apply to all subsequent plots in your script or notebook.
Method 5: Using setp() to Change Multiple Properties at Once
The setp() function in Matplotlib allows you to set multiple properties of plot elements at once. This can be particularly useful when you want to change the size of axis labels along with other properties.
Here’s an example of how to change the size of axis labels using setp():
import matplotlib.pyplot as plt

# Create a figure and axis objects
fig, ax = plt.subplots()

# Plot data
ax.plot([1, 2, 3, 4], [1, 4, 2, 3])

# Set axis labels
ax.set_xlabel('X-axis label - how2matplotlib.com')
ax.set_ylabel('Y-axis label - how2matplotlib.com')

# Change the size and other properties of axis labels
plt.setp(ax.get_xticklabels(), fontsize=14, color='blue')
plt.setp(ax.get_yticklabels(), fontsize=14, color='red')

# Display the plot
plt.show()
Output:
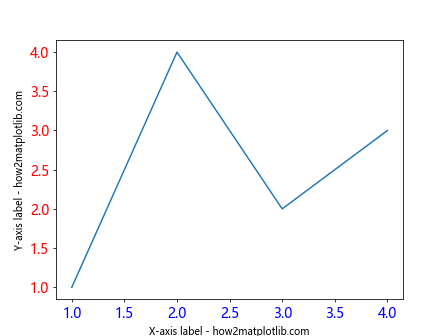
In this example, we’ve used plt.setp() to change the font size and color of the x-axis and y-axis tick labels. This method provides a concise way to modify multiple properties simultaneously.
Advanced Techniques for Changing Axis Label Size
Now that we’ve covered the basic methods to change the size of axis labels in Matplotlib, let’s explore some advanced techniques that offer even more control and flexibility.
Using Different Sizes for X-axis and Y-axis Labels
Sometimes, you may want to use different sizes for the x-axis and y-axis labels. This can be easily achieved by specifying different font sizes for each axis.
Here’s an example of how to set different sizes for x-axis and y-axis labels:
import matplotlib.pyplot as plt

# Create a figure and axis objects
fig, ax = plt.subplots()

# Plot data
ax.plot([1, 2, 3, 4], [1, 4, 2, 3])

# Set axis labels with different font sizes
ax.set_xlabel('X-axis label - how2matplotlib.com', fontsize=16)
ax.set_ylabel('Y-axis label - how2matplotlib.com', fontsize=20)

# Display the plot
plt.show()
Output:
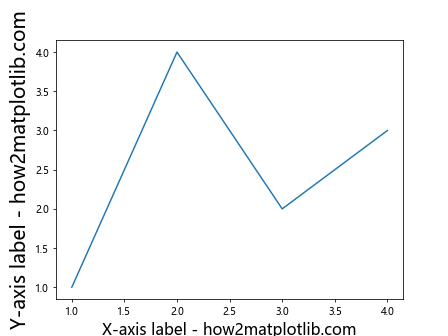
In this example, we’ve set the font size of the x-axis label to 16 and the y-axis label to 20, creating a visual hierarchy between the two labels.
Changing Axis Label Size in Subplots
When working with multiple subplots, you may want to change the size of axis labels for each subplot individually. This can be achieved by accessing the axes objects of each subplot.
Here’s an example of how to change the size of axis labels in subplots:
import matplotlib.pyplot as plt

# Create a figure with 2x2 subplots
fig, axs = plt.subplots(2, 2, figsize=(10, 10))

# Flatten the 2D array of axes for easier iteration
axs = axs.flatten()

# Plot data and set labels for each subplot
for i, ax in enumerate(axs):
    ax.plot([1, 2, 3, 4], [1, 4, 2, 3])
    ax.set_xlabel(f'X-axis {i+1} - how2matplotlib.com', fontsize=12)
    ax.set_ylabel(f'Y-axis {i+1} - how2matplotlib.com', fontsize=12)

# Adjust the layout and display the plot
plt.tight_layout()
plt.show()
Output:
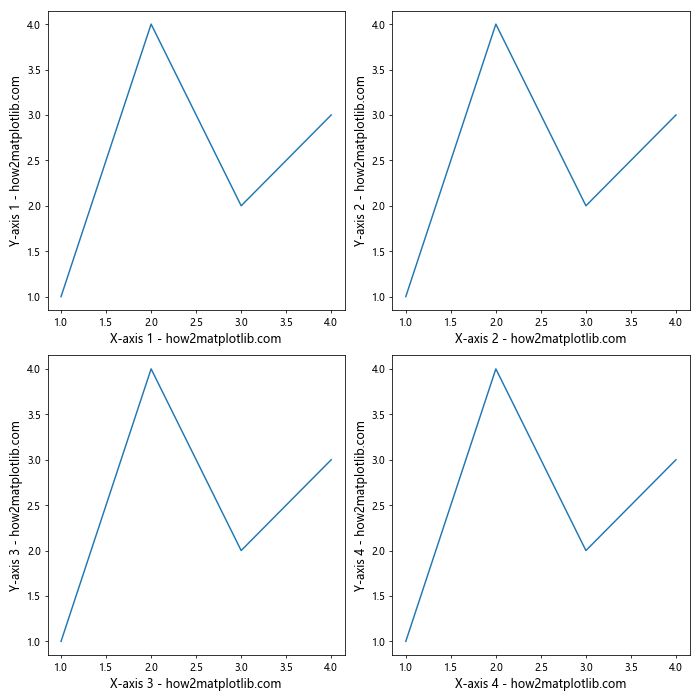
In this example, we’ve created a 2×2 grid of subplots and set the font size of axis labels for each subplot individually.
Changing Axis Label Size in 3D Plots
Matplotlib also supports 3D plotting, and you can change the size of axis labels in 3D plots using similar methods as with 2D plots.
Here’s an example of how to change the size of axis labels in a 3D plot:
import matplotlib.pyplot as plt
from mpl_toolkits.mplot3d import Axes3D
import numpy as np

# Create a figure and 3D axis
fig = plt.figure()
ax = fig.add_subplot(111, projection='3d')

# Generate some sample data
x = np.linspace(-5, 5, 100)
y = np.linspace(-5, 5, 100)
X, Y = np.meshgrid(x, y)
Z = np.sin(np.sqrt(X**2 + Y**2))

# Create a surface plot
surf = ax.plot_surface(X, Y, Z)

# Set axis labels with custom font size
ax.set_xlabel('X-axis - how2matplotlib.com', fontsize=14)
ax.set_ylabel('Y-axis - how2matplotlib.com', fontsize=14)
ax.set_zlabel('Z-axis - how2matplotlib.com', fontsize=14)

# Display the plot
plt.show()
Output:
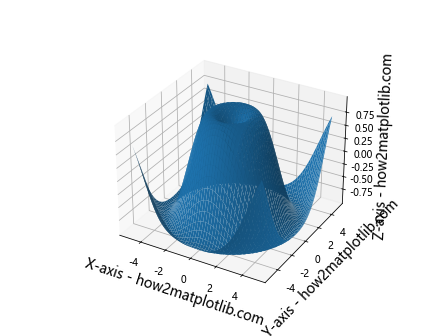
In this example, we’ve created a 3D surface plot and set the font size of all three axis labels to 14.
Best Practices for Changing Axis Label Size
When changing the size of axis labels in Matplotlib, it’s important to follow some best practices to ensure your plots are both visually appealing and informative. Here are some tips to keep in mind:
- Consistency: Try to maintain consistent font sizes across similar types of plots in your project or presentation.
Readability: Ensure that the axis labels are large enough to be easily read, especially when the plot is scaled down or viewed from a distance.
Balance: Strike a balance between the size of axis labels and other plot elements, such as the title, legend, and data points.
Context: Consider the context in which your plot will be viewed (e.g., printed report, presentation slide, or web page) when choosing the appropriate font size.
Hierarchy: Use different font sizes to create a visual hierarchy, emphasizing the most important information.
Let’s apply these best practices in an example: