How to Change the Font Size of the Title in a Matplotlib Figure
How to change the font size of the title in a Matplotlib figure is an essential skill for data visualization enthusiasts and professionals alike. This article will delve deep into the various methods and techniques to adjust the font size of titles in Matplotlib figures, providing you with a comprehensive understanding of this crucial aspect of data visualization.
Understanding the Importance of Title Font Size in Matplotlib Figures
Before we dive into the specifics of how to change the font size of the title in a Matplotlib figure, it’s essential to understand why this skill is so important. The title of a figure is often the first thing that catches a viewer’s eye, and its font size plays a crucial role in how effectively it communicates the main message of your visualization.
When you know how to change the font size of the title in a Matplotlib figure, you can:
- Emphasize important information
- Create visual hierarchy
- Improve readability
- Maintain consistency across multiple figures
- Adapt to different display sizes and resolutions
Now that we understand the importance, let’s explore the various methods to change the font size of the title in a Matplotlib figure.
Basic Method: Using the fontsize Parameter
The most straightforward way to change the font size of the title in a Matplotlib figure is by using the fontsize parameter when setting the title. Here’s a simple example:
import matplotlib.pyplot as plt

plt.figure(figsize=(10, 6))
plt.plot([1, 2, 3, 4], [1, 4, 2, 3])
plt.title("How to change the font size of the Title in a Matplotlib figure - how2matplotlib.com", fontsize=16)
plt.show()
Output:
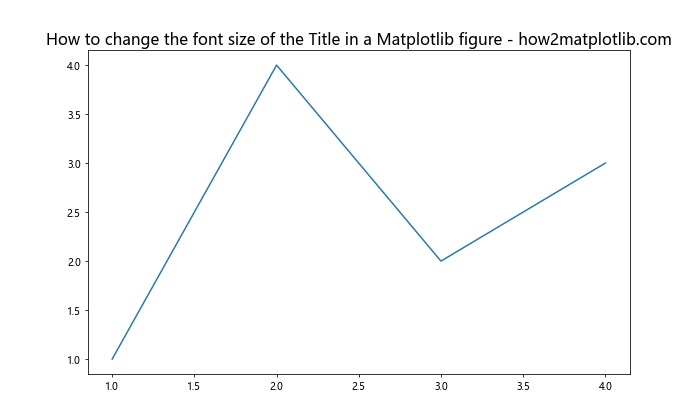
In this example, we’ve set the font size of the title to 16 points. The fontsize parameter allows you to specify the size of the font in points. You can adjust this value to make the title larger or smaller as needed.
Using plt.rcParams to Change Default Font Size
If you want to change the font size of the title for all figures in your script, you can modify the default settings using plt.rcParams. Here’s how to change the font size of the title in a Matplotlib figure using this method:
import matplotlib.pyplot as plt

plt.rcParams['axes.titlesize'] = 20

plt.figure(figsize=(10, 6))
plt.plot([1, 2, 3, 4], [1, 4, 2, 3])
plt.title("How to change the font size of the Title in a Matplotlib figure - how2matplotlib.com")
plt.show()
Output:
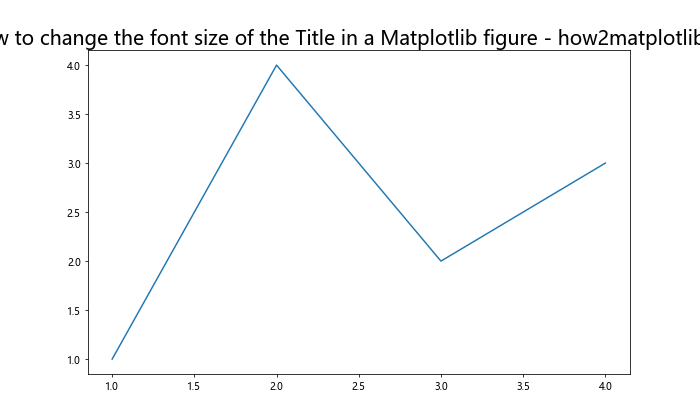
In this example, we’ve set the default title font size to 20 points for all figures. This is particularly useful when you’re creating multiple figures and want to maintain consistency in title font sizes.
Changing Font Size with set_title() Method
Another way to change the font size of the title in a Matplotlib figure is by using the set_title() method of the axes object. This method provides more flexibility and allows you to change other properties of the title as well. Here’s an example:
import matplotlib.pyplot as plt

fig, ax = plt.subplots(figsize=(10, 6))
ax.plot([1, 2, 3, 4], [1, 4, 2, 3])
ax.set_title("How to change the font size of the Title in a Matplotlib figure - how2matplotlib.com", fontsize=18)
plt.show()
Output:
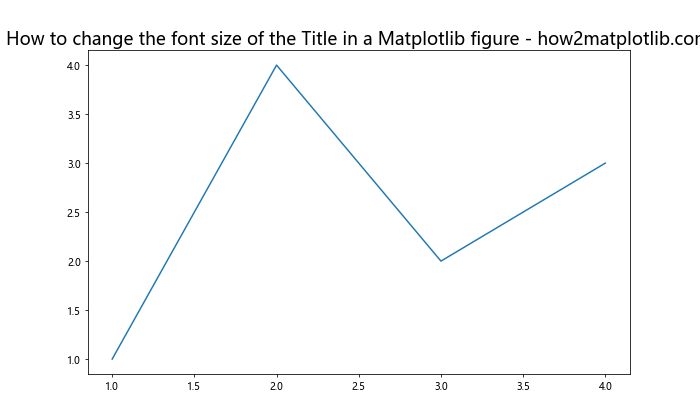
In this example, we’ve used the set_title() method to set the title and its font size. This method is particularly useful when you’re working with subplots or want to have more control over individual axes.
Adjusting Font Size Dynamically Based on Figure Size
Sometimes, you might want to adjust the font size of the title dynamically based on the size of the figure. This can be useful when creating responsive visualizations. Here’s how to change the font size of the title in a Matplotlib figure dynamically:
import matplotlib.pyplot as plt

def adjust_title_fontsize(fig, ax, base_fontsize=12):
    fig_width = fig.get_figwidth()
    title_fontsize = base_fontsize * (fig_width / 6.4)  # 6.4 is the default figure width
    ax.set_title("How to change the font size of the Title in a Matplotlib figure - how2matplotlib.com", fontsize=title_fontsize)

fig, ax = plt.subplots(figsize=(12, 6))
ax.plot([1, 2, 3, 4], [1, 4, 2, 3])
adjust_title_fontsize(fig, ax)
plt.show()
Output:
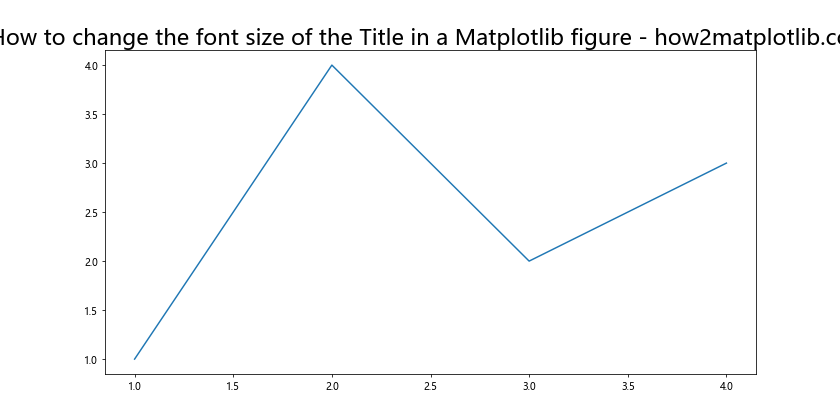
In this example, we’ve created a function that adjusts the font size based on the figure width. This ensures that the title remains proportional to the figure size, maintaining readability across different display sizes.
Changing Font Size for Specific Words in the Title
Sometimes, you might want to emphasize certain words in your title by changing their font size. Here’s how to change the font size of specific words in the title of a Matplotlib figure:
import matplotlib.pyplot as plt

fig, ax = plt.subplots(figsize=(10, 6))
ax.plot([1, 2, 3, 4], [1, 4, 2, 3])
ax.set_title("How to change the \n font size of the Title in a Matplotlib figure - how2matplotlib.com", fontsize=14)
ax.title.set_fontsize(18)
ax.title.get_children()[0].set_fontsize(24)
plt.show()
In this example, we’ve set different font sizes for different parts of the title. The first line of the title will have a font size of 24, while the rest will have a font size of 18.
Adjusting Title Font Size in Subplots
When working with subplots, you might want to change the font size of titles for individual subplots as well as the overall figure title. Here’s how to change the font size of titles in a Matplotlib figure with subplots:
import matplotlib.pyplot as plt

fig, (ax1, ax2) = plt.subplots(1, 2, figsize=(12, 6))
ax1.plot([1, 2, 3, 4], [1, 4, 2, 3])
ax2.plot([1, 2, 3, 4], [3, 2, 4, 1])

ax1.set_title("Subplot 1 - how2matplotlib.com", fontsize=14)
ax2.set_title("Subplot 2 - how2matplotlib.com", fontsize=14)

fig.suptitle("How to change the font size of the Title in a Matplotlib figure", fontsize=18)
plt.show()
Output:
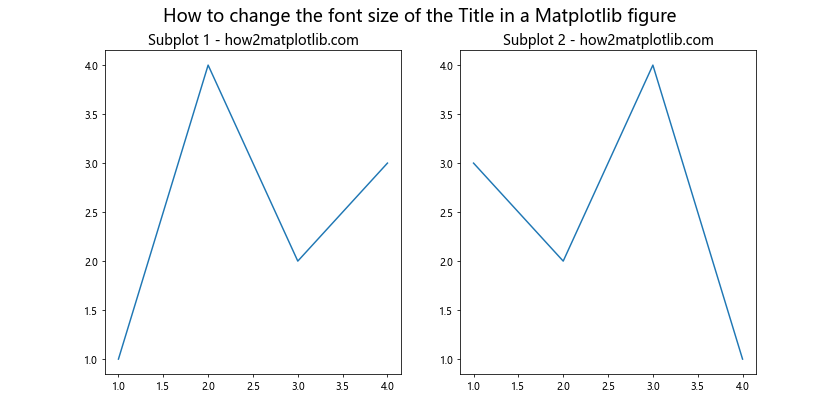
In this example, we’ve set different font sizes for the subplot titles and the overall figure title. This allows for a clear hierarchy of information in your visualization.
Using Style Sheets to Change Title Font Size
Matplotlib provides style sheets that can help you quickly change the appearance of your plots, including the font size of titles. Here’s how to change the font size of the title in a Matplotlib figure using a style sheet:
import matplotlib.pyplot as plt

plt.style.use('seaborn-poster')

plt.figure(figsize=(10, 6))
plt.plot([1, 2, 3, 4], [1, 4, 2, 3])
plt.title("How to change the font size of the Title in a Matplotlib figure - how2matplotlib.com")
plt.show()
In this example, we’ve used the ‘seaborn-poster’ style, which automatically sets larger font sizes for titles and other text elements. You can experiment with different style sheets to find one that suits your needs.
Changing Title Font Size in 3D Plots
When working with 3D plots in Matplotlib, changing the font size of the title follows a similar process. Here’s how to change the font size of the title in a 3D Matplotlib figure:
import matplotlib.pyplot as plt
from mpl_toolkits.mplot3d import Axes3D
import numpy as np

fig = plt.figure(figsize=(10, 6))
ax = fig.add_subplot(111, projection='3d')

x = np.random.standard_normal(100)
y = np.random.standard_normal(100)
z = np.random.standard_normal(100)
ax.scatter(x, y, z)

ax.set_title("How to change the font size of the Title in a 3D Matplotlib figure - how2matplotlib.com", fontsize=16)
plt.show()
Output:
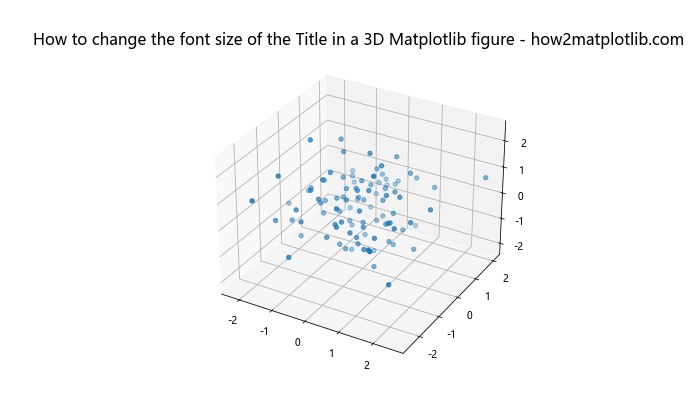
In this example, we’ve created a 3D scatter plot and set the title font size using the fontsize parameter in the set_title() method.
Adjusting Title Font Size for Different Output Formats
When saving your Matplotlib figures to different output formats, you might need to adjust the title font size to ensure readability. Here’s how to change the font size of the title in a Matplotlib figure for different output formats:
import matplotlib.pyplot as plt

def create_plot(dpi):
    fig, ax = plt.subplots(figsize=(10, 6), dpi=dpi)
    ax.plot([1, 2, 3, 4], [1, 4, 2, 3])
    fontsize = int(16 * (dpi / 100))  # Adjust font size based on DPI
    ax.set_title(f"How to change the font size of the Title in a Matplotlib figure - how2matplotlib.com (DPI: {dpi})", fontsize=fontsize)
    return fig

# For screen display
fig_screen = create_plot(100)
plt.show()

# For print (higher DPI)
fig_print = create_plot(300)
fig_print.savefig('high_dpi_plot.png', dpi=300)
Output:
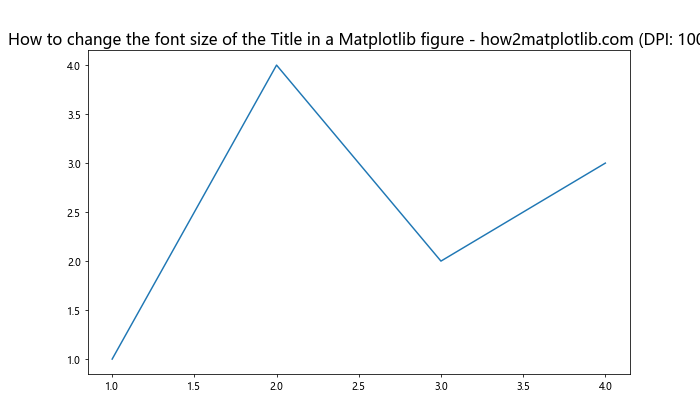
In this example, we’ve created a function that adjusts the title font size based on the DPI (dots per inch) of the output. This ensures that the title remains readable whether you’re displaying the figure on screen or saving it for high-quality print output.
Using Font Properties to Change Title Font Size
For more fine-grained control over the title font, you can use font properties. This method allows you to change not just the font size, but also other attributes like weight, style, and family. Here’s how to change the font size of the title in a Matplotlib figure using font properties:
import matplotlib.pyplot as plt
from matplotlib.font_manager import FontProperties

fig, ax = plt.subplots(figsize=(10, 6))
ax.plot([1, 2, 3, 4], [1, 4, 2, 3])

font = FontProperties()
font.set_family('serif')
font.set_name('Times New Roman')
font.set_size(18)
font.set_weight('bold')

ax.set_title("How to change the font size of the Title in a Matplotlib figure - how2matplotlib.com", fontproperties=font)
plt.show()
Output:
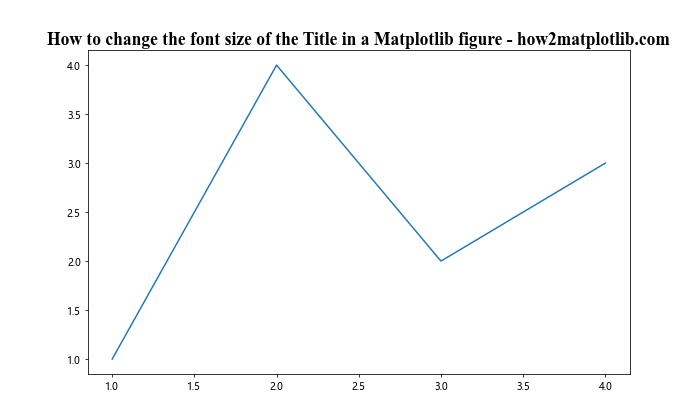
In this example, we’ve created a FontProperties object to set various attributes of the title font, including its size. This method gives you the most control over the appearance of your title.
Changing Title Font Size in Animations
When creating animations with Matplotlib, you might want to change the font size of the title dynamically. Here’s how to change the font size of the title in a Matplotlib figure animation:
import matplotlib.pyplot as plt
import matplotlib.animation as animation
import numpy as np

fig, ax = plt.subplots(figsize=(10, 6))
x = np.linspace(0, 2*np.pi, 100)
line, = ax.plot(x, np.sin(x))

def animate(i):
    line.set_ydata(np.sin(x + i/10))
    ax.set_title(f"Frame {i}: How to change the font size of the Title in a Matplotlib figure - how2matplotlib.com", fontsize=12+i/5)
    return line,

ani = animation.FuncAnimation(fig, animate, frames=100, interval=50, blit=True)
plt.show()
Output:
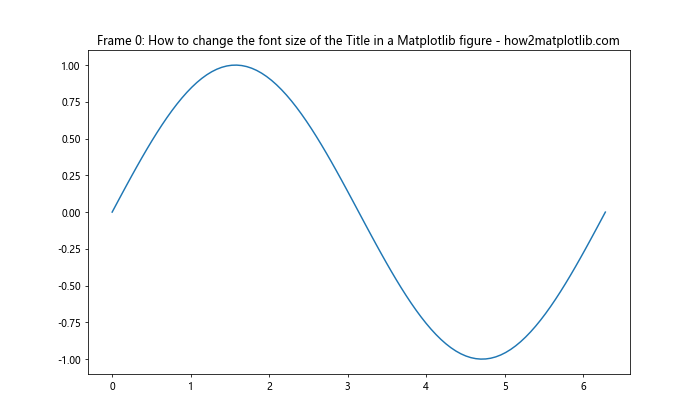
In this example, we’ve created an animation where the title font size increases with each frame. This demonstrates how you can dynamically change the title font size in animations.
Adjusting Title Font Size for Different Screen Resolutions
When creating visualizations that will be viewed on different devices with varying screen resolutions, it’s important to adjust the title font size accordingly. Here’s how to change the font size of the title in a Matplotlib figure based on screen resolution:
import matplotlib.pyplot as plt
import tkinter as tk

def get_screen_resolution():
    root = tk.Tk()
    screen_width = root.winfo_screenwidth()
    screen_height = root.winfo_screenheight()
    root.destroy()
    return screen_width, screen_height

screen_width, screen_height = get_screen_resolution()
base_fontsize = 12
adjusted_fontsize = base_fontsize * (screen_width / 1920)  # 1920 is a reference width

fig, ax = plt.subplots(figsize=(10, 6))
ax.plot([1, 2, 3, 4], [1, 4, 2, 3])
ax.set_title(f"How to change the font size of the Title in a Matplotlib figure - how2matplotlib.com\nScreen Resolution: {screen_width}x{screen_height}", fontsize=adjusted_fontsize)
plt.show()
Output:
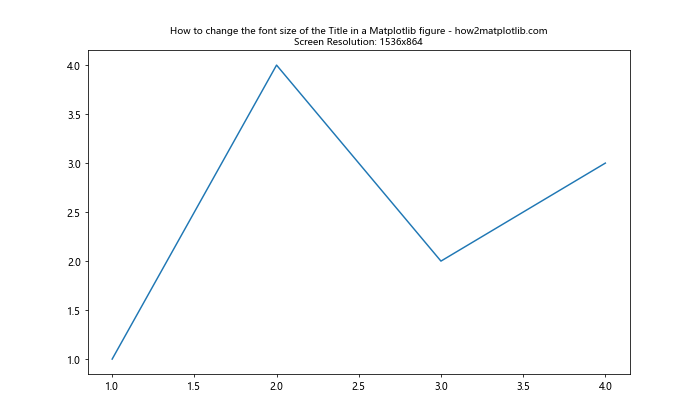
In this example, we’ve created a function to get the screen resolution and adjust the title font size accordingly. This ensures that the title remains readable across different screen sizes and resolutions.
Using HTML-like Tags for Title Formatting
Matplotlib also supports HTML-like tags for text formatting, which can be used to change the font size of the title. Here’s how to change the font size of the title in a Matplotlib figure using HTML-like tags:
import matplotlib.pyplot as plt

fig, ax = plt.subplots(figsize=(10, 6))
ax.plot([1, 2, 3, 4], [1, 4, 2, 3])
ax.set_title("How to change the font size of the Title in a Matplotlib figure - how2matplotlib.com")
plt.rcParams['axes.titlesize'] = 14  # Set a base font size
plt.show()
Output:
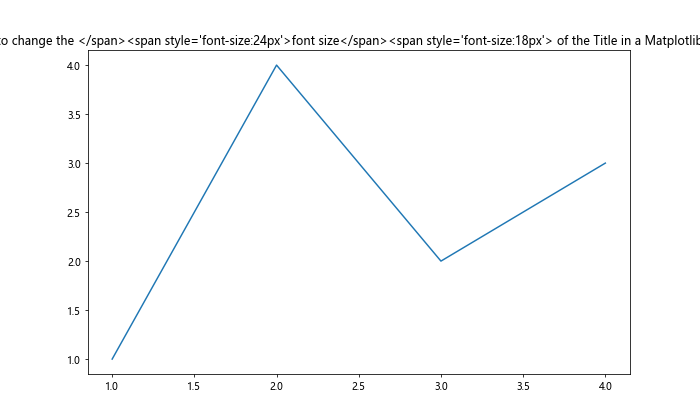
In this example, we’ve used HTML-like tags to set different font sizes for different parts of the title. This method allows for very fine-grained control over the appearance of your title.
Changing Title Font Size in Seaborn Plots
If you’re using Seaborn, which is built on top of Matplotlib, you can still change the font size of the title. Here’s how to change the font size of the title in a Seaborn plot:
import matplotlib.pyplot as plt
import seaborn as sns

sns.set(style="whitegrid")
tips = sns.load_dataset("tips")

plt.figure(figsize=(10, 6))
sns.scatterplot(x="total_bill", y="tip", data=tips)
plt.title("How to change the font size of the Title in a Seaborn plot - how2matplotlib.com", fontsize=18)
plt.show()
Output:
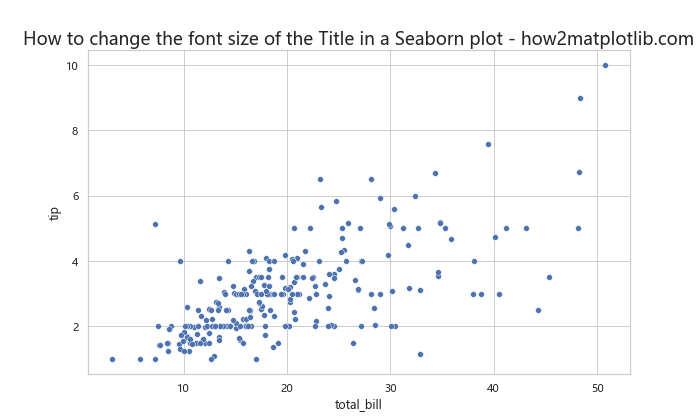
In this example, we’ve created a Seaborn scatter plot and used Matplotlib’s title() function to set the title and its font size. This demonstrates that even when using Seaborn, you can still leverage Matplotlib’s title formatting capabilities.
Using Title Font Size to Create Visual Hierarchy
The font size of your title can be used to create a visual hierarchy in your plots, especially when you have multiple levels of information. Here’s how to change the font size of the title in a Matplotlib figure to create a visual hierarchy:
import matplotlib.pyplot as plt

fig, (ax1, ax2) = plt.subplots(2, 1, figsize=(10, 8))

ax1.plot([1, 2, 3, 4], [1, 4, 2, 3])
ax2.plot([1, 2, 3, 4], [3, 2, 4, 1])

ax1.set_title("Subplot 1 - how2matplotlib.com", fontsize=14)
ax2.set_title("Subplot 2 - how2matplotlib.com", fontsize=14)

fig.suptitle("How to change the font size of the Title in a Matplotlib figure", fontsize=20)

plt.tight_layout()
plt.subplots_adjust(top=0.9)
plt.show()
Output:
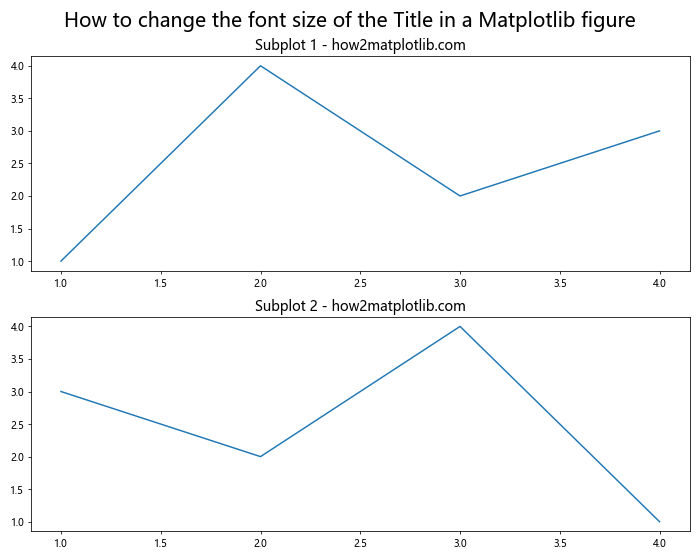
In this example, we’ve used different font sizes for the main title and subplot titles to create a clear visual hierarchy. The main title has a larger font size, making it stand out as the most important piece of information.
Changing Title Font Size in Polar Plots
Polar plots in Matplotlib require a slightly different approach when it comes to changing the title font size. Here’s how to change the font size of the title in a Matplotlib polar plot:
import matplotlib.pyplot as plt
import numpy as np

r = np.arange(0, 2, 0.01)
theta = 2 * np.pi * r

fig, ax = plt.subplots(subplot_kw=dict(projection='polar'), figsize=(8, 8))
ax.plot(theta, r)
ax.set_title("How to change the font size of the Title in a Matplotlib polar plot - how2matplotlib.com", fontsize=14, pad=20)
plt.show()
Output:
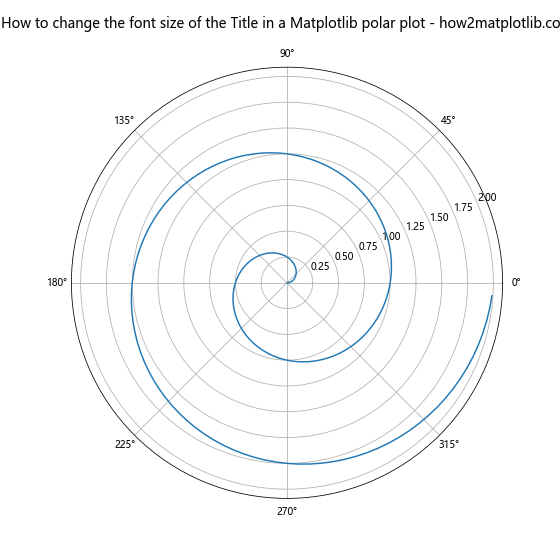
In this example, we’ve created a polar plot and set its title font size. Note the use of the pad parameter in set_title(), which adjusts the space between the title and the plot. This can be particularly useful in polar plots where the title might overlap with the plot itself.
Adjusting Title Font Size for Publication-Quality Figures
When preparing figures for publication, it’s crucial to ensure that your title font size meets the journal’s requirements. Here’s how to change the font size of the title in a Matplotlib figure for publication-quality output:
import matplotlib.pyplot as plt
from matplotlib import rcParams

# Set up figure parameters for publication
rcParams['font.family'] = 'serif'
rcParams['font.serif'] = ['Times New Roman']
rcParams['font.size'] = 10
rcParams['axes.labelsize'] = 12
rcParams['axes.titlesize'] = 14
rcParams['figure.titlesize'] = 16

fig, ax = plt.subplots(figsize=(6, 4))  # Common figure size for publications
ax.plot([1, 2, 3, 4], [1, 4, 2, 3])
ax.set_xlabel('X-axis')
ax.set_ylabel('Y-axis')
ax.set_title("How to change the font size of the Title in a Matplotlib figure - how2matplotlib.com")

fig.tight_layout()
plt.savefig('publication_figure.pdf', dpi=300, bbox_inches='tight')
plt.show()
Output:
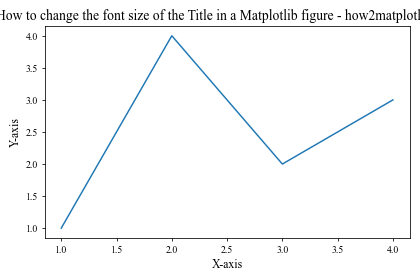
In this example, we’ve set up the figure parameters to meet common publication standards. We’ve used a serif font (Times New Roman) and set appropriate font sizes for the title, axis labels, and tick labels. The figure is then saved as a high-resolution PDF file, which is often required for publication.
Using Title Font Size to Emphasize Important Information
The font size of your title can be used to emphasize important information or key findings in your visualization. Here’s how to change the font size of the title in a Matplotlib figure to highlight important information:
import matplotlib.pyplot as plt

fig, ax = plt.subplots(figsize=(10, 6))
ax.plot([1, 2, 3, 4], [1, 4, 2, 3])

title = ax.set_title("How to change the font size of the Title in a Matplotlib figure\n", fontsize=16)
subtitle = ax.text(0.5, 1.05, "Key Finding: Font size matters! - how2matplotlib.com",
                   ha='center', va='center', transform=ax.transAxes, fontsize=20, color='red')

plt.tight_layout()
plt.show()
Output:
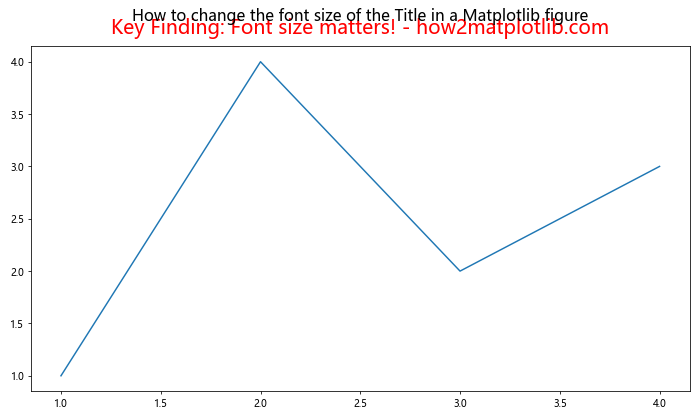
In this example, we’ve used a larger font size and a different color for the subtitle to emphasize the key finding. This technique can be particularly effective when you want to draw attention to specific aspects of your visualization.
Conclusion: Mastering Title Font Size in Matplotlib
Throughout this comprehensive guide, we’ve explored numerous techniques for how to change the font size of the title in a Matplotlib figure. From basic methods like using the fontsize parameter to more advanced techniques like using LaTeX formatting and HTML-like tags, we’ve covered a wide range of approaches to suit different needs and scenarios.
Remember, the key to effective data visualization is not just in the data itself, but in how you present it. The font size of your title plays a crucial role in this presentation, helping to guide the viewer’s attention and convey the importance of your visualization.