How to Change Order of Items in Matplotlib Legend
How to Change Order of Items in Matplotlib Legend is an essential skill for data visualization enthusiasts and professionals alike. Matplotlib, a powerful plotting library in Python, offers various ways to customize legends, including changing the order of items. This article will delve deep into the techniques and best practices for manipulating legend item order in Matplotlib, providing you with the knowledge to create more informative and visually appealing plots.
Understanding the Importance of Legend Order in Matplotlib
Before we dive into the specifics of how to change order of items in Matplotlib legend, it’s crucial to understand why legend order matters. The order of items in a legend can significantly impact the readability and interpretation of your plots. A well-organized legend can guide the viewer’s eye and help them quickly understand the relationship between different data series.
Consider a scenario where you’re plotting multiple data series with varying importance or chronological order. In such cases, knowing how to change order of items in Matplotlib legend becomes invaluable. You might want to highlight certain data series by placing them at the top of the legend or arrange items in a specific order to tell a story through your visualization.
Let’s start with a simple example to illustrate the default legend behavior in Matplotlib:
import matplotlib.pyplot as plt

plt.figure(figsize=(10, 6))
plt.plot([1, 2, 3, 4], [1, 4, 2, 3], label='Data from how2matplotlib.com')
plt.plot([1, 2, 3, 4], [2, 3, 4, 1], label='Another dataset')
plt.plot([1, 2, 3, 4], [4, 1, 3, 2], label='Third series')
plt.legend()
plt.title('Default Legend Order in Matplotlib')
plt.show()
Output:
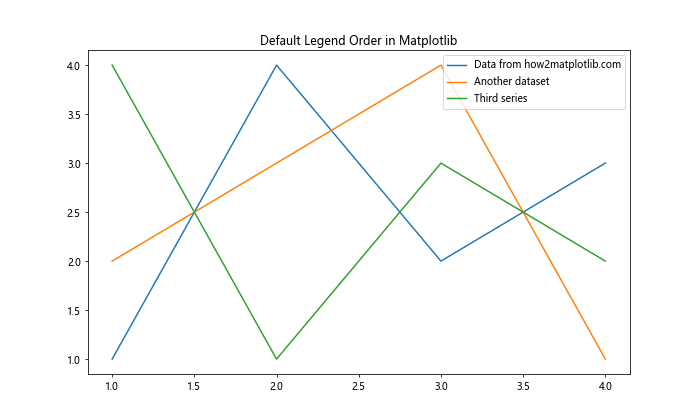
In this example, the legend items appear in the order they were added to the plot. However, as we’ll see in the following sections, there are various ways to change this order to suit your specific needs.
Basic Techniques to Change Order of Items in Matplotlib Legend
Now that we understand the importance of legend order, let’s explore some basic techniques to change order of items in Matplotlib legend. These methods are straightforward and can be applied to most simple plotting scenarios.
1. Reordering Plot Commands
One of the simplest ways to change order of items in Matplotlib legend is to reorder the plot commands themselves. Matplotlib creates the legend based on the order in which elements are added to the plot. Here’s an example:
import matplotlib.pyplot as plt

plt.figure(figsize=(10, 6))
plt.plot([1, 2, 3, 4], [4, 1, 3, 2], label='Third series from how2matplotlib.com')
plt.plot([1, 2, 3, 4], [2, 3, 4, 1], label='Another dataset')
plt.plot([1, 2, 3, 4], [1, 4, 2, 3], label='Data from how2matplotlib.com')
plt.legend()
plt.title('Reordered Legend Items')
plt.show()
Output:
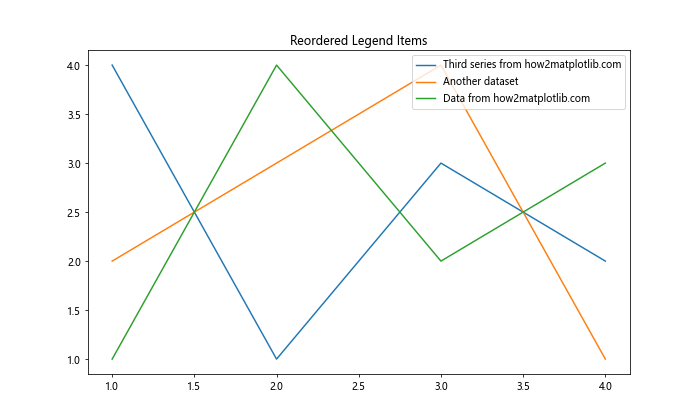
In this example, we’ve simply changed the order of the plt.plot() commands to achieve a different legend order. This method is effective for simple plots but may become cumbersome for more complex visualizations.
2. Using the reverse Parameter
Matplotlib provides a convenient reverse parameter in the legend() function that allows you to reverse the order of items in the legend. This can be particularly useful when you want to invert the current order without manually reordering your plot commands:
import matplotlib.pyplot as plt

plt.figure(figsize=(10, 6))
plt.plot([1, 2, 3, 4], [1, 4, 2, 3], label='Data from how2matplotlib.com')
plt.plot([1, 2, 3, 4], [2, 3, 4, 1], label='Another dataset')
plt.plot([1, 2, 3, 4], [4, 1, 3, 2], label='Third series')
plt.legend(reverse=True)
plt.title('Reversed Legend Order')
plt.show()
Output:
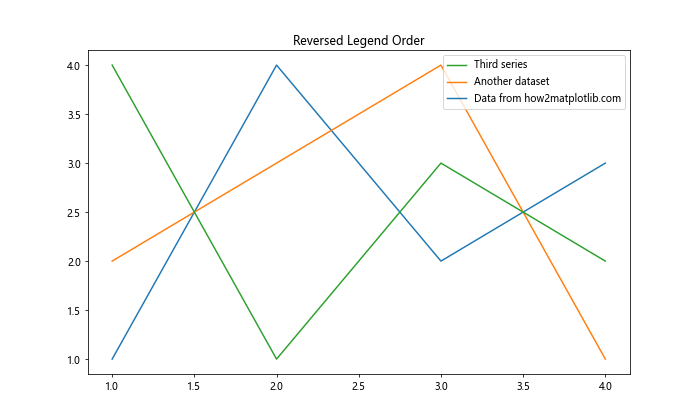
This code snippet demonstrates how to use the reverse=True parameter to invert the legend order. It’s a quick and easy way to change order of items in Matplotlib legend without modifying your plotting code.
Advanced Techniques to Change Order of Items in Matplotlib Legend
While the basic techniques are sufficient for many use cases, there are more advanced methods to change order of items in Matplotlib legend. These techniques offer greater flexibility and control over legend item ordering.
1. Using handles and labels
One of the most powerful ways to change order of items in Matplotlib legend is by explicitly specifying the handles and labels when creating the legend. This method gives you complete control over the order and content of your legend:
import matplotlib.pyplot as plt

fig, ax = plt.subplots(figsize=(10, 6))

line1, = ax.plot([1, 2, 3, 4], [1, 4, 2, 3], label='Data from how2matplotlib.com')
line2, = ax.plot([1, 2, 3, 4], [2, 3, 4, 1], label='Another dataset')
line3, = ax.plot([1, 2, 3, 4], [4, 1, 3, 2], label='Third series')

handles = [line3, line1, line2]
labels = [line.get_label() for line in handles]

ax.legend(handles, labels)
ax.set_title('Custom Legend Order Using Handles and Labels')
plt.show()
Output:
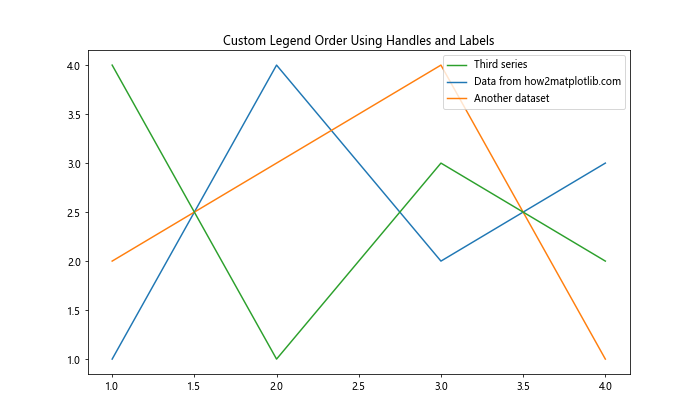
In this example, we create a list of handles in the desired order and extract their corresponding labels. We then pass these to the legend() function to create a custom-ordered legend.
2. Sorting Legend Items
Sometimes, you may want to sort legend items based on certain criteria, such as alphabetical order or data values. Here’s an example of how to change order of items in Matplotlib legend by sorting alphabetically:
import matplotlib.pyplot as plt

fig, ax = plt.subplots(figsize=(10, 6))

ax.plot([1, 2, 3, 4], [1, 4, 2, 3], label='Data from how2matplotlib.com')
ax.plot([1, 2, 3, 4], [2, 3, 4, 1], label='Another dataset')
ax.plot([1, 2, 3, 4], [4, 1, 3, 2], label='Third series')

handles, labels = ax.get_legend_handles_labels()
sorted_pairs = sorted(zip(labels, handles))
sorted_labels, sorted_handles = zip(*sorted_pairs)

ax.legend(sorted_handles, sorted_labels)
ax.set_title('Alphabetically Sorted Legend Items')
plt.show()
Output:
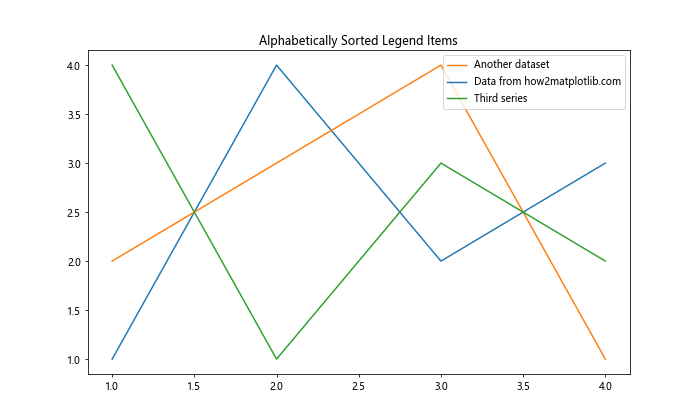
This code snippet demonstrates how to sort legend items alphabetically by their labels. You can modify the sorting criteria to suit your specific needs.
Customizing Legend Appearance While Changing Order
When learning how to change order of items in Matplotlib legend, it’s also important to consider the overall appearance of your legend. Matplotlib offers various options to customize legend appearance alongside ordering.
1. Changing Legend Location
You can specify the location of your legend while changing its order. Matplotlib provides several predefined locations, or you can use custom coordinates:
import matplotlib.pyplot as plt

fig, ax = plt.subplots(figsize=(10, 6))

ax.plot([1, 2, 3, 4], [1, 4, 2, 3], label='Data from how2matplotlib.com')
ax.plot([1, 2, 3, 4], [2, 3, 4, 1], label='Another dataset')
ax.plot([1, 2, 3, 4], [4, 1, 3, 2], label='Third series')

handles, labels = ax.get_legend_handles_labels()
ax.legend(handles[::-1], labels[::-1], loc='upper left')
ax.set_title('Reversed Legend Order with Custom Location')
plt.show()
Output:
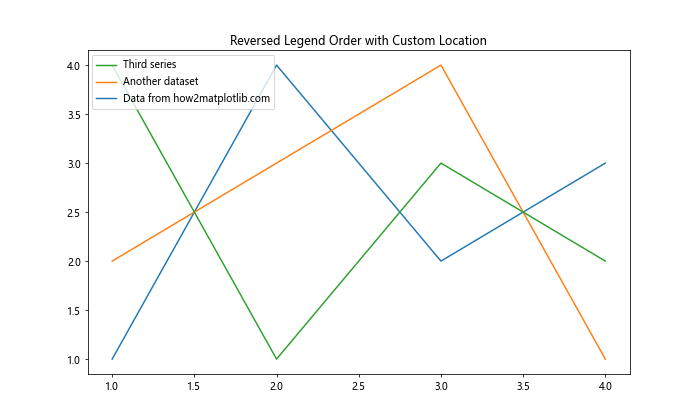
In this example, we reverse the order of the legend items and place the legend in the upper left corner of the plot.
2. Adjusting Legend Style
You can also modify the style of your legend while changing its order. This includes adjusting the number of columns, font size, and other visual properties:
import matplotlib.pyplot as plt

fig, ax = plt.subplots(figsize=(10, 6))

ax.plot([1, 2, 3, 4], [1, 4, 2, 3], label='Data from how2matplotlib.com')
ax.plot([1, 2, 3, 4], [2, 3, 4, 1], label='Another dataset')
ax.plot([1, 2, 3, 4], [4, 1, 3, 2], label='Third series')

handles, labels = ax.get_legend_handles_labels()
ax.legend(handles[::-1], labels[::-1], ncol=2, fontsize='small', title='Legend Title')
ax.set_title('Customized Legend Style with Changed Order')
plt.show()
Output:
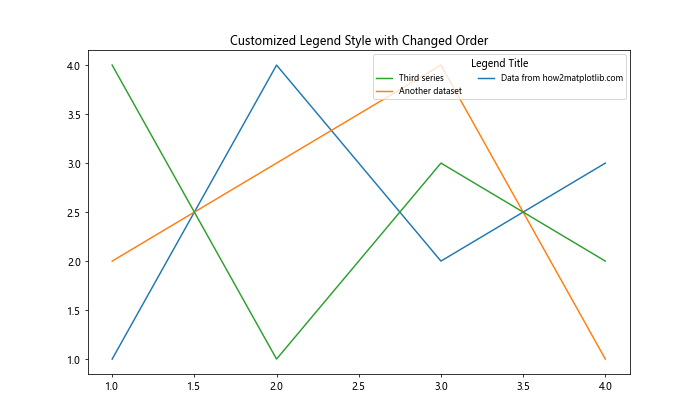
This code snippet demonstrates how to create a two-column legend with reversed order, smaller font size, and a title.
Handling Complex Plots and Multiple Legends
As your plots become more complex, you may need more advanced techniques to change order of items in Matplotlib legend. This section covers strategies for managing legend order in plots with multiple data series and subplots.
1. Managing Legend Order in Subplots
When working with subplots, you might want to create a single legend for all subplots with a custom order. Here’s how you can achieve this:
import matplotlib.pyplot as plt

fig, (ax1, ax2) = plt.subplots(1, 2, figsize=(12, 5))

line1, = ax1.plot([1, 2, 3, 4], [1, 4, 2, 3], label='Data from how2matplotlib.com')
line2, = ax1.plot([1, 2, 3, 4], [2, 3, 4, 1], label='Another dataset')
line3, = ax2.plot([1, 2, 3, 4], [4, 1, 3, 2], label='Third series')

handles = [line3, line1, line2]
labels = [h.get_label() for h in handles]

fig.legend(handles, labels, loc='upper center', bbox_to_anchor=(0.5, 1.05), ncol=3)
fig.suptitle('Custom Legend Order for Multiple Subplots')
plt.tight_layout()
plt.show()
Output:
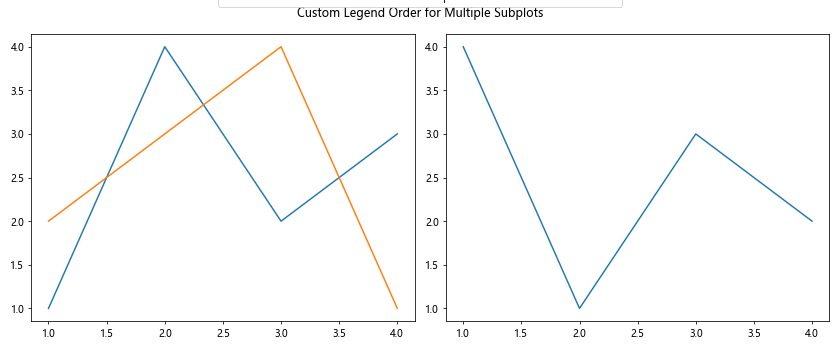
This example demonstrates how to create a single legend for multiple subplots with a custom order of items.
2. Handling Overlapping Legends
In some cases, you may have overlapping legends that need to be ordered separately. Here’s an approach to handle this situation:
import matplotlib.pyplot as plt

fig, ax = plt.subplots(figsize=(10, 6))

line1, = ax.plot([1, 2, 3, 4], [1, 4, 2, 3], label='Data from how2matplotlib.com')
line2, = ax.plot([1, 2, 3, 4], [2, 3, 4, 1], label='Another dataset')
line3, = ax.plot([1, 2, 3, 4], [4, 1, 3, 2], label='Third series')

legend1 = ax.legend([line2, line1], ['Another dataset', 'Data from how2matplotlib.com'], loc='upper left')
ax.add_artist(legend1)
ax.legend([line3], ['Third series'], loc='lower right')

ax.set_title('Multiple Legends with Custom Order')
plt.show()
Output:
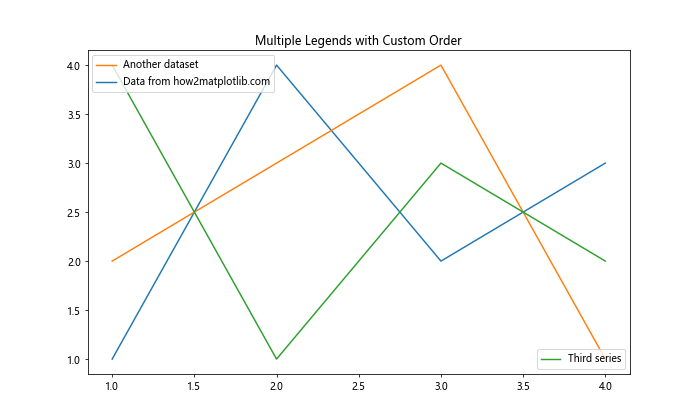
This code snippet shows how to create multiple legends with custom orders on the same plot.
Programmatically Changing Legend Order
In some scenarios, you may need to change order of items in Matplotlib legend programmatically based on certain conditions or data properties. This section explores techniques for dynamic legend ordering.
1. Ordering Legend Items Based on Data Values
You might want to order legend items based on the values in your data. Here’s an example of how to achieve this:
import matplotlib.pyplot as plt
import numpy as np

fig, ax = plt.subplots(figsize=(10, 6))

data = {
    'Series A': np.random.rand(10),
    'Series B': np.random.rand(10),
    'Series C': np.random.rand(10),
    'Data from how2matplotlib.com': np.random.rand(10)
}

for label, values in data.items():
    ax.plot(values, label=label)

handles, labels = ax.get_legend_handles_labels()
sorted_pairs = sorted(zip(handles, labels), key=lambda x: x[0].get_ydata()[-1], reverse=True)
sorted_handles, sorted_labels = zip(*sorted_pairs)

ax.legend(sorted_handles, sorted_labels)
ax.set_title('Legend Items Ordered by Final Data Point')
plt.show()
Output:
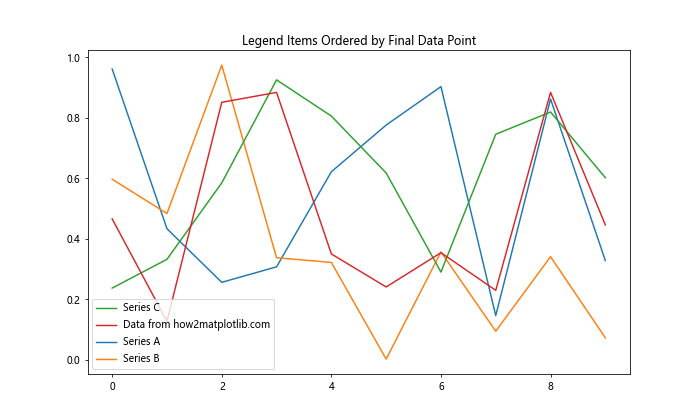
This example orders the legend items based on the final value of each data series.
Best Practices for Changing Legend Order in Matplotlib
As we’ve explored various techniques to change order of items in Matplotlib legend, it’s important to keep in mind some best practices to ensure your plots are effective and easy to understand.
1. Consistency Across Multiple Plots
When creating multiple plots for a single analysis or report, it’s crucial to maintain consistency in legend order. This helps viewers quickly understand and compare different plots. Consider creating a function to handle legend ordering:
import matplotlib.pyplot as plt

def plot_with_ordered_legend(data, order=None):
    fig, ax = plt.subplots(figsize=(10, 6))

    for label, values in data.items():
        ax.plot(values, label=label)

    handles, labels = ax.get_legend_handles_labels()

    if order is None:
        order = range(len(handles))

    ax.legend([handles[i] for i in order], [labels[i] for i in order])
    ax.set_title('Plot with Consistent Legend Order')
    plt.show()

# Example usage
data1 = {
    'Data from how2matplotlib.com': [1, 4, 2, 3],
    'Another dataset': [2, 3, 4, 1],
    'Third series': [4, 1, 3, 2]
}

data2 = {
    'Data from how2matplotlib.com': [3, 1, 4, 2],
    'Another dataset': [1, 3, 2, 4],
    'Third series': [2, 4, 1, 3]
}

order = [2, 0, 1]  # Specify the desired order

plot_with_ordered_legend(data1, order)
plot_with_ordered_legend(data2, order)
This example demonstrates how to create a reusable function that maintains consistent legend order across multiple plots.
2. Balancing Aesthetics and Information
When changing the order of items in a Matplotlib legend, it’s important to strike a balance between aesthetics and information delivery. Consider the following tips:
- Place the most important or frequently referenced items at the top of the legend.
- Group related items together in the legend.
- Use color and style to reinforce the order and grouping of legend items.
Here’s an example that implements these principles:
import matplotlib.pyplot as plt

fig, ax = plt.subplots(figsize=(10, 6))

important = ax.plot([1, 2, 3, 4], [4, 1, 3, 2], 'r-', linewidth=2, label='Important Data from how2matplotlib.com')
related1 = ax.plot([1, 2, 3, 4], [1, 4, 2, 3], 'b--', label='Related Series 1')
related2 = ax.plot([1, 2, 3, 4], [2, 3, 1, 4], 'b:', label='Related Series 2')
other = ax.plot([1, 2, 3, 4], [3, 2, 4, 1], 'g-.', label='Other Data')

handles, labels = ax.get_legend_handles_labels()
order = [0, 1, 2, 3]  # Specify the desired order
ax.legend([handles[i] for i in order], [labels[i] for i in order])

ax.set_title('Balanced Legend Order and Styling')
plt.show()
Output:
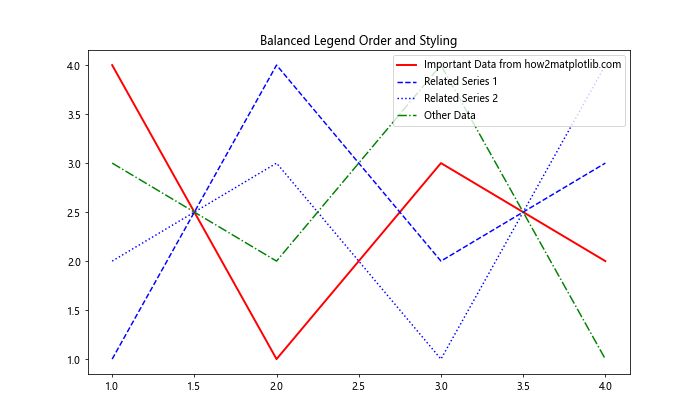
This example demonstrates how to order legend items based on importance and group related items together, while using color and line style to reinforce these relationships.
Troubleshooting Common Issues When Changing Legend Order
Even with a good understanding of how to change order of items in Matplotlib legend, you may encounter some common issues. Let’s address these problems and their solutions.
1. Legend Items Not Appearing in the Desired Order
If you’ve specified a custom order for your legend items but they’re not appearing as expected, double-check that you’re correctly matching handles and labels. Here’s an example of how to debug this issue:
import matplotlib.pyplot as plt

fig, ax = plt.subplots(figsize=(10, 6))

line1 = ax.plot([1, 2, 3, 4], [1, 4, 2, 3], label='Data from how2matplotlib.com')
line2 = ax.plot([1, 2, 3, 4], [2, 3, 4, 1], label='Another dataset')
line3 = ax.plot([1, 2, 3, 4], [4, 1, 3, 2], label='Third series')

handles, labels = ax.get_legend_handles_labels()

print("Handles:", handles)
print("Labels:", labels)

desired_order = [2, 0, 1]
ax.legend([handles[i] for i in desired_order], [labels[i] for i in desired_order])

ax.set_title('Debugging Legend Order')
plt.show()
Output:
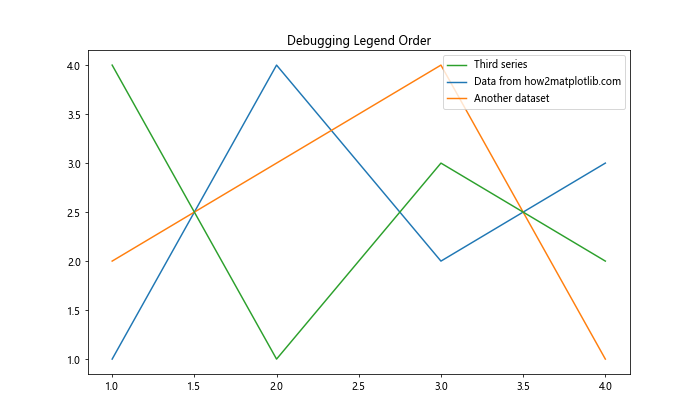
By printing out the handles and labels, you can verify that you’re using the correct indices in your desired order.
2. Legend Order Changing Unexpectedly
If you find that your legend order is changing unexpectedly, it might be due to subsequent plotting commands or legend calls. To prevent this, you can use the ax.add_artist() method to preserve your custom legend:
import matplotlib.pyplot as plt

fig, ax = plt.subplots(figsize=(10, 6))

ax.plot([1, 2, 3, 4], [1, 4, 2, 3], label='Data from how2matplotlib.com')
ax.plot([1, 2, 3, 4], [2, 3, 4, 1], label='Another dataset')
ax.plot([1, 2, 3, 4], [4, 1, 3, 2], label='Third series')

handles, labels = ax.get_legend_handles_labels()
custom_legend = ax.legend([handles[2], handles[0], handles[1]],
                          [labels[2], labels[0], labels[1]])
ax.add_artist(custom_legend)

# Additional plotting that won't affect the legend order
ax.plot([1, 2, 3, 4], [3, 3, 3, 3], 'k--')

ax.set_title('Preserving Custom Legend Order')
plt.show()
Output:
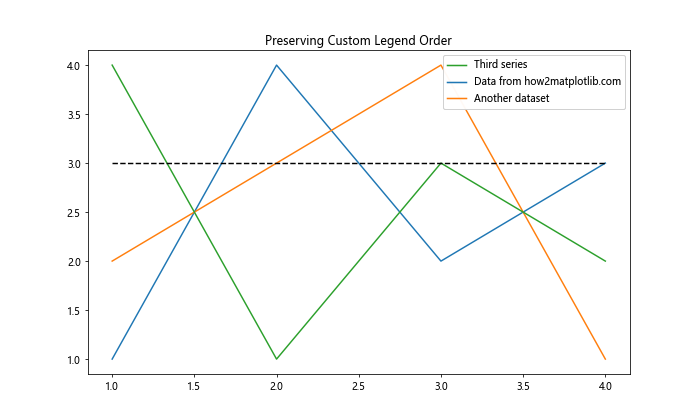
This example demonstrates how to preserve a custom legend order even when additional plotting commands are executed.
Advanced Legend Ordering Techniques
For more complex visualizations, you might need to employ advanced techniques to change order of items in Matplotlib legend. Let’s explore some of these methods.
1. Using a Proxy Artist for Legend Ordering
In some cases, you might want to create a legend that doesn’t directly correspond to the plotted data. You can use proxy artists to achieve this:
import matplotlib.pyplot as plt
import matplotlib.patches as mpatches

fig, ax = plt.subplots(figsize=(10, 6))

ax.plot([1, 2, 3, 4], [1, 4, 2, 3], 'r-')
ax.plot([1, 2, 3, 4], [2, 3, 4, 1], 'b--')
ax.plot([1, 2, 3, 4], [4, 1, 3, 2], 'g:')

red_patch = mpatches.Patch(color='red', label='Data from how2matplotlib.com')
blue_patch = mpatches.Patch(color='blue', label='Another dataset')
green_patch = mpatches.Patch(color='green', label='Third series')

ax.legend(handles=[green_patch, red_patch, blue_patch])

ax.set_title('Legend Ordering with Proxy Artists')
plt.show()
Output:
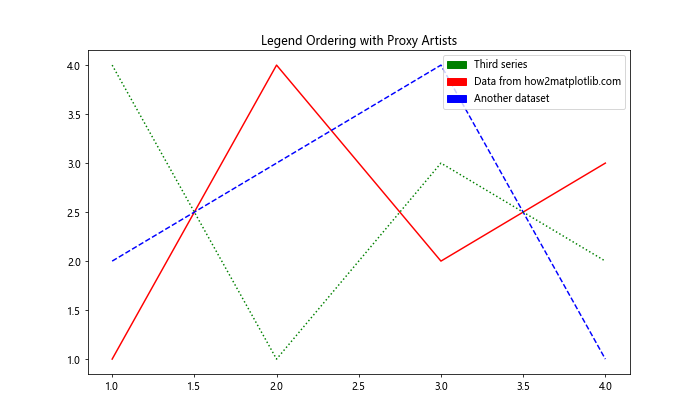
This example uses Patch objects as proxy artists to create a custom-ordered legend that doesn’t depend on the order of plotting commands.
2. Dynamic Legend Ordering Based on Data Properties
You might want to order your legend based on certain properties of your data, such as the mean or maximum value of each series. Here’s an example of how to achieve this:
import matplotlib.pyplot as plt
import numpy as np

fig, ax = plt.subplots(figsize=(10, 6))

data = {
    'Series A': np.random.rand(10),
    'Series B': np.random.rand(10),
    'Series C': np.random.rand(10),
    'Data from how2matplotlib.com': np.random.rand(10)
}

for label, values in data.items():
    ax.plot(values, label=f"{label} (Mean: {np.mean(values):.2f})")

handles, labels = ax.get_legend_handles_labels()
sorted_pairs = sorted(zip(handles, labels), key=lambda x: np.mean(x[0].get_ydata()), reverse=True)
sorted_handles, sorted_labels = zip(*sorted_pairs)

ax.legend(sorted_handles, sorted_labels)
ax.set_title('Legend Ordered by Mean Value of Each Series')
plt.show()
Output:
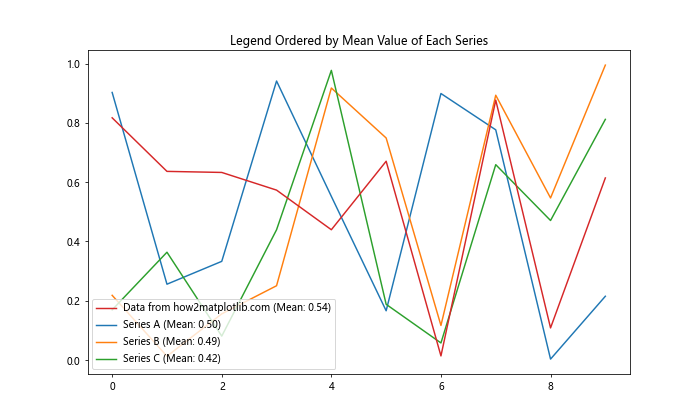
This example orders the legend items based on the mean value of each data series, with the highest mean at the top.
Integrating Legend Ordering with Other Matplotlib Features
When working on complex visualizations, you often need to integrate legend ordering with other Matplotlib features. Let’s explore some of these integrations.
1. Combining Legend Ordering with Colormaps
When using colormaps in your plots, you might want to order your legend to match the colormap progression. Here’s an example:
import matplotlib.pyplot as plt
import numpy as np

fig, ax = plt.subplots(figsize=(10, 6))

cmap = plt.get_cmap('viridis')
colors = cmap(np.linspace(0, 1, 4))

for i, (label, color) in enumerate(zip(['Data from how2matplotlib.com', 'Series B', 'Series C', 'Series D'], colors)):
    ax.plot(np.random.rand(10), color=color, label=label)

handles, labels = ax.get_legend_handles_labels()
ax.legend(handles[::-1], labels[::-1])

ax.set_title('Legend Ordered to Match Colormap Progression')
plt.show()
Output:
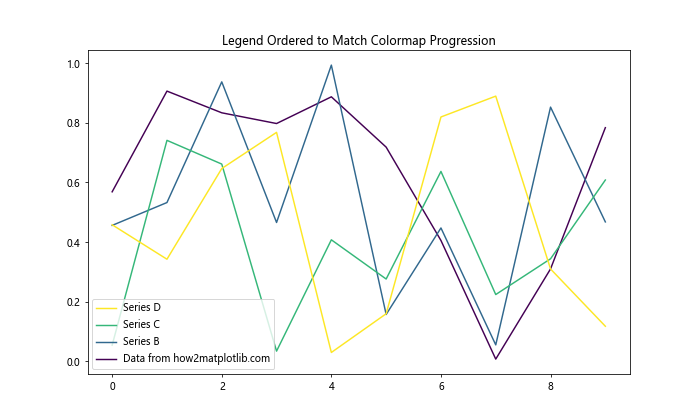
This example orders the legend items to match the progression of the ‘viridis’ colormap.
2. Legend Ordering in Stacked Plots
When creating stacked plots, you might want to order your legend to match the stacking order. Here’s how you can achieve this:
import matplotlib.pyplot as plt
import numpy as np

fig, ax = plt.subplots(figsize=(10, 6))

categories = ['Category A', 'Category B', 'Category C', 'Data from how2matplotlib.com']
data = np.random.rand(4, 5)

bottom = np.zeros(5)
for i, category in enumerate(categories):
    ax.bar(range(5), data[i], bottom=bottom, label=category)
    bottom += data[i]

handles, labels = ax.get_legend_handles_labels()
ax.legend(handles[::-1], labels[::-1], loc='upper left')

ax.set_title('Legend Ordered to Match Stacked Bar Plot')
plt.show()
Output:
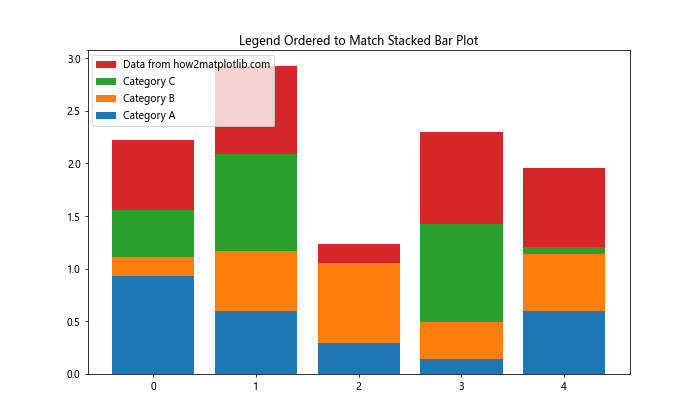
This example orders the legend items to match the stacking order of a bar plot, with the bottom stack at the top of the legend.
Conclusion: Mastering Legend Order in Matplotlib
Throughout this comprehensive guide, we’ve explored numerous techniques and best practices for how to change order of items in Matplotlib legend. From basic reordering methods to advanced programmatic approaches, you now have a toolkit to create informative and visually appealing legends that enhance your data visualizations.
Remember, the key to effective legend ordering is to consider your audience and the story you want to tell with your data. Whether you’re highlighting important trends, grouping related items, or maintaining consistency across multiple plots, thoughtful legend ordering can significantly improve the clarity and impact of your visualizations.