How to Change Legend Font Size in Matplotlib
How to Change Legend Font Size in Matplotlib is an essential skill for data visualization enthusiasts and professionals alike. Matplotlib, a powerful plotting library for Python, offers various ways to customize the appearance of your plots, including the legend font size. In this comprehensive guide, we’ll explore different methods to change the legend font size in Matplotlib, providing you with the knowledge and tools to create visually appealing and informative plots.
Understanding the Importance of Legend Font Size in Matplotlib
Before diving into the specifics of how to change legend font size in Matplotlib, it’s crucial to understand why this aspect of plot customization is important. The legend in a plot serves as a key to interpreting the data represented by different elements such as lines, markers, or colors. By adjusting the legend font size, you can:
- Improve readability: A properly sized legend font ensures that viewers can easily read and understand the plot’s information.
- Maintain visual hierarchy: Adjusting the legend font size helps in creating a balanced visual hierarchy within your plot.
- Accommodate different display sizes: Changing the legend font size allows you to optimize your plots for various display sizes, from small mobile screens to large presentation displays.
- Enhance accessibility: Larger legend font sizes can make your plots more accessible to viewers with visual impairments.
Now that we understand the importance of legend font size in Matplotlib, let’s explore various methods to change it.
Method 1: Using the fontsize Parameter in legend()
One of the simplest ways to change the legend font size in Matplotlib is by using the fontsize parameter when calling the legend() function. This method allows you to set the font size for the entire legend in one go.
Here’s an example of how to change legend font size in Matplotlib using this method:
import matplotlib.pyplot as plt
# Create a simple plot
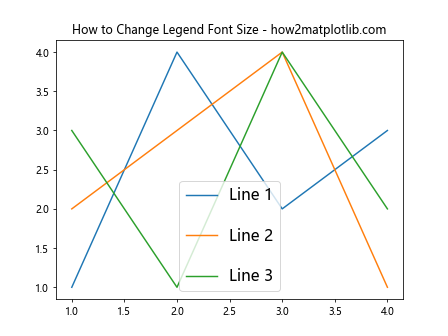
plt.plot([1, 2, 3, 4], [1, 4, 2, 3], label='Line 1')
plt.plot([1, 2, 3, 4], [2, 3, 4, 1], label='Line 2')
# Add a legend with custom font size
plt.legend(fontsize=16)
# Add a title with the website name
plt.title('How to Change Legend Font Size - how2matplotlib.com')
# Display the plot
plt.show()
Output:
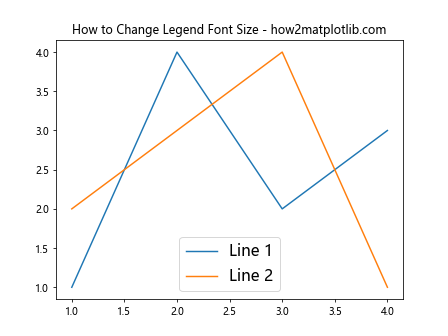
In this example, we create a simple plot with two lines and set the legend font size to 16 points. The fontsize parameter in the legend() function allows us to easily change the legend font size in Matplotlib.
Method 2: Using rcParams to Set Global Legend Font Size
If you want to change the legend font size for all plots in your script or notebook, you can use Matplotlib’s rcParams to set a global legend font size. This method is particularly useful when you’re creating multiple plots and want to maintain consistency across all of them.
Here’s an example of how to change legend font size in Matplotlib using rcParams:
import matplotlib.pyplot as plt

# Set global legend font size
plt.rcParams['legend.fontsize'] = 14

# Create two subplots
fig, (ax1, ax2) = plt.subplots(1, 2, figsize=(12, 5))

# Plot data on the first subplot
ax1.plot([1, 2, 3, 4], [1, 4, 2, 3], label='Line 1')
ax1.plot([1, 2, 3, 4], [2, 3, 4, 1], label='Line 2')
ax1.legend()
ax1.set_title('Subplot 1 - how2matplotlib.com')

# Plot data on the second subplot
ax2.plot([1, 2, 3, 4], [3, 1, 4, 2], label='Line 3')
ax2.plot([1, 2, 3, 4], [4, 3, 2, 1], label='Line 4')
ax2.legend()
ax2.set_title('Subplot 2 - how2matplotlib.com')

# Adjust layout and display the plot
plt.tight_layout()
plt.show()
Output:
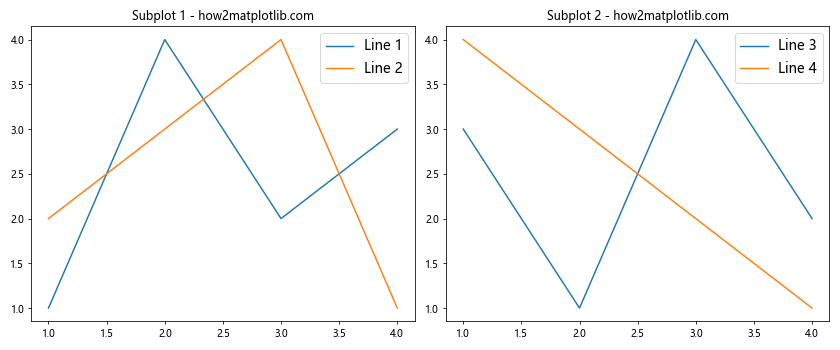
In this example, we use plt.rcParams['legend.fontsize'] = 14 to set the global legend font size to 14 points. This setting applies to both subplots, ensuring consistency in legend font size across the entire figure.
Method 3: Using prop Parameter with FontProperties
For more fine-grained control over the legend font properties, including size, you can use the prop parameter in the legend() function along with a FontProperties object. This method allows you to change legend font size in Matplotlib while also adjusting other font properties.
Here’s an example demonstrating how to change legend font size in Matplotlib using this method:
import matplotlib.pyplot as plt
from matplotlib.font_manager import FontProperties

# Create a simple plot
plt.plot([1, 2, 3, 4], [1, 4, 2, 3], label='Line 1')
plt.plot([1, 2, 3, 4], [2, 3, 4, 1], label='Line 2')

# Create a FontProperties object
font_props = FontProperties(size=18, weight='bold', family='serif')

# Add a legend with custom font properties
plt.legend(prop=font_props)

# Add a title with the website name
plt.title('How to Change Legend Font Size - how2matplotlib.com')

# Display the plot
plt.show()
Output:
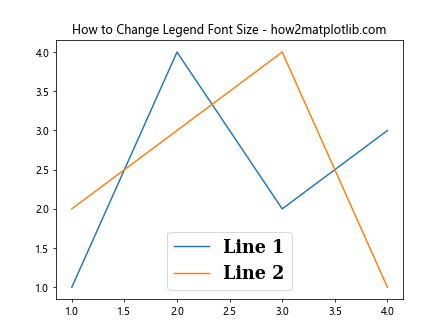
In this example, we create a FontProperties object with a font size of 18 points, bold weight, and serif family. We then pass this object to the legend() function using the prop parameter, allowing us to change the legend font size in Matplotlib along with other font properties.
Method 4: Using set_* Methods of Legend Object
Another way to change legend font size in Matplotlib is by accessing the legend object directly and using its set_* methods. This approach gives you fine-grained control over various aspects of the legend, including font size.
Here’s an example of how to change legend font size in Matplotlib using this method:
import matplotlib.pyplot as plt

# Create a simple plot
fig, ax = plt.subplots()
ax.plot([1, 2, 3, 4], [1, 4, 2, 3], label='Line 1')
ax.plot([1, 2, 3, 4], [2, 3, 4, 1], label='Line 2')

# Add a legend
legend = ax.legend()

# Change the font size of the legend text
for text in legend.get_texts():
    text.set_fontsize(16)

# Add a title with the website name
ax.set_title('How to Change Legend Font Size - how2matplotlib.com')

# Display the plot
plt.show()
Output:
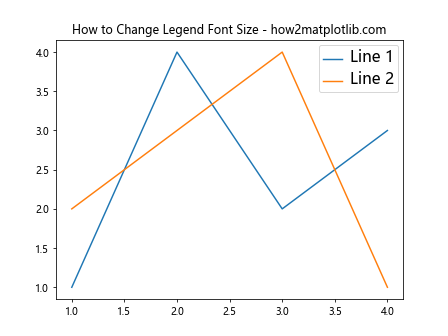
In this example, we first create the legend using ax.legend(). Then, we iterate through the text elements of the legend using legend.get_texts() and set the font size for each text element using text.set_fontsize(16). This method allows us to change the legend font size in Matplotlib with great flexibility.
Method 5: Using plt.setp() to Change Legend Properties
The plt.setp() function provides a convenient way to set multiple properties of plot elements, including legend text. This method is particularly useful when you want to change multiple properties of the legend text at once.
Here’s an example of how to change legend font size in Matplotlib using plt.setp():
import matplotlib.pyplot as plt

# Create a simple plot
fig, ax = plt.subplots()
ax.plot([1, 2, 3, 4], [1, 4, 2, 3], label='Line 1')
ax.plot([1, 2, 3, 4], [2, 3, 4, 1], label='Line 2')

# Add a legend
legend = ax.legend()

# Change the font size and style of the legend text
plt.setp(legend.get_texts(), fontsize=14, fontstyle='italic')

# Add a title with the website name
ax.set_title('How to Change Legend Font Size - how2matplotlib.com')

# Display the plot
plt.show()
Output:

In this example, we use plt.setp() to change both the font size and font style of the legend text. The legend.get_texts() method returns a list of text objects in the legend, which we then modify using plt.setp(). This approach provides a concise way to change legend font size in Matplotlib along with other text properties.
Method 6: Using labelspacing to Adjust Legend Layout
While not directly related to font size, adjusting the labelspacing parameter can help in accommodating larger font sizes in the legend. This parameter controls the vertical space between legend entries.
Here’s an example of how to change legend font size in Matplotlib and adjust the label spacing:
import matplotlib.pyplot as plt

# Create a simple plot
fig, ax = plt.subplots()
ax.plot([1, 2, 3, 4], [1, 4, 2, 3], label='Line 1')
ax.plot([1, 2, 3, 4], [2, 3, 4, 1], label='Line 2')
ax.plot([1, 2, 3, 4], [3, 1, 4, 2], label='Line 3')

# Add a legend with larger font size and increased label spacing
ax.legend(fontsize=16, labelspacing=1.5)

# Add a title with the website name
ax.set_title('How to Change Legend Font Size - how2matplotlib.com')

# Display the plot
plt.show()
Output:
In this example, we set the legend font size to 16 points and increase the labelspacing to 1.5. This combination allows us to change the legend font size in Matplotlib while ensuring that the larger text doesn’t overlap or appear cramped.
Method 7: Changing Legend Font Size in Seaborn Plots
Seaborn, a statistical data visualization library built on top of Matplotlib, provides a high-level interface for creating attractive and informative statistical graphics. When using Seaborn, you can still change the legend font size using Matplotlib’s methods.
Here’s an example of how to change legend font size in Matplotlib when using Seaborn:
import matplotlib.pyplot as plt
import seaborn as sns

# Set Seaborn style
sns.set_style("whitegrid")

# Create a simple Seaborn plot
tips = sns.load_dataset("tips")
sns.scatterplot(data=tips, x="total_bill", y="tip", hue="time")

# Get the current axes and legend
ax = plt.gca()
legend = ax.get_legend()

# Change the font size of the legend text
plt.setp(legend.get_texts(), fontsize=14)

# Add a title with the website name
plt.title('How to Change Legend Font Size - how2matplotlib.com')

# Display the plot
plt.show()
Output:
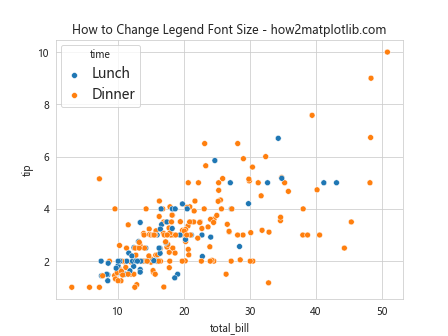
In this example, we create a Seaborn scatterplot and then use Matplotlib’s plt.setp() function to change the legend font size. This demonstrates how to change legend font size in Matplotlib even when working with higher-level libraries like Seaborn.
Method 8: Changing Legend Font Size for Specific Legend Entries
Sometimes, you may want to change the font size for specific legend entries rather than applying a uniform size to all entries. This can be achieved by accessing individual legend text objects.
Here’s an example of how to change legend font size in Matplotlib for specific entries:
import matplotlib.pyplot as plt

# Create a simple plot
fig, ax = plt.subplots()
ax.plot([1, 2, 3, 4], [1, 4, 2, 3], label='Line 1')
ax.plot([1, 2, 3, 4], [2, 3, 4, 1], label='Line 2')
ax.plot([1, 2, 3, 4], [3, 1, 4, 2], label='Line 3')

# Add a legend
legend = ax.legend()

# Change font size for specific legend entries
legend_texts = legend.get_texts()
legend_texts[0].set_fontsize(12)
legend_texts[1].set_fontsize(16)
legend_texts[2].set_fontsize(20)

# Add a title with the website name
ax.set_title('How to Change Legend Font Size - how2matplotlib.com')

# Display the plot
plt.show()
Output:
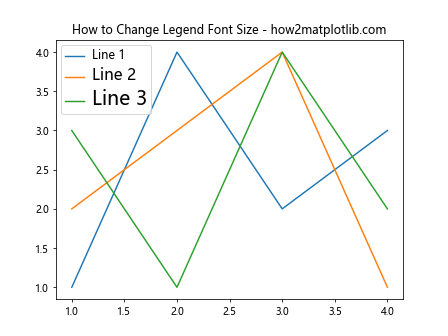
In this example, we access individual legend text objects using legend.get_texts() and set different font sizes for each entry. This method provides maximum flexibility when you need to change legend font size in Matplotlib for specific entries.
Method 9: Using bbox_to_anchor to Reposition Legend with Larger Font Size
When you change the legend font size in Matplotlib, you may need to adjust the legend’s position to prevent overlap with plot elements. The bbox_to_anchor parameter allows you to precisely position the legend.
Here’s an example of how to change legend font size in Matplotlib and reposition the legend:
import matplotlib.pyplot as plt

# Create a simple plot
fig, ax = plt.subplots()
ax.plot([1, 2, 3, 4], [1, 4, 2, 3], label='Line 1')
ax.plot([1, 2, 3, 4], [2, 3, 4, 1], label='Line 2')

# Add a legend with larger font size and custom position
ax.legend(fontsize=16, bbox_to_anchor=(1.05, 1), loc='upper left')

# Adjust the layout to make room for the legend
plt.tight_layout()

# Add a title with the website name
ax.set_title('How to Change Legend Font Size - how2matplotlib.com')

# Display the plot
plt.show()
Output:
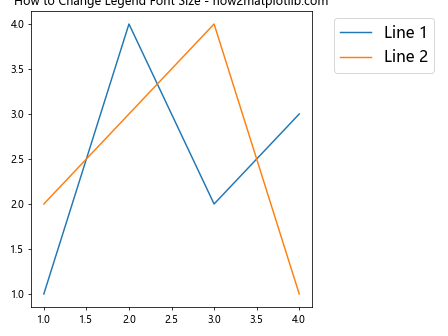
In this example, we set the legend font size to 16 points and use bbox_to_anchor=(1.05, 1) to position the legend outside the plot area. The loc='upper left' parameter aligns the legend to the upper left corner of the specified position. This approach allows you to change legend font size in Matplotlib while ensuring the legend doesn’t overlap with plot elements.
Method 10: Changing Legend Font Size in 3D Plots
Changing the legend font size in 3D plots follows a similar process to 2D plots, but it’s worth noting some specific considerations. Here’s an example of how to change legend font size in Matplotlib for a 3D plot:
import matplotlib.pyplot as plt
import numpy as np
from mpl_toolkits.mplot3d import Axes3D

# Create 3D data
x = np.linspace(-5, 5, 100)
y = np.linspace(-5, 5, 100)
X, Y = np.meshgrid(x, y)
Z1 = np.sin(np.sqrt(X**2 + Y**2))
Z2 = np.cos(np.sqrt(X**2 + Y**2))

# Create a 3D plot
fig = plt.figure()
ax = fig.add_subplot(111, projection='3d')

# Plot surfaces
surf1 = ax.plot_surface(X, Y, Z1, cmap='viridis', alpha=0.7, label='Surface 1')
surf2 = ax.plot_surface(X, Y, Z2, cmap='plasma', alpha=0.7, label='Surface 2')

# Add a legend with larger font size
ax.legend(fontsize=14)

# Add a title with the website name
ax.set_title('How to Change Legend Font Size in 3D - how2matplotlib.com')

# Display the plot
plt.show()
Output:
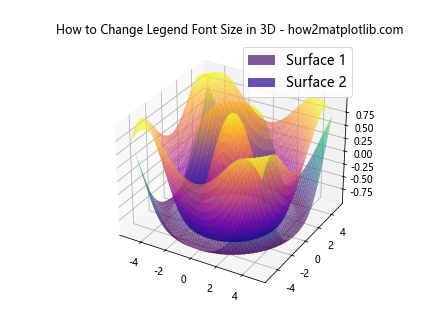
In this example, we create a 3D plot with two surfaces and set the legend font size to 14 points. Note that in 3D plots, you may need to adjust the view angle or legend position to ensure visibility, especially with larger font sizes.
Best Practices for Changing Legend Font Size in Matplotlib
As we’ve explored various methods to change legend font size in Matplotlib, it’s important to keep in mind some best practices to ensure your plots are both visually appealing and informative:
- Consistency: Maintain consistent font sizes across your plots, especially when presentingmultiple plots in a single figure or document.
Readability: Ensure that the legend font size is large enough to be easily read but not so large that it overwhelms the plot.
Balance: Strike a balance between the legend font size and other text elements in your plot, such as axis labels and titles.
Accessibility: Consider using larger font sizes to make your plots more accessible to viewers with visual impairments.
Scalability: Test your plots at different sizes to ensure the legend remains readable when scaled up or down.
Context: Adjust the legend font size based on the context in which the plot will be viewed (e.g., print, digital display, presentation).
Hierarchy: Use font size to establish a visual hierarchy, with the most important information (like titles) having the largest font size.
White space: Ensure there’s enough white space around the legend to prevent it from appearing cramped or overlapping with other plot elements.
Advanced Techniques for Legend Font Size Customization
Now that we’ve covered the basics of how to change legend font size in Matplotlib, let’s explore some advanced techniques for further customization.