How to Change Fonts in Matplotlib
How to change fonts in Matplotlib is an essential skill for data visualization enthusiasts and professionals alike. Matplotlib, a powerful plotting library for Python, offers various ways to customize the appearance of your plots, including font selection and manipulation. In this comprehensive guide, we’ll explore the different methods and techniques to change fonts in Matplotlib, providing you with the knowledge to create visually appealing and professional-looking charts and graphs.
Understanding Font Basics in Matplotlib
Before diving into the specifics of how to change fonts in Matplotlib, it’s crucial to understand the basics of font handling in this library. Matplotlib uses a font manager to handle font-related operations, which allows you to work with system fonts as well as custom fonts.
When you create a plot using Matplotlib, the library uses default fonts for various elements such as titles, labels, and tick marks. However, you have the flexibility to change these fonts to suit your needs and preferences. Let’s start with a simple example to illustrate the default font behavior:
import matplotlib.pyplot as plt

plt.figure(figsize=(8, 6))
plt.title("Default Font Example - how2matplotlib.com")
plt.xlabel("X-axis")
plt.ylabel("Y-axis")
plt.plot([1, 2, 3, 4], [1, 4, 2, 3])
plt.show()
Output:
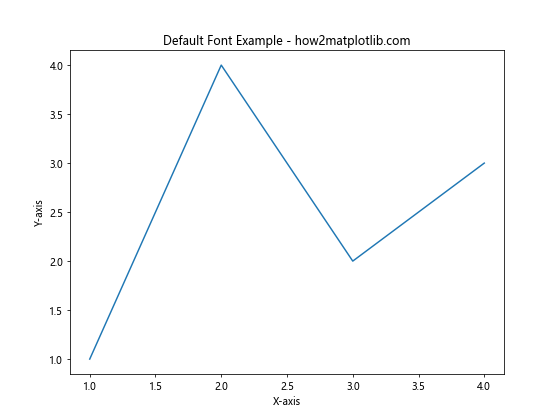
In this example, we create a basic line plot using the default font settings. Now, let’s explore how to change fonts in Matplotlib to customize the appearance of our plots.
How to Change Fonts Globally in Matplotlib
One of the most straightforward ways to change fonts in Matplotlib is to set them globally. This approach affects all plots created in your script or notebook. To change fonts globally, you can use the rcParams dictionary, which contains various configuration settings for Matplotlib.
Here’s an example of how to change fonts globally:
import matplotlib.pyplot as plt
import matplotlib as mpl

# Change the default font family
mpl.rcParams['font.family'] = 'serif'

# Change the default font size
mpl.rcParams['font.size'] = 12

plt.figure(figsize=(8, 6))
plt.title("Global Font Change Example - how2matplotlib.com")
plt.xlabel("X-axis")
plt.ylabel("Y-axis")
plt.plot([1, 2, 3, 4], [1, 4, 2, 3])
plt.show()
Output:
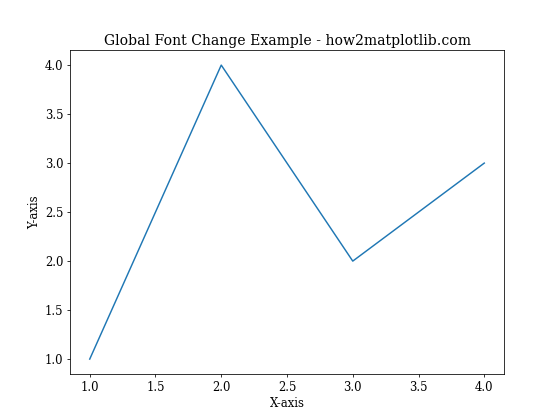
In this example, we change the default font family to ‘serif’ and set the font size to 12 points. These changes will apply to all subsequent plots in your script.
How to Change Fonts for Specific Plot Elements
While changing fonts globally can be useful, you may want to have more fine-grained control over individual plot elements. Matplotlib allows you to change fonts for specific elements such as titles, labels, and tick marks. Let’s explore how to do this:
Changing Title Font
To change the font of the plot title, you can use the fontname parameter in the title() function:
import matplotlib.pyplot as plt

plt.figure(figsize=(8, 6))
plt.title("Custom Title Font - how2matplotlib.com", fontname='Arial', fontsize=16, fontweight='bold')
plt.xlabel("X-axis")
plt.ylabel("Y-axis")
plt.plot([1, 2, 3, 4], [1, 4, 2, 3])
plt.show()
Output:
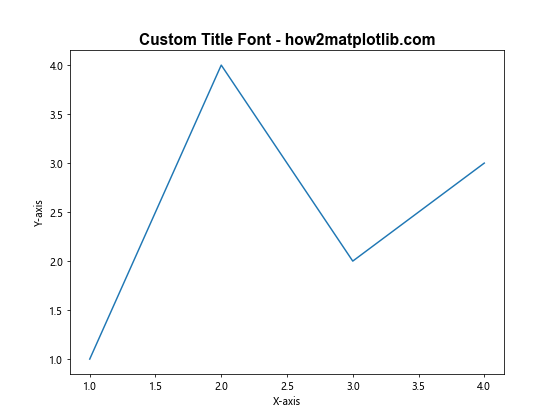
In this example, we set the title font to Arial, increase its size to 16 points, and make it bold.
Changing Axis Label Fonts
Similarly, you can change the fonts for axis labels using the fontname parameter in the xlabel() and ylabel() functions:
import matplotlib.pyplot as plt

plt.figure(figsize=(8, 6))
plt.title("Custom Axis Label Fonts - how2matplotlib.com")
plt.xlabel("X-axis", fontname='Times New Roman', fontsize=14)
plt.ylabel("Y-axis", fontname='Courier New', fontsize=14)
plt.plot([1, 2, 3, 4], [1, 4, 2, 3])
plt.show()
Output:
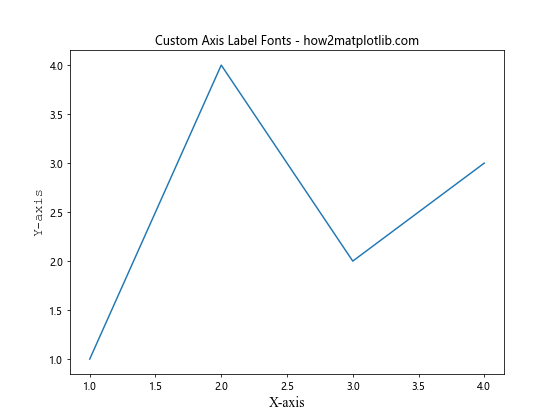
Here, we set different fonts for the x-axis and y-axis labels.
How to Change Fonts for Text Annotations
When adding text annotations to your plots, you can also customize their fonts. Here’s an example:
import matplotlib.pyplot as plt

plt.figure(figsize=(8, 6))
plt.title("Text Annotation Font Example - how2matplotlib.com")
plt.xlabel("X-axis")
plt.ylabel("Y-axis")
plt.plot([1, 2, 3, 4], [1, 4, 2, 3])

plt.annotate("Important Point", xy=(2, 4), xytext=(3, 3),
             arrowprops=dict(facecolor='black', shrink=0.05),
             fontname='Comic Sans MS', fontsize=12, fontstyle='italic')

plt.show()
Output:
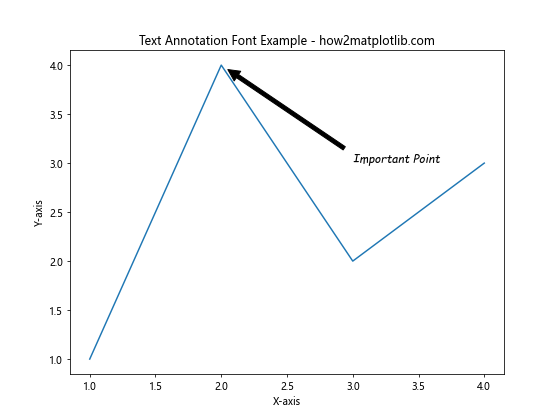
In this example, we add a text annotation with a custom font (Comic Sans MS) and style it italic.
How to Change Fonts for Legend
Customizing the font of your plot’s legend is another important aspect of changing fonts in Matplotlib. Here’s how you can do it:
import matplotlib.pyplot as plt

plt.figure(figsize=(8, 6))
plt.title("Legend Font Example - how2matplotlib.com")
plt.xlabel("X-axis")
plt.ylabel("Y-axis")

plt.plot([1, 2, 3, 4], [1, 4, 2, 3], label="Line 1")
plt.plot([1, 2, 3, 4], [3, 2, 4, 1], label="Line 2")

plt.legend(prop={'family': 'monospace', 'size': 10})
plt.show()
Output:
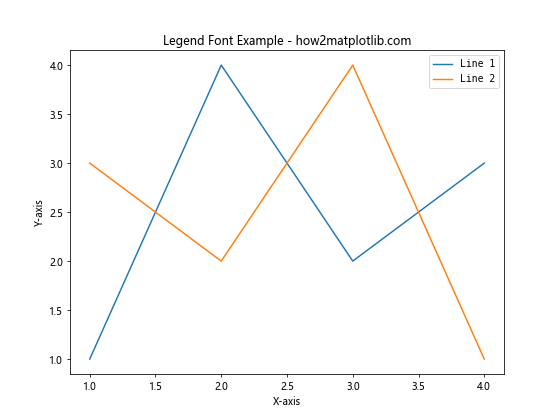
In this example, we set the legend font to a monospace family with a size of 10 points.
How to Change Fonts for Specific Text Elements
Sometimes you may want to change the font for specific text elements within your plot. Matplotlib’s Text objects allow you to do this. Here’s an example:
import matplotlib.pyplot as plt

fig, ax = plt.subplots(figsize=(8, 6))
ax.set_title("Specific Text Font Example - how2matplotlib.com")
ax.set_xlabel("X-axis")
ax.set_ylabel("Y-axis")
ax.plot([1, 2, 3, 4], [1, 4, 2, 3])

text = ax.text(2, 3, "Special Text", fontname='Papyrus', fontsize=16, color='red')
plt.show()
Output:
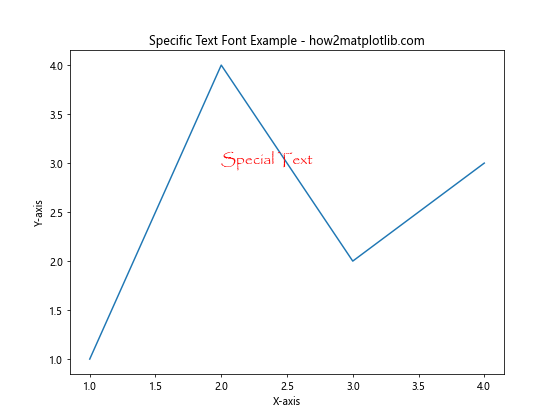
In this example, we add a specific text element with a custom font (Papyrus) and color.
How to Change Fonts in Subplots
When working with subplots, you may want to change fonts for individual subplots or apply font changes across all subplots. Here’s an example of how to do both:
import matplotlib.pyplot as plt

fig, (ax1, ax2) = plt.subplots(1, 2, figsize=(12, 6))

# Font for the first subplot
ax1.set_title("Subplot 1 - how2matplotlib.com", fontname='Arial', fontsize=14)
ax1.set_xlabel("X-axis", fontname='Times New Roman')
ax1.set_ylabel("Y-axis", fontname='Times New Roman')
ax1.plot([1, 2, 3, 4], [1, 4, 2, 3])

# Font for the second subplot
ax2.set_title("Subplot 2 - how2matplotlib.com", fontname='Courier New', fontsize=14)
ax2.set_xlabel("X-axis", fontname='Helvetica')
ax2.set_ylabel("Y-axis", fontname='Helvetica')
ax2.plot([1, 2, 3, 4], [3, 2, 4, 1])

# Global font settings for tick labels
plt.rcParams['font.family'] = 'sans-serif'
plt.rcParams['font.sans-serif'] = ['Verdana']
plt.rcParams['font.size'] = 10

plt.tight_layout()
plt.show()
In this example, we set different fonts for each subplot’s title and axis labels, while applying a global font setting for tick labels.
How to Change Fonts in 3D Plots
Changing fonts in 3D plots follows a similar process to 2D plots, but with some additional considerations. Here’s an example:
import matplotlib.pyplot as plt
from mpl_toolkits.mplot3d import Axes3D
import numpy as np

fig = plt.figure(figsize=(10, 8))
ax = fig.add_subplot(111, projection='3d')

# Generate data
x = np.linspace(-5, 5, 100)
y = np.linspace(-5, 5, 100)
X, Y = np.meshgrid(x, y)
Z = np.sin(np.sqrt(X**2 + Y**2))

# Plot the surface
surf = ax.plot_surface(X, Y, Z, cmap='viridis')

# Customize fonts
ax.set_title("3D Plot Font Example - how2matplotlib.com", fontname='Arial', fontsize=16)
ax.set_xlabel("X-axis", fontname='Times New Roman', fontsize=12)
ax.set_ylabel("Y-axis", fontname='Times New Roman', fontsize=12)
ax.set_zlabel("Z-axis", fontname='Times New Roman', fontsize=12)

# Adjust tick label fonts
for axis in [ax.xaxis, ax.yaxis, ax.zaxis]:
    axis.set_tick_params(labelsize=10, labelcolor='red', font='Courier New')

plt.show()
In this example, we create a 3D surface plot and customize the fonts for the title, axis labels, and tick labels.
How to Change Fonts in Polar Plots
Polar plots have their own unique considerations when it comes to changing fonts. Here’s an example of how to customize fonts in a polar plot:
import matplotlib.pyplot as plt
import numpy as np

# Generate data
r = np.arange(0, 2, 0.01)
theta = 2 * np.pi * r

# Create polar plot
fig, ax = plt.subplots(subplot_kw=dict(projection='polar'), figsize=(8, 8))
ax.plot(theta, r)

# Customize fonts
ax.set_title("Polar Plot Font Example - how2matplotlib.com", fontname='Helvetica', fontsize=16)
ax.set_rticks([0.5, 1, 1.5])
ax.set_rlabel_position(22.5)

# Change font for radial labels
for label in ax.get_yticklabels():
    label.set_fontname('Arial')
    label.set_fontsize(10)

# Change font for angular labels
for label in ax.get_xticklabels():
    label.set_fontname('Times New Roman')
    label.set_fontsize(12)

plt.show()
In this example, we create a polar plot and customize the fonts for the title, radial labels, and angular labels.
How to Change Fonts in Colorbars
When working with plots that include colorbars, you may want to customize the fonts used in the colorbar labels. Here’s an example:
import matplotlib.pyplot as plt
import numpy as np

# Generate data
x = np.linspace(0, 10, 100)
y = np.linspace(0, 10, 100)
X, Y = np.meshgrid(x, y)
Z = np.sin(X) * np.cos(Y)

# Create plot
fig, ax = plt.subplots(figsize=(10, 8))
im = ax.imshow(Z, cmap='viridis')

# Add colorbar
cbar = fig.colorbar(im)

# Customize fonts
ax.set_title("Colorbar Font Example - how2matplotlib.com", fontname='Arial', fontsize=16)
ax.set_xlabel("X-axis", fontname='Times New Roman', fontsize=12)
ax.set_ylabel("Y-axis", fontname='Times New Roman', fontsize=12)

# Change colorbar label font
cbar.set_label("Values", fontname='Courier New', fontsize=14)

# Change colorbar tick label font
cbar.ax.tick_params(labelsize=10)
for label in cbar.ax.get_yticklabels():
    label.set_fontname('Verdana')

plt.show()
Output:

In this example, we create a heatmap with a colorbar and customize the fonts for the plot title, axis labels, colorbar label, and colorbar tick labels.
How to Change Fonts in Matplotlib Using Style Sheets
Matplotlib provides style sheets that allow you to quickly change the overall appearance of your plots, including fonts. Here’s an example of how to use a style sheet and customize fonts:
import matplotlib.pyplot as plt
import numpy as np

# Use a predefined style sheet
plt.style.use('seaborn')

# Generate data
x = np.linspace(0, 10, 100)
y1 = np.sin(x)
y2 = np.cos(x)

# Create plotplt.figure(figsize=(10, 6))
plt.plot(x, y1, label='sin(x)')
plt.plot(x, y2, label='cos(x)')

# Customize fonts
plt.title("Style Sheet Font Example - how2matplotlib.com", fontname='Arial', fontsize=16)
plt.xlabel("X-axis", fontname='Times New Roman', fontsize=12)
plt.ylabel("Y-axis", fontname='Times New Roman', fontsize=12)
plt.legend(prop={'family': 'Courier New', 'size': 10})

plt.show()
In this example, we use the ‘seaborn’ style sheet and then customize specific font properties for various plot elements.
How to Change Fonts in Matplotlib for Different Languages
When working with text in different languages, you may need to use fonts that support specific character sets. Here’s an example of how to change fonts for a plot with text in multiple languages:
import matplotlib.pyplot as plt
from matplotlib.font_manager import FontProperties

# Create a plot
fig, ax = plt.subplots(figsize=(10, 6))

# English text
ax.text(0.1, 0.9, "English: Hello World!", fontname='Arial', fontsize=12)

# Chinese text
chinese_font = FontProperties(fname='/path/to/chinese_font.ttf', size=12)
ax.text(0.1, 0.7, "中文: 你好,世界!", fontproperties=chinese_font)

# Japanese text
japanese_font = FontProperties(fname='/path/to/japanese_font.ttf', size=12)
ax.text(0.1, 0.5, "日本語: こんにちは、世界!", fontproperties=japanese_font)

# Arabic text
arabic_font = FontProperties(fname='/path/to/arabic_font.ttf', size=12)
ax.text(0.1, 0.3, "العربية: مرحبا بالعالم!", fontproperties=arabic_font)

ax.set_title("Multilingual Font Example - how2matplotlib.com", fontname='Arial', fontsize=16)
ax.axis('off')  # Hide axes

plt.show()
In this example, we use different font files for different languages to ensure proper rendering of characters. Replace ‘/path/to/…_font.ttf’ with the actual paths to appropriate font files that support the respective languages.
How to Change Fonts Dynamically in Matplotlib
In some cases, you may want to change fonts dynamically based on certain conditions or user input. Here’s an example of how to implement dynamic font changes:
import matplotlib.pyplot as plt
import numpy as np

def plot_with_font(font_name):
    x = np.linspace(0, 10, 100)
    y = np.sin(x)

    plt.figure(figsize=(10, 6))
    plt.plot(x, y)
    plt.title(f"Dynamic Font Example - {font_name} - how2matplotlib.com", fontname=font_name, fontsize=16)
    plt.xlabel("X-axis", fontname=font_name, fontsize=12)
    plt.ylabel("Y-axis", fontname=font_name, fontsize=12)
    plt.show()

# Example usage
fonts = ['Arial', 'Times New Roman', 'Courier New', 'Verdana']
for font in fonts:
    plot_with_font(font)
In this example, we create a function that generates a plot with a specified font, and then we call this function with different font names to create multiple plots with varying fonts.
How to Troubleshoot Font Issues in Matplotlib
When changing fonts in Matplotlib, you may encounter issues such as fonts not rendering correctly or not being recognized. Here are some troubleshooting tips:
- Check available fonts: You can use the following code to list all available fonts on your system:
import matplotlib.font_manager

font_list = matplotlib.font_manager.findSystemFonts(fontpaths=None, fontext='ttf')
for font in font_list:
    print(font)
- Verify font installation: Ensure that the fonts you’re trying to use are properly installed on your system.
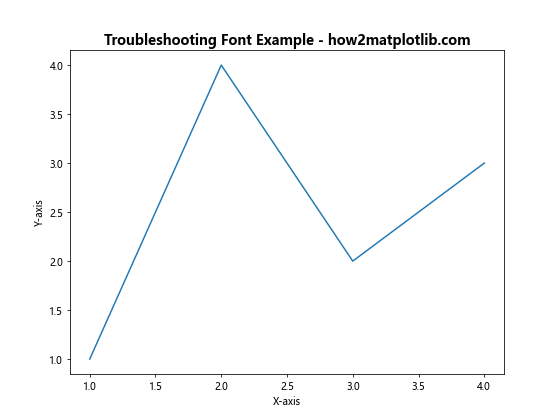
Use font properties: Instead of specifying font names directly, use
FontPropertiesto set font characteristics:
import matplotlib.pyplot as plt
from matplotlib.font_manager import FontProperties

font_prop = FontProperties(family='sans-serif', weight='bold', size=14)

plt.figure(figsize=(8, 6))
plt.title("Troubleshooting Font Example - how2matplotlib.com", fontproperties=font_prop)
plt.xlabel("X-axis")
plt.ylabel("Y-axis")
plt.plot([1, 2, 3, 4], [1, 4, 2, 3])
plt.show()
Output:
