How Can I Plot a Single Point in Matplotlib Python
Plotting a single point in Matplotlib is a fundamental task that can be useful in a variety of contexts, such as highlighting specific data points on a graph, annotating outliers, or simply understanding the basics of plotting with Matplotlib. This article will guide you through several methods to plot a single point using Matplotlib, a powerful plotting library in Python. Each method will be accompanied by a complete, standalone example code that you can run directly to see how it works.
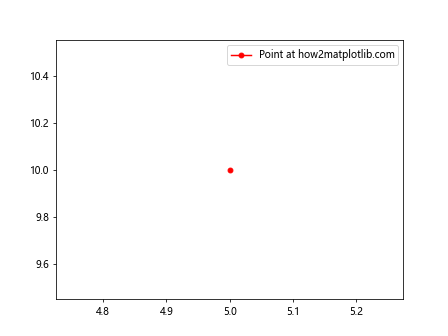
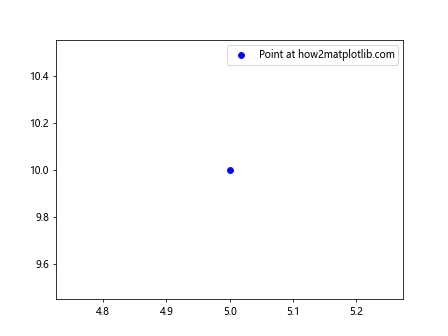
1. Using plot Function
The plot function is the most straightforward way to plot a single point. You can specify the x and y coordinates of the point, and use markers to visualize it.
import matplotlib.pyplot as plt

x = 5
y = 10
plt.plot(x, y, marker='o', markersize=5, color='red', label='Point at how2matplotlib.com')
plt.legend()
plt.show()
Output:
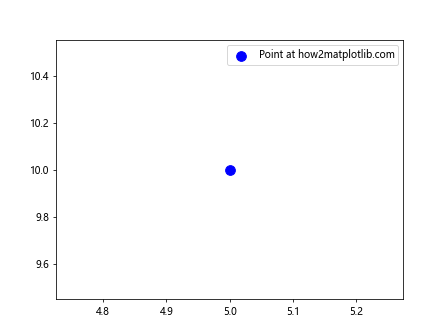
2. Using scatter Function
The scatter function is specifically designed for creating scatter plots but can also be used to plot a single point. This method offers more flexibility in customizing the appearance of the point.
import matplotlib.pyplot as plt

x = 5
y = 10
plt.scatter(x, y, s=100, color='blue', label='Point at how2matplotlib.com')
plt.legend()
plt.show()
Output:
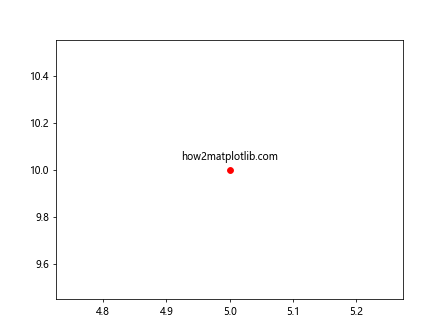
3. Annotating the Point
Sometimes, you might want to annotate the point with text. This can be done by combining plotting methods with the annotate function.
import matplotlib.pyplot as plt

x = 5
y = 10
plt.plot(x, y, 'ro')  # Plot the point
plt.annotate('how2matplotlib.com', (x, y), textcoords="offset points", xytext=(0,10), ha='center')
plt.show()
Output:
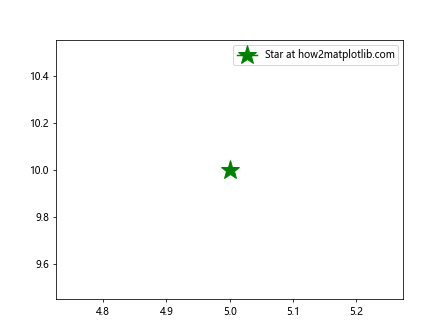
4. Custom Marker Styles
You can customize the marker’s style to make your point stand out or to match a specific theme.
import matplotlib.pyplot as plt

x = 5
y = 10
plt.plot(x, y, marker='*', markersize=20, color='green', label='Star at how2matplotlib.com')
plt.legend()
plt.show()
Output:
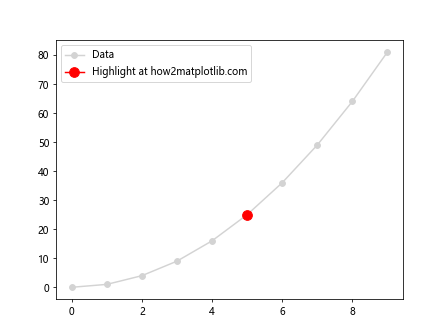
5. Plotting Multiple Points with Emphasis on One
If you have a dataset but want to emphasize a single point, you can plot the dataset and then highlight the specific point.
import matplotlib.pyplot as plt
import numpy as np

x = np.arange(10)
y = np.power(x, 2)
highlight = (5, 25)

plt.plot(x, y, marker='o', color='lightgray', label='Data')
plt.plot(highlight[0], highlight[1], marker='o', markersize=10, color='red', label='Highlight at how2matplotlib.com')
plt.legend()
plt.show()
Output:
6. Using ax for More Control
Using the object-oriented approach with ax gives you more control over your plots, which is useful for complex figures.
import matplotlib.pyplot as plt

fig, ax = plt.subplots()
x = 5
y = 10
ax.plot(x, y, 'bo', label='Point at how2matplotlib.com')
ax.legend()
plt.show()
Output:
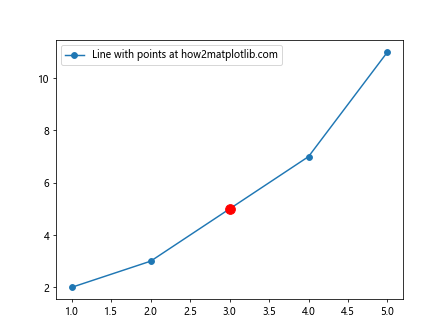
7. Combining Points with Lines
You can combine points with lines to indicate connections or trends, highlighting a specific point on the line.
import matplotlib.pyplot as plt

x = [1, 2, 3, 4, 5]
y = [2, 3, 5, 7, 11]
plt.plot(x, y, '-o', label='Line with points at how2matplotlib.com')
plt.plot(3, 5, 'ro', markersize=10)  # Highlight the point at x=3, y=5
plt.legend()
plt.show()
Output:
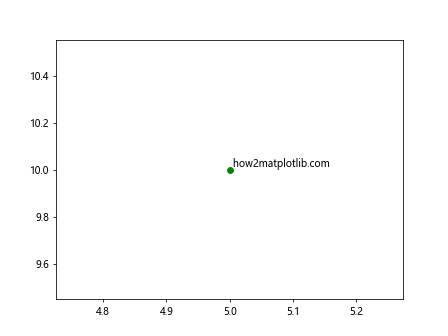
8. Using text for Simple Annotations
For simple annotations without arrows, you can use the text function.
import matplotlib.pyplot as plt

x = 5
y = 10
plt.plot(x, y, 'go')
plt.text(x, y, ' how2matplotlib.com', verticalalignment='bottom')
plt.show()
Output:
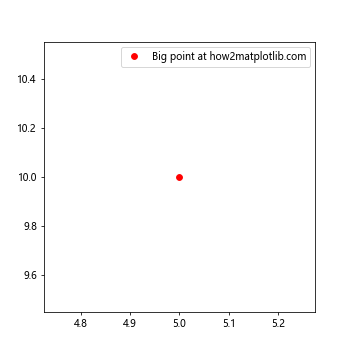
9. Customizing Figure Size for Emphasis
Adjusting the figure size can help in emphasizing the point, especially when it’s the sole focus of the plot.
import matplotlib.pyplot as plt

plt.figure(figsize=(5, 5))
plt.plot(5, 10, 'ro', label='Big point at how2matplotlib.com')
plt.legend()
plt.show()
Output:
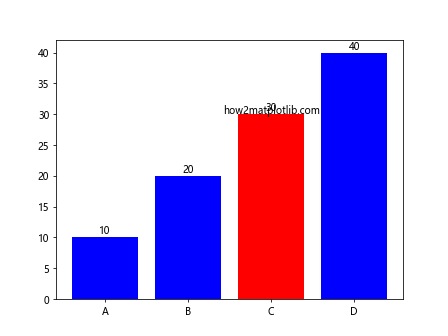
10. Highlighting Points in Bar Charts
Even in bar charts, you can highlight a specific point (or bar) to draw attention.
import matplotlib.pyplot as plt

categories = ['A', 'B', 'C', 'D']
values = [10, 20, 30, 40]
highlight = {'C': 'red'}

bars = plt.bar(categories, values, color=[highlight.get(x, 'blue') for x in categories])
plt.bar_label(bars, label_type='edge')
plt.text(2, 30, 'how2matplotlib.com', ha='center')
plt.show()
Output:
Conclusion
Plotting a single point in Matplotlib is a versatile skill that can be applied in numerous ways, from simple data visualization to complex annotations and highlights. The examples provided in this article demonstrate various methods to plot and customize single points, offering a foundation that can be adapted and expanded upon for your specific needs. Whether you’re annotating outliers, emphasizing data points, or learning the basics of Matplotlib, these techniques will serve as valuable tools in your data visualization toolkit.