How can I plot a histogram such that the heights of the bars sum to 1 in matplotlib?
Creating histograms is a fundamental part of data visualization, which helps in understanding the distribution of data. In matplotlib, a histogram can be created using the hist() function from the pyplot module. Sometimes, it is useful to plot a histogram such that the heights of the bars sum to 1, making it a probability density rather than a frequency count. This is particularly useful in statistics for comparing distributions or when the data set is large.
In this article, we will explore how to plot such histograms using matplotlib, providing detailed examples and explanations.
Basic Histogram
Before diving into normalized histograms, let’s start with a basic example of creating a simple histogram.
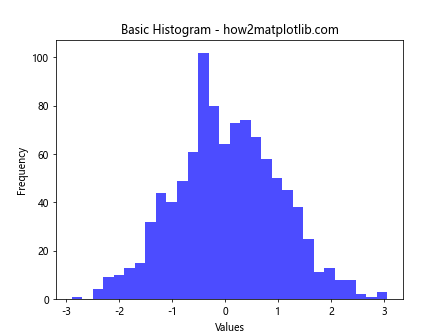
Example 1: Basic Histogram
import matplotlib.pyplot as plt
import numpy as np

# Generate random data
data = np.random.randn(1000)

plt.hist(data, bins=30, color='blue', alpha=0.7)
plt.title("Basic Histogram - how2matplotlib.com")
plt.xlabel("Values")
plt.ylabel("Frequency")
plt.show()
Output:
Normalized Histogram
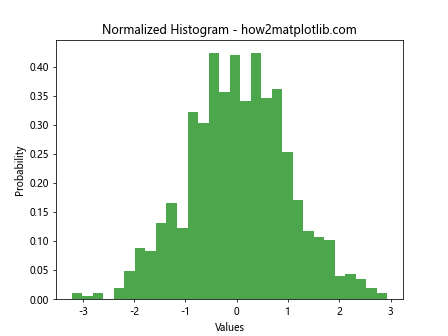
To create a histogram where the heights of the bars sum to 1, you can use the density parameter in the hist() function.
Example 2: Normalized Histogram
import matplotlib.pyplot as plt
import numpy as np

# Generate random data
data = np.random.randn(1000)

plt.hist(data, bins=30, density=True, color='green', alpha=0.7)
plt.title("Normalized Histogram - how2matplotlib.com")
plt.xlabel("Values")
plt.ylabel("Probability")
plt.show()
Output:
Customizing Histograms
Matplotlib allows extensive customization of histograms. You can change colors, bin sizes, transparency, and more.
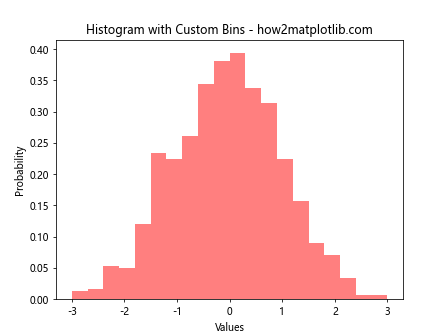
Example 3: Histogram with Custom Bin Sizes
import matplotlib.pyplot as plt
import numpy as np

# Generate random data
data = np.random.randn(1000)

plt.hist(data, bins=np.linspace(-3, 3, 21), density=True, color='red', alpha=0.5)
plt.title("Histogram with Custom Bins - how2matplotlib.com")
plt.xlabel("Values")
plt.ylabel("Probability")
plt.show()
Output:
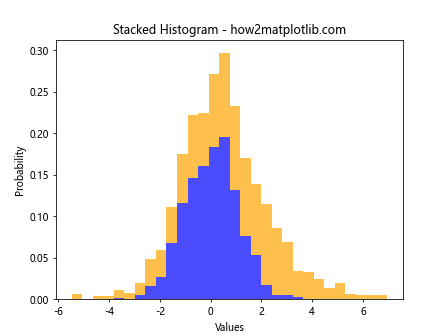
Example 4: Stacked Histograms
import matplotlib.pyplot as plt
import numpy as np

# Generate random data
data1 = np.random.normal(0, 1, 1000)
data2 = np.random.normal(1, 2, 1000)

plt.hist([data1, data2], bins=30, density=True, color=['blue', 'orange'], alpha=0.7, stacked=True)
plt.title("Stacked Histogram - how2matplotlib.com")
plt.xlabel("Values")
plt.ylabel("Probability")
plt.show()
Output:
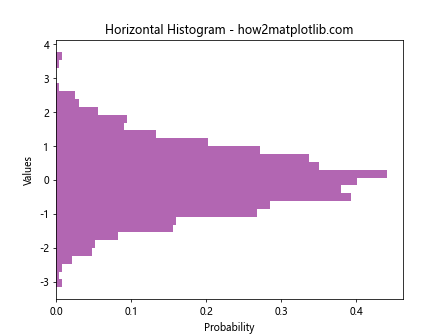
Example 5: Horizontal Histogram
import matplotlib.pyplot as plt
import numpy as np

# Generate random data
data = np.random.randn(1000)

plt.hist(data, bins=30, orientation='horizontal', density=True, color='purple', alpha=0.6)
plt.title("Horizontal Histogram - how2matplotlib.com")
plt.xlabel("Probability")
plt.ylabel("Values")
plt.show()
Output:
Advanced Histogram Customization
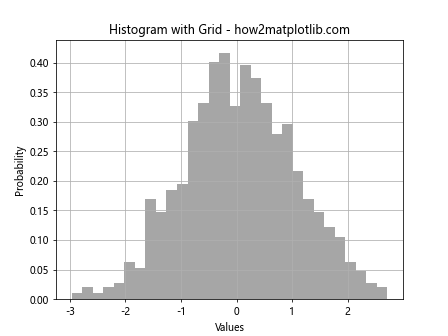
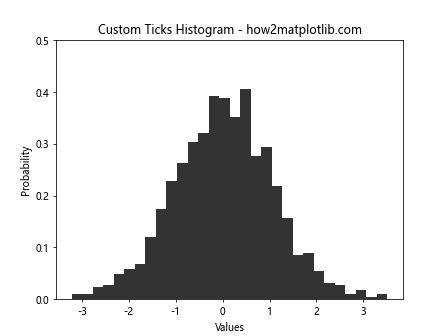
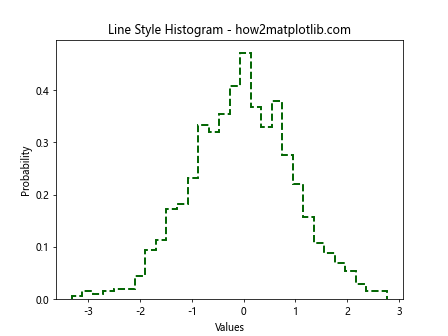
Let’s explore more advanced customization options like adding a grid, customizing ticks, and using different line styles for the histogram.
Example 6: Histogram with Grid
import matplotlib.pyplot as plt
import numpy as np

# Generate random data
data = np.random.randn(1000)

plt.hist(data, bins=30, density=True, color='grey', alpha=0.7)
plt.grid(True)
plt.title("Histogram with Grid - how2matplotlib.com")
plt.xlabel("Values")
plt.ylabel("Probability")
plt.show()
Output:
Example 7: Customizing Ticks
import matplotlib.pyplot as plt
import numpy as np

# Generate random data
data = np.random.randn(1000)

plt.hist(data, bins=30, density=True, color='black', alpha=0.8)
plt.xticks(np.arange(-3, 4, 1))
plt.yticks(np.linspace(0, 0.5, 6))
plt.title("Custom Ticks Histogram - how2matplotlib.com")
plt.xlabel("Values")
plt.ylabel("Probability")
plt.show()
Output:
Example 8: Histogram with Different Line Style
import matplotlib.pyplot as plt
import numpy as np

# Generate random data
data = np.random.randn(1000)

plt.hist(data, bins=30, density=True, histtype='step', linestyle='--', linewidth=2, color='darkgreen')
plt.title("Line Style Histogram - how2matplotlib.com")
plt.xlabel("Values")
plt.ylabel("Probability")
plt.show()
Output:
Conclusion
In this article, we explored how to create and customize histograms in matplotlib, focusing on making the heights of the bars sum to 1 for probability density visualization. We covered basic histograms, customization options, and advanced features. These examples should provide a solid foundation for creating effective and visually appealing histograms for your data analysis needs.