How to Display Percentage Above Bar Chart in Matplotlib
Display percentage above bar chart in Matplotlib is a powerful technique to enhance data visualization. This article will explore various methods and best practices for adding percentage labels to bar charts using Matplotlib. We’ll cover everything from basic implementations to advanced customization options, ensuring you have a thorough understanding of how to display percentage above bar chart in Matplotlib.
Understanding the Basics of Displaying Percentage Above Bar Chart in Matplotlib
Before diving into the specifics of how to display percentage above bar chart in Matplotlib, it’s essential to understand the fundamental concepts. Matplotlib is a versatile plotting library for Python that allows users to create a wide range of static, animated, and interactive visualizations. When it comes to bar charts, adding percentage labels can significantly improve the readability and interpretability of your data.
To display percentage above bar chart in Matplotlib, we typically follow these steps:
- Create the bar chart using Matplotlib’s
bar()function. - Calculate the percentage values for each bar.
- Use the
text()function to add percentage labels above each bar.
Let’s start with a simple example to illustrate how to display percentage above bar chart in Matplotlib:
import matplotlib.pyplot as plt

# Data for the bar chart
categories = ['Category A', 'Category B', 'Category C', 'Category D']
values = [25, 40, 30, 55]

# Calculate percentages
total = sum(values)
percentages = [value / total * 100 for value in values]

# Create the bar chart
fig, ax = plt.subplots(figsize=(10, 6))
bars = ax.bar(categories, values)

# Add percentage labels above each bar
for i, (bar, percentage) in enumerate(zip(bars, percentages)):
    height = bar.get_height()
    ax.text(bar.get_x() + bar.get_width() / 2, height,
            f'{percentage:.1f}%',
            ha='center', va='bottom')

# Customize the chart
ax.set_title('How to Display Percentage Above Bar Chart in Matplotlib - how2matplotlib.com')
ax.set_ylabel('Values')
ax.set_ylim(0, max(values) * 1.1)  # Add some space for labels

plt.show()
Output:
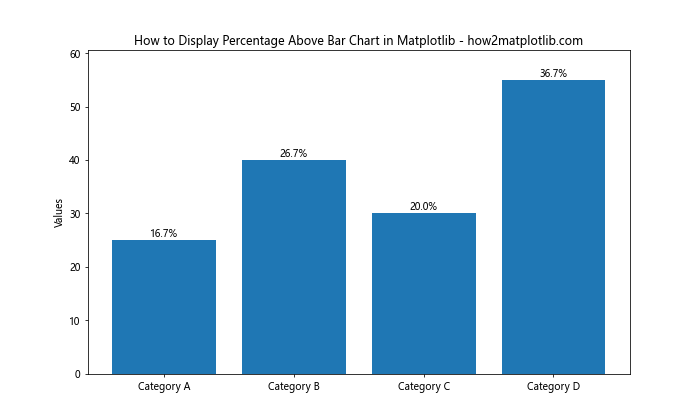
In this example, we’ve created a basic bar chart and added percentage labels above each bar. The text() function is used to position the labels correctly, and we’ve formatted the percentages to display one decimal place.
Advanced Techniques for Displaying Percentage Above Bar Chart in Matplotlib
Now that we’ve covered the basics, let’s explore some advanced techniques to display percentage above bar chart in Matplotlib. These methods will help you create more visually appealing and informative visualizations.
Customizing Label Appearance
When you display percentage above bar chart in Matplotlib, you may want to customize the appearance of the labels. This can include changing the font size, color, or style. Here’s an example that demonstrates how to customize label appearance:
import matplotlib.pyplot as plt

# Data for the bar chart
categories = ['Product A', 'Product B', 'Product C', 'Product D']
values = [150, 220, 180, 300]

# Calculate percentages
total = sum(values)
percentages = [value / total * 100 for value in values]

# Create the bar chart
fig, ax = plt.subplots(figsize=(12, 7))
bars = ax.bar(categories, values, color='skyblue', edgecolor='navy')

# Add customized percentage labels above each bar
for i, (bar, percentage) in enumerate(zip(bars, percentages)):
    height = bar.get_height()
    ax.text(bar.get_x() + bar.get_width() / 2, height,
            f'{percentage:.1f}%',
            ha='center', va='bottom',
            fontsize=12, fontweight='bold', color='navy')

# Customize the chart
ax.set_title('Sales Distribution - how2matplotlib.com', fontsize=16)
ax.set_ylabel('Sales (in thousands)', fontsize=14)
ax.set_ylim(0, max(values) * 1.1)
ax.tick_params(axis='both', which='major', labelsize=12)

plt.show()
Output:
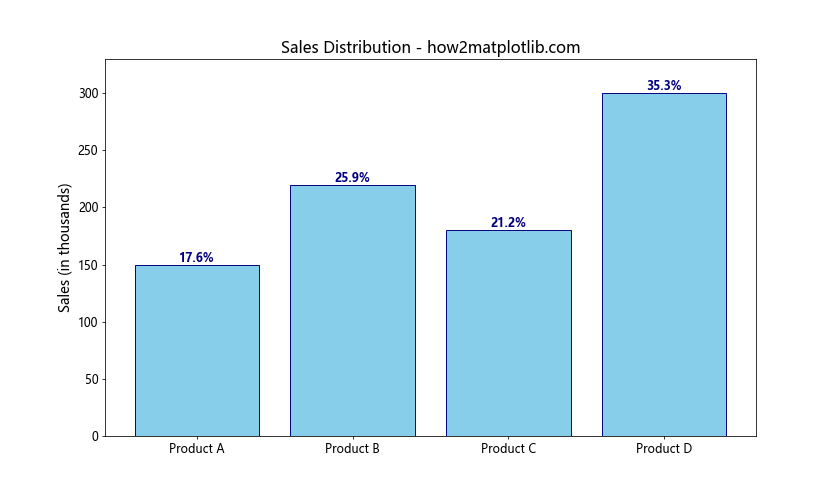
In this example, we’ve customized the label appearance by adjusting the font size, weight, and color. We’ve also improved the overall chart aesthetics by modifying the bar colors and chart title.
Handling Negative Values
When you display percentage above bar chart in Matplotlib, you may encounter scenarios where some values are negative. In such cases, you’ll need to adjust the label positioning to ensure they’re visible. Here’s an example of how to handle negative values:
import matplotlib.pyplot as plt
import numpy as np

# Data for the bar chart
categories = ['Q1', 'Q2', 'Q3', 'Q4']
values = [30, -15, 45, -10]

# Calculate percentages
total = sum(abs(val) for val in values)
percentages = [abs(val) / total * 100 for val in values]

# Create the bar chart
fig, ax = plt.subplots(figsize=(10, 6))
bars = ax.bar(categories, values, color=['green' if v >= 0 else 'red' for v in values])

# Add percentage labels above or below each bar
for i, (bar, percentage) in enumerate(zip(bars, percentages)):
    height = bar.get_height()
    y_pos = height if height >= 0 else height - 5
    va = 'bottom' if height >= 0 else 'top'
    ax.text(bar.get_x() + bar.get_width() / 2, y_pos,
            f'{percentage:.1f}%',
            ha='center', va=va)

# Customize the chart
ax.set_title('Quarterly Profit/Loss - how2matplotlib.com')
ax.set_ylabel('Profit/Loss (in thousands)')
ax.axhline(y=0, color='black', linestyle='-', linewidth=0.5)
ax.set_ylim(min(values) * 1.1, max(values) * 1.1)

plt.show()
Output:
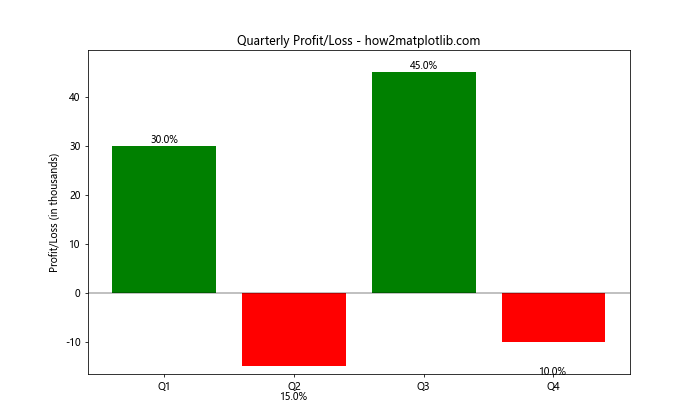
In this example, we’ve adjusted the label positioning based on whether the value is positive or negative. We’ve also used different colors for positive and negative bars to enhance visual clarity.
Displaying Percentage Above Stacked Bar Chart
Another common scenario when you display percentage above bar chart in Matplotlib is working with stacked bar charts. Here’s an example of how to add percentage labels to a stacked bar chart:
import matplotlib.pyplot as plt
import numpy as np

# Data for the stacked bar chart
categories = ['Product A', 'Product B', 'Product C', 'Product D']
values1 = [20, 35, 30, 25]
values2 = [15, 25, 20, 30]
values3 = [10, 15, 25, 20]

# Calculate percentages
totals = [sum(x) for x in zip(values1, values2, values3)]
percentages1 = [v1 / total * 100 for v1, total in zip(values1, totals)]
percentages2 = [v2 / total * 100 for v2, total in zip(values2, totals)]
percentages3 = [v3 / total * 100 for v3, total in zip(values3, totals)]

# Create the stacked bar chart
fig, ax = plt.subplots(figsize=(12, 7))
bar1 = ax.bar(categories, values1, label='Type 1')
bar2 = ax.bar(categories, values2, bottom=values1, label='Type 2')
bar3 = ax.bar(categories, values3, bottom=np.array(values1) + np.array(values2), label='Type 3')

# Add percentage labels to each segment
def add_labels(bars, percentages):
    for bar, percentage in zip(bars, percentages):
        height = bar.get_height()
        ax.text(bar.get_x() + bar.get_width() / 2, bar.get_y() + height / 2,
                f'{percentage:.1f}%',
                ha='center', va='center', fontsize=10, fontweight='bold', color='white')

add_labels(bar1, percentages1)
add_labels(bar2, percentages2)
add_labels(bar3, percentages3)

# Customize the chart
ax.set_title('Product Distribution by Type - how2matplotlib.com', fontsize=16)
ax.set_ylabel('Quantity', fontsize=14)
ax.legend(fontsize=12)
ax.set_ylim(0, max(totals) * 1.1)

plt.show()
Output:
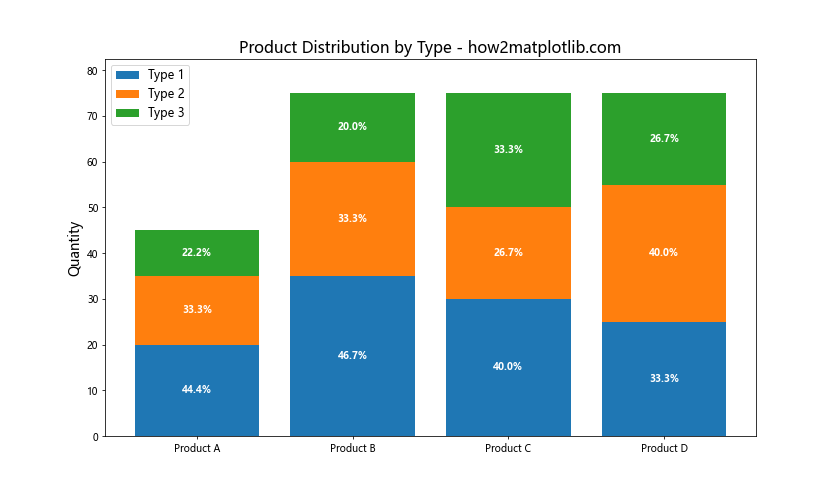
In this example, we’ve created a stacked bar chart and added percentage labels to each segment. The labels are positioned in the center of each bar segment for better readability.
Optimizing Label Placement When You Display Percentage Above Bar Chart in Matplotlib
When you display percentage above bar chart in Matplotlib, it’s crucial to ensure that the labels are clearly visible and don’t overlap with other elements of the chart. Here are some techniques to optimize label placement:
Adjusting Label Position Based on Bar Height
For bars with small values, placing the label directly above the bar might cause it to overlap with other bars or labels. Here’s an example of how to adjust label position based on bar height:
import matplotlib.pyplot as plt

# Data for the bar chart
categories = ['A', 'B', 'C', 'D', 'E', 'F', 'G', 'H']
values = [5, 25, 50, 20, 35, 10, 45, 15]

# Calculate percentages
total = sum(values)
percentages = [value / total * 100 for value in values]

# Create the bar chart
fig, ax = plt.subplots(figsize=(12, 7))
bars = ax.bar(categories, values)

# Add percentage labels with adjusted positions
for i, (bar, percentage) in enumerate(zip(bars, percentages)):
    height = bar.get_height()
    if height < max(values) * 0.1:  # If bar is less than 10% of max height
        y_pos = height + max(values) * 0.02  # Place label slightly above the bar
        va = 'bottom'
    else:
        y_pos = height * 0.9  # Place label inside the bar
        va = 'top'

    ax.text(bar.get_x() + bar.get_width() / 2, y_pos,
            f'{percentage:.1f}%',
            ha='center', va=va, fontsize=10, fontweight='bold')

# Customize the chart
ax.set_title('Value Distribution - how2matplotlib.com', fontsize=16)
ax.set_ylabel('Values', fontsize=14)
ax.set_ylim(0, max(values) * 1.15)  # Add extra space for labels

plt.show()
Output:
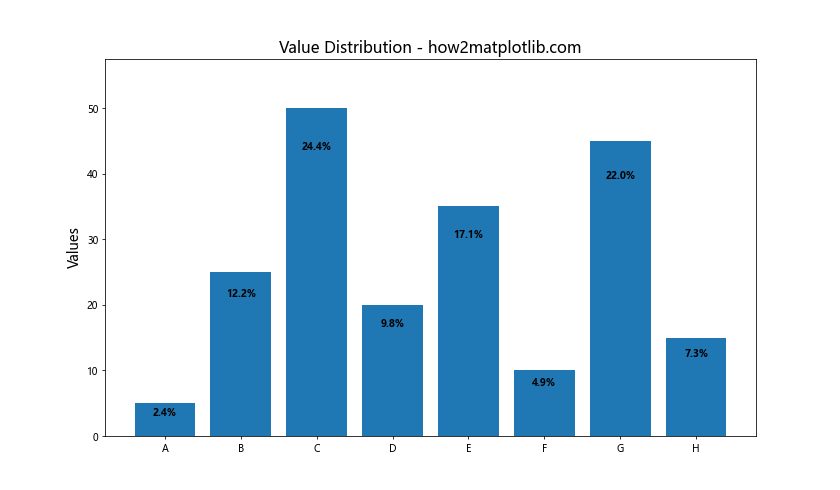
In this example, we've adjusted the label position based on the bar height. For shorter bars, the labels are placed above the bar, while for taller bars, the labels are placed inside the bar near the top.
Rotating Labels for Better Fit
When you have many bars or long category names, rotating the labels can help prevent overlap. Here's an example of how to rotate labels when you display percentage above bar chart in Matplotlib:
import matplotlib.pyplot as plt

# Data for the bar chart
categories = ['Category A', 'Category B', 'Category C', 'Category D', 'Category E',
              'Category F', 'Category G', 'Category H', 'Category I', 'Category J']
values = [15, 30, 25, 20, 35, 27, 22, 18, 33, 28]

# Calculate percentages
total = sum(values)
percentages = [value / total * 100 for value in values]

# Create the bar chart
fig, ax = plt.subplots(figsize=(14, 8))
bars = ax.bar(categories, values)

# Add rotated percentage labels above each bar
for i, (bar, percentage) in enumerate(zip(bars, percentages)):
    height = bar.get_height()
    ax.text(bar.get_x() + bar.get_width() / 2, height,
            f'{percentage:.1f}%',
            ha='center', va='bottom', rotation=45, fontsize=10)

# Customize the chart
ax.set_title('Category Distribution - how2matplotlib.com', fontsize=16)
ax.set_ylabel('Values', fontsize=14)
ax.set_ylim(0, max(values) * 1.2)  # Add extra space for rotated labels
plt.xticks(rotation=45, ha='right')  # Rotate x-axis labels for better fit
plt.tight_layout()  # Adjust layout to prevent label cutoff

plt.show()
Output:
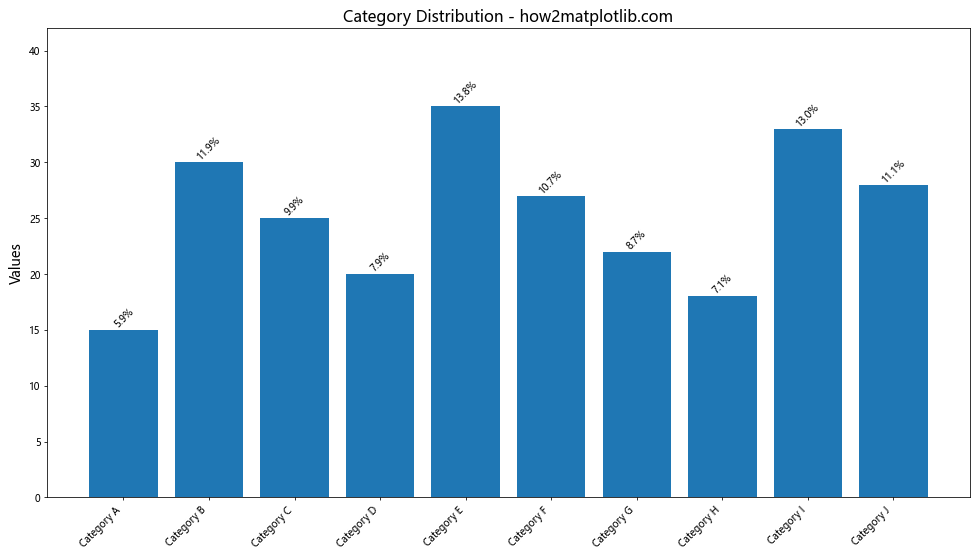
In this example, we've rotated both the percentage labels and the x-axis category labels to prevent overlap and improve readability.
Enhancing Visualization with Color-Coded Percentages
When you display percentage above bar chart in Matplotlib, using color-coded percentages can add an extra layer of information to your visualization. Here's an example of how to implement color-coded percentage labels:
import matplotlib.pyplot as plt
import matplotlib.colors as mcolors

# Data for the bar chart
categories = ['Product A', 'Product B', 'Product C', 'Product D', 'Product E']
values = [120, 250, 180, 310, 220]

# Calculate percentages
total = sum(values)
percentages = [value / total * 100 for value in values]

# Create a color map
cmap = plt.cm.get_cmap('RdYlGn')  # Red-Yellow-Green color map
norm = mcolors.Normalize(vmin=min(percentages), vmax=max(percentages))

# Create the bar chart
fig, ax = plt.subplots(figsize=(12, 7))
bars = ax.bar(categories, values, color=[cmap(norm(p)) for p in percentages])

# Add color-coded percentage labels above each bar
for i, (bar, percentage) in enumerate(zip(bars, percentages)):
    height = bar.get_height()
    ax.text(bar.get_x() + bar.get_width() / 2, height,
            f'{percentage:.1f}%',
            ha='center', va='bottom',
            color=cmap(norm(percentage)),
            fontsize=12, fontweight='bold')

# Customize the chart
ax.set_title('Product Sales Distribution - how2matplotlib.com', fontsize=16)
ax.set_ylabel('Sales (in thousands)', fontsize=14)
ax.set_ylim(0, max(values) * 1.1)

# Add a color bar
sm = plt.cm.ScalarMappable(cmap=cmap, norm=norm)
sm.set_array([])
cbar = plt.colorbar(sm)
cbar.set_label('Percentage', fontsize=12)

plt.show()
In this example, we've used a color map to assign colors to both the bars and the percentage labels based on their values. This technique helps to quickly identify high and low percentages in the dataset.
Handling Large Datasets When You Display Percentage Above Bar Chart in Matplotlib
When working with large datasets, displaying percentage above bar chart in Matplotlib can become challenging due to overcrowding. Here are some strategies to handle large datasets effectively:
Grouping and Aggregating Data
For large datasets, it's often helpful to group and aggregate data before visualization. Here's an example of how to display percentage above bar chart in Matplotlib for grouped data:
import matplotlib.pyplot as plt
import pandas as pd
import numpy as np

# Generate sample data
np.random.seed(42)
data = pd.DataFrame({
    'Category': np.random.choice(['A', 'B', 'C', 'D', 'E'], 1000),
    'Value': np.random.randint(1, 100, 1000)
})

# Group and aggregate data
grouped_data = data.groupby('Category')['Value'].sum().sort_values(ascending=False)

# Calculate percentages
total = grouped_data.sum()
percentages = (grouped_data / total * 100).round(1)

# Create the bar chart
fig, ax = plt.subplots(figsize=(12, 7))
bars = ax.bar(grouped_data.index, grouped_data.values)

# Add percentage labels above each bar
for i, (bar, percentage) in enumerate(zip(bars, percentages)):
    height = bar.get_height()
    ax.text(bar.get_x() + bar.get_width() / 2, height,
            f'{percentage:.1f}%',
            ha='center', va='bottom',
            fontsize=12, fontweight='bold')

# Customize the chart
ax.set_title('Aggregated Category Distribution - how2matplotlib.com', fontsize=16)
ax.set_ylabel('Total Value', fontsize=14)
ax.set_ylim(0, max(grouped_data) * 1.1)

plt.show()
Output:
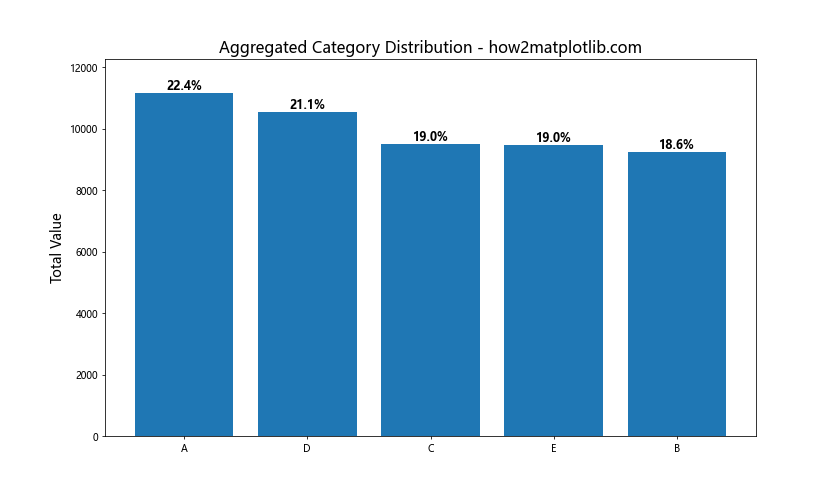
In this example, we've grouped and aggregated a large dataset before creating the bar chart. This approach helps to display percentage above bar chart in Matplotlib more effectively for large datasets.
Using Horizontal Bar Charts for Better Readability
When dealing with many categories, horizontal bar charts can provide better readability. Here's how to display percentage above bar chart in Matplotlib using a horizontal layout:
import matplotlib.pyplot as plt
import pandas as pd
import numpy as np

# Generate sample data
np.random.seed(42)
data = pd.DataFrame({
    'Category': [f'Category {i}' for i in range(1, 21)],
    'Value': np.random.randint(100, 1000, 20)
})

# Sort data by value
data_sorted = data.sort_values('Value', ascending=True)

# Calculate percentages
total = data_sorted['Value'].sum()
data_sorted['Percentage'] = (data_sorted['Value'] / total * 100).round(1)

# Create the horizontal bar chart
fig, ax = plt.subplots(figsize=(12, 10))
bars = ax.barh(data_sorted['Category'], data_sorted['Value'])

# Add percentage labels to the right of each bar
for i, (value, percentage) in enumerate(zip(data_sorted['Value'], data_sorted['Percentage'])):
    ax.text(value, i, f' {percentage}%',
            va='center', fontsize=10, fontweight='bold')

# Customize the chart
ax.set_title('Category Distribution (Horizontal) - how2matplotlib.com', fontsize=16)
ax.set_xlabel('Value', fontsize=14)
ax.set_xlim(0, max(data_sorted['Value']) * 1.1)

plt.tight_layout()
plt.show()
Output:
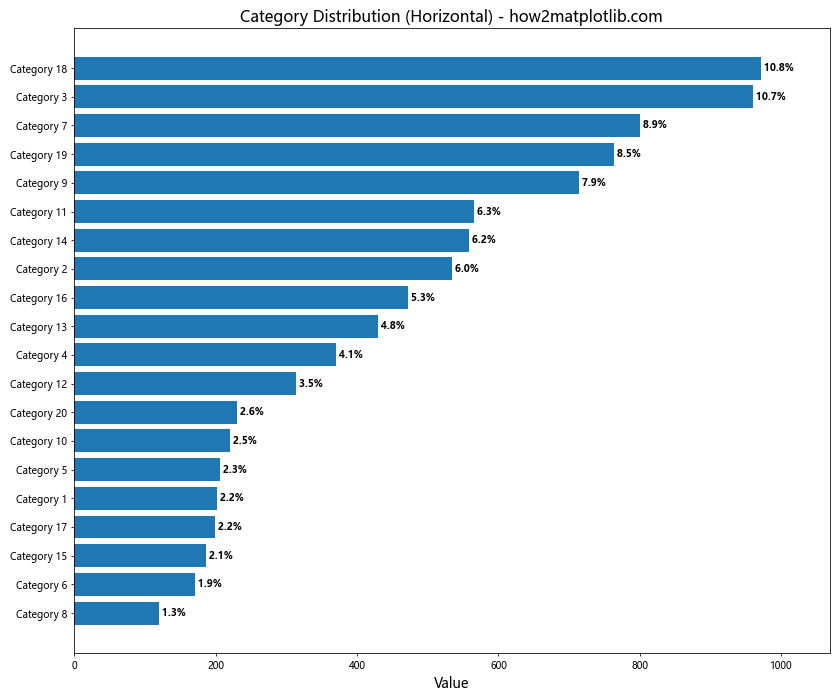
This example demonstrates how to create a horizontal bar chart with percentage labels, which can be more effective for datasets with many categories.
Advanced Customization Techniques to Display Percentage Above Bar Chart in Matplotlib
To further enhance your visualizations when you display percentage above bar chart in Matplotlib, consider these advanced customization techniques:
Adding Data Labels and Percentages
Sometimes, you may want to display both the actual values and percentages on your bar chart. Here's an example of how to achieve this:
import matplotlib.pyplot as plt

# Data for the bar chart
categories = ['Product A', 'Product B', 'Product C', 'Product D']
values = [320, 480, 290, 410]

# Calculate percentages
total = sum(values)
percentages = [value / total * 100 for value in values]

# Create the bar chart
fig, ax = plt.subplots(figsize=(12, 7))
bars = ax.bar(categories, values, color='lightblue', edgecolor='navy')

# Add value labels and percentages above each bar
for i, (bar, value, percentage) in enumerate(zip(bars, values, percentages)):
    height = bar.get_height()
    ax.text(bar.get_x() + bar.get_width() / 2, height,
            f'{value}\n({percentage:.1f}%)',
            ha='center', va='bottom',
            fontsize=10, fontweight='bold')

# Customize the chart
ax.set_title('Product Sales with Percentages - how2matplotlib.com', fontsize=16)
ax.set_ylabel('Sales (in thousands)', fontsize=14)
ax.set_ylim(0, max(values) * 1.15)

plt.show()
Output:
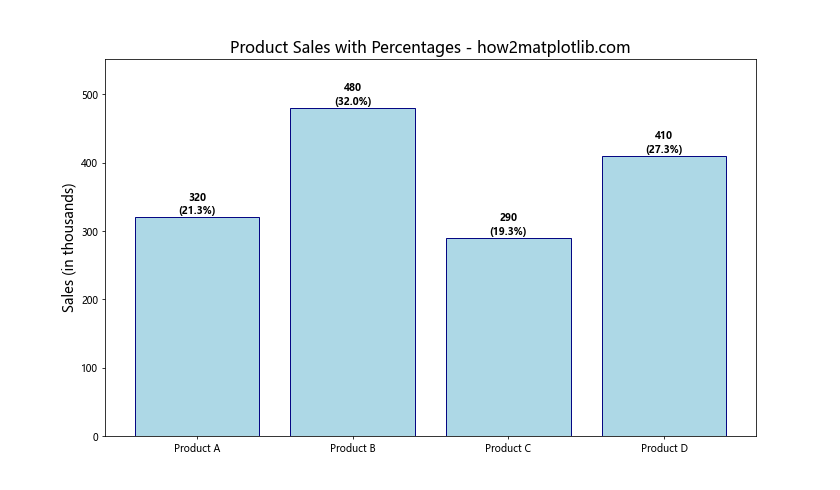
This example shows how to display both the actual values and percentages above each bar, providing a comprehensive view of the data.
Using Gradient Colors for Bars
To make your chart more visually appealing when you display percentage above bar chart in Matplotlib, you can use gradient colors for the bars. Here's an example:
import matplotlib.pyplot as plt
import numpy as np

# Data for the bar chart
categories = ['A', 'B', 'C', 'D', 'E', 'F']
values = [25, 40, 30, 55, 45, 35]

# Calculate percentages
total = sum(values)
percentages = [value / total * 100 for value in values]

# Create a color gradient
colors = plt.cm.viridis(np.linspace(0, 1, len(categories)))

# Create the bar chart
fig, ax = plt.subplots(figsize=(12, 7))
bars = ax.bar(categories, values, color=colors)

# Add percentage labels above each bar
for i, (bar, percentage) in enumerate(zip(bars, percentages)):
    height = bar.get_height()
    ax.text(bar.get_x() + bar.get_width() / 2, height,
            f'{percentage:.1f}%',
            ha='center', va='bottom',
            fontsize=12, fontweight='bold', color='white')

# Customize the chart
ax.set_title('Gradient Color Bar Chart - how2matplotlib.com', fontsize=16)
ax.set_ylabel('Values', fontsize=14)
ax.set_ylim(0, max(values) * 1.1)

# Add a color bar
sm = plt.cm.ScalarMappable(cmap=plt.cm.viridis, norm=plt.Normalize(vmin=0, vmax=len(categories)-1))
sm.set_array([])
cbar = plt.colorbar(sm)
cbar.set_label('Category Index', fontsize=12)

plt.show()
This example uses a gradient color scheme for the bars, adding visual interest to the chart while still effectively displaying percentages.
Best Practices for Displaying Percentage Above Bar Chart in Matplotlib
To ensure your visualizations are effective and professional, follow these best practices when you display percentage above bar chart in Matplotlib:
- Consistent Formatting: Use consistent formatting for percentage labels across all your charts.
Appropriate Decimal Places: Display percentages with an appropriate number of decimal places, usually one or two.
Legible Font Size: Ensure that the percentage labels are large enough to be easily read.
Color Contrast: Use colors that provide sufficient contrast between the bars, labels, and background.
Avoid Overcrowding: If you have many categories, consider using horizontal bar charts or grouping data.
Include a Legend: When using color-coding or multiple data series, always include a legend.
Meaningful Titles and Labels: Use clear, descriptive titles and axis labels to provide context.
Data Ordering: Consider ordering your data (e.g., from highest to lowest) for better interpretation.
Responsive Design: Ensure your charts are responsive and look good on different screen sizes.
Accessibility: Consider color-blind friendly color schemes and include alternative text for screen readers.
Troubleshooting Common Issues When You Display Percentage Above Bar Chart in Matplotlib
When you display percentage above bar chart in Matplotlib, you may encounter some common issues. Here are some problems and their solutions: