How to Create Multiple Boxplots on the Same Graph from a Dictionary Using Matplotlib
Creating Multiple Boxplots on the Same Graph from a Dictionary is a powerful visualization technique that allows you to compare distributions of multiple datasets side by side. This article will guide you through the process of creating multiple boxplots using Matplotlib, a popular Python plotting library. We’ll explore various aspects of this technique, including data preparation, customization options, and advanced features.
Understanding Boxplots and Their Importance
Before diving into Creating Multiple Boxplots on the Same Graph from a Dictionary, let’s first understand what boxplots are and why they are useful. Boxplots, also known as box-and-whisker plots, are a standardized way of displaying the distribution of data based on a five-number summary: minimum, first quartile, median, third quartile, and maximum. They are particularly useful for comparing distributions across multiple groups or categories.
When Creating Multiple Boxplots on the Same Graph from a Dictionary, you can easily compare these statistical measures across different datasets or categories. This visualization technique is especially valuable when dealing with large datasets or when you need to identify outliers, skewness, or differences in variability between groups.
Let’s start with a simple example of Creating Multiple Boxplots on the Same Graph from a Dictionary:
import matplotlib.pyplot as plt
import numpy as np

# Sample data dictionary
data = {
    'Group A': np.random.normal(0, 1, 100),
    'Group B': np.random.normal(1, 1.5, 100),
    'Group C': np.random.normal(-1, 2, 100)
}

# Creating multiple boxplots
fig, ax = plt.subplots(figsize=(10, 6))
ax.boxplot(data.values())
ax.set_xticklabels(data.keys())
ax.set_title('Multiple Boxplots on the Same Graph from a Dictionary - how2matplotlib.com')
ax.set_ylabel('Values')
plt.show()
Output:
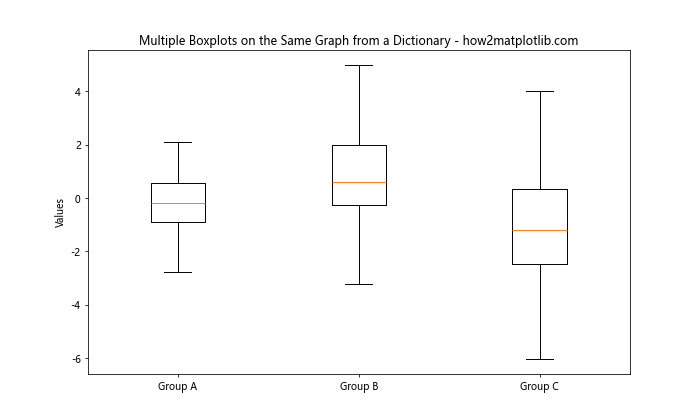
In this example, we create a dictionary containing three groups of data and use Matplotlib’s boxplot function to create multiple boxplots on the same graph. The data.values() method is used to pass the data to the boxplot function, while data.keys() is used to set the x-axis labels.
Preparing Data for Creating Multiple Boxplots on the Same Graph from a Dictionary
When Creating Multiple Boxplots on the Same Graph from a Dictionary, it’s crucial to have your data properly organized. The most common format is a dictionary where keys represent group names or categories, and values are lists or arrays of numerical data for each group.
Here’s an example of how to prepare your data:
import numpy as np

# Creating a dictionary with sample data
data = {
    'Category A': np.random.normal(0, 1, 100),
    'Category B': np.random.exponential(2, 100),
    'Category C': np.random.uniform(-3, 3, 100),
    'Category D': np.random.lognormal(0, 0.5, 100)
}

print("Data prepared for Creating Multiple Boxplots on the Same Graph from a Dictionary - how2matplotlib.com")
print(data.keys())
Output:

In this example, we create a dictionary with four categories, each containing 100 data points generated from different distributions. This diverse dataset will help us demonstrate the power of Creating Multiple Boxplots on the Same Graph from a Dictionary in comparing various distributions.
Basic Technique for Creating Multiple Boxplots on the Same Graph from a Dictionary
Now that we have our data prepared, let’s explore the basic technique for Creating Multiple Boxplots on the Same Graph from a Dictionary using Matplotlib:
import matplotlib.pyplot as plt
import numpy as np

# Sample data
data = {
    'Group 1': np.random.normal(0, 1, 100),
    'Group 2': np.random.normal(2, 1.5, 100),
    'Group 3': np.random.normal(-1, 2, 100),
    'Group 4': np.random.normal(1, 1, 100)
}

# Creating multiple boxplots
fig, ax = plt.subplots(figsize=(12, 6))
box_plot = ax.boxplot(data.values(), patch_artist=True)

# Customizing the plot
ax.set_xticklabels(data.keys())
ax.set_title('Creating Multiple Boxplots on the Same Graph from a Dictionary - how2matplotlib.com')
ax.set_ylabel('Values')

# Adding a grid for better readability
ax.yaxis.grid(True)

plt.show()
Output:
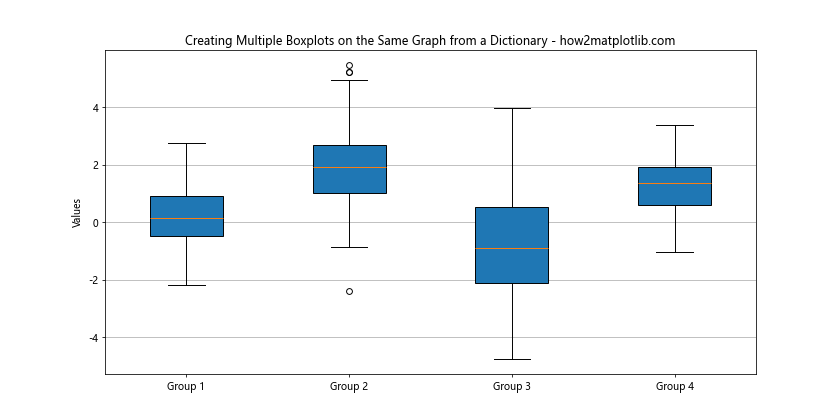
In this example, we use the boxplot function to create multiple boxplots on the same graph. The patch_artist=True parameter allows us to customize the appearance of the boxes later. We set the x-axis labels using the dictionary keys and add a title and y-axis label to the plot.
Customizing Colors When Creating Multiple Boxplots on the Same Graph from a Dictionary
One of the advantages of Creating Multiple Boxplots on the Same Graph from a Dictionary is the ability to customize the appearance of each boxplot. Let’s explore how to add colors to our boxplots:
import matplotlib.pyplot as plt
import numpy as np

# Sample data
data = {
    'Set A': np.random.normal(0, 1, 100),
    'Set B': np.random.normal(2, 1.5, 100),
    'Set C': np.random.normal(-1, 2, 100),
    'Set D': np.random.normal(1, 1, 100)
}

# Colors for each boxplot
colors = ['lightblue', 'lightgreen', 'lightpink', 'lightyellow']

# Creating multiple boxplots
fig, ax = plt.subplots(figsize=(12, 6))
box_plot = ax.boxplot(data.values(), patch_artist=True)

# Customizing colors
for patch, color in zip(box_plot['boxes'], colors):
    patch.set_facecolor(color)

# Customizing the plot
ax.set_xticklabels(data.keys())
ax.set_title('Colored Multiple Boxplots on the Same Graph from a Dictionary - how2matplotlib.com')
ax.set_ylabel('Values')

plt.show()
Output:
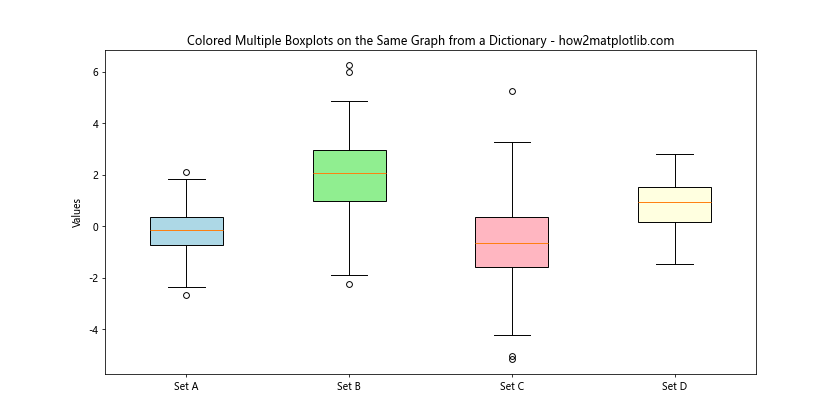
In this example, we define a list of colors and use them to customize the face color of each boxplot. This technique enhances the visual distinction between different groups when Creating Multiple Boxplots on the Same Graph from a Dictionary.
Adding Statistical Annotations When Creating Multiple Boxplots on the Same Graph from a Dictionary
When Creating Multiple Boxplots on the Same Graph from a Dictionary, it can be helpful to add statistical annotations to provide more context. Let’s see how to add mean values to our boxplots:
import matplotlib.pyplot as plt
import numpy as np

# Sample data
data = {
    'Group X': np.random.normal(0, 1, 100),
    'Group Y': np.random.normal(2, 1.5, 100),
    'Group Z': np.random.normal(-1, 2, 100)
}

# Creating multiple boxplots
fig, ax = plt.subplots(figsize=(12, 6))
box_plot = ax.boxplot(data.values(), patch_artist=True)

# Customizing the plot
ax.set_xticklabels(data.keys())
ax.set_title('Multiple Boxplots with Mean Values - how2matplotlib.com')
ax.set_ylabel('Values')

# Adding mean values
for i, (name, values) in enumerate(data.items()):
    mean = np.mean(values)
    ax.text(i+1, mean, f'Mean: {mean:.2f}', ha='center', va='bottom')
    ax.plot(i+1, mean, 'ro')  # Red dot for mean

plt.show()
Output:
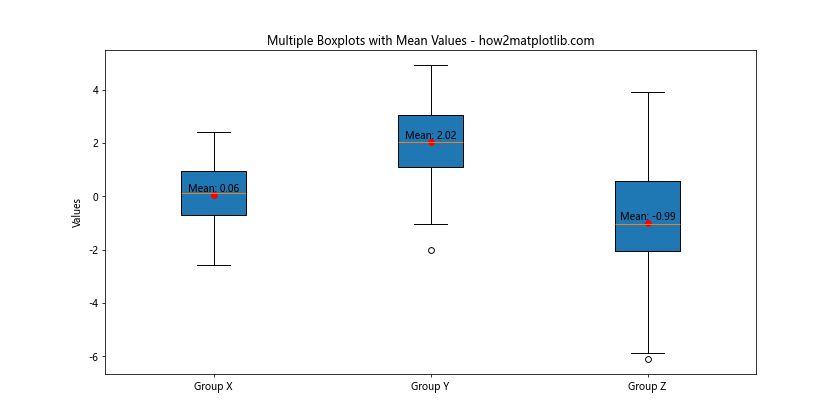
In this example, we calculate the mean for each group and add it as a text annotation and a red dot on the plot. This additional information enhances the interpretability of the boxplots when Creating Multiple Boxplots on the Same Graph from a Dictionary.
Handling Outliers When Creating Multiple Boxplots on the Same Graph from a Dictionary
Outliers can significantly affect the appearance of boxplots. When Creating Multiple Boxplots on the Same Graph from a Dictionary, you might want to customize how outliers are displayed. Let’s explore this:
import matplotlib.pyplot as plt
import numpy as np

# Sample data with outliers
data = {
    'Dataset 1': np.concatenate([np.random.normal(0, 1, 95), np.random.normal(0, 5, 5)]),
    'Dataset 2': np.concatenate([np.random.normal(2, 1.5, 97), np.random.normal(2, 7, 3)]),
    'Dataset 3': np.concatenate([np.random.normal(-1, 2, 98), np.random.normal(-1, 10, 2)])
}

# Creating multiple boxplots
fig, ax = plt.subplots(figsize=(12, 6))
box_plot = ax.boxplot(data.values(), patch_artist=True, showfliers=False)

# Plotting outliers separately
for i, (name, values) in enumerate(data.items()):
    outliers = [x for x in values if x < np.percentile(values, 25) - 1.5 * (np.percentile(values, 75) - np.percentile(values, 25))
                or x > np.percentile(values, 75) + 1.5 * (np.percentile(values, 75) - np.percentile(values, 25))]
    ax.scatter([i+1] * len(outliers), outliers, color='red', alpha=0.5)

# Customizing the plot
ax.set_xticklabels(data.keys())
ax.set_title('Multiple Boxplots with Custom Outlier Handling - how2matplotlib.com')
ax.set_ylabel('Values')

plt.show()
Output:
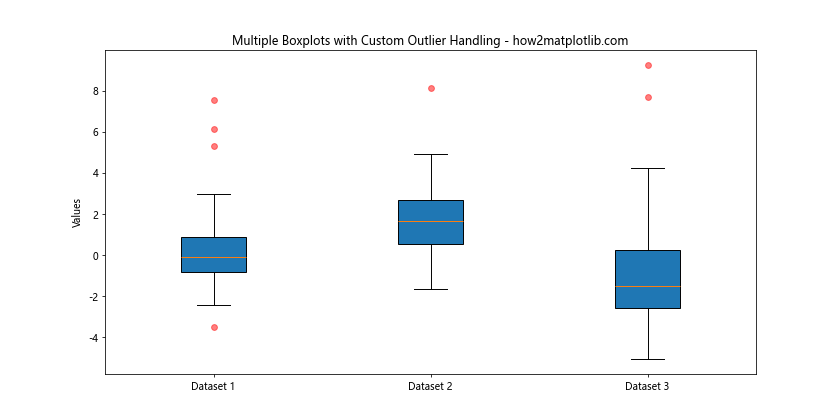
In this example, we use showfliers=False to hide the default outlier markers, and then manually plot the outliers as red, semi-transparent scatter points. This approach gives you more control over the appearance of outliers when Creating Multiple Boxplots on the Same Graph from a Dictionary.
Creating Horizontal Boxplots When Creating Multiple Boxplots on the Same Graph from a Dictionary
While vertical boxplots are common, horizontal boxplots can be useful in certain situations, especially when dealing with long category names. Here’s how to create horizontal boxplots when Creating Multiple Boxplots on the Same Graph from a Dictionary:
import matplotlib.pyplot as plt
import numpy as np

# Sample data
data = {
    'Long Category Name 1': np.random.normal(0, 1, 100),
    'Long Category Name 2': np.random.normal(2, 1.5, 100),
    'Long Category Name 3': np.random.normal(-1, 2, 100),
    'Long Category Name 4': np.random.normal(1, 1, 100)
}

# Creating horizontal multiple boxplots
fig, ax = plt.subplots(figsize=(12, 8))
box_plot = ax.boxplot(data.values(), patch_artist=True, vert=False)

# Customizing the plot
ax.set_yticklabels(data.keys())
ax.set_title('Horizontal Multiple Boxplots on the Same Graph from a Dictionary - how2matplotlib.com')
ax.set_xlabel('Values')

# Adding a grid for better readability
ax.xaxis.grid(True)

plt.show()
Output:
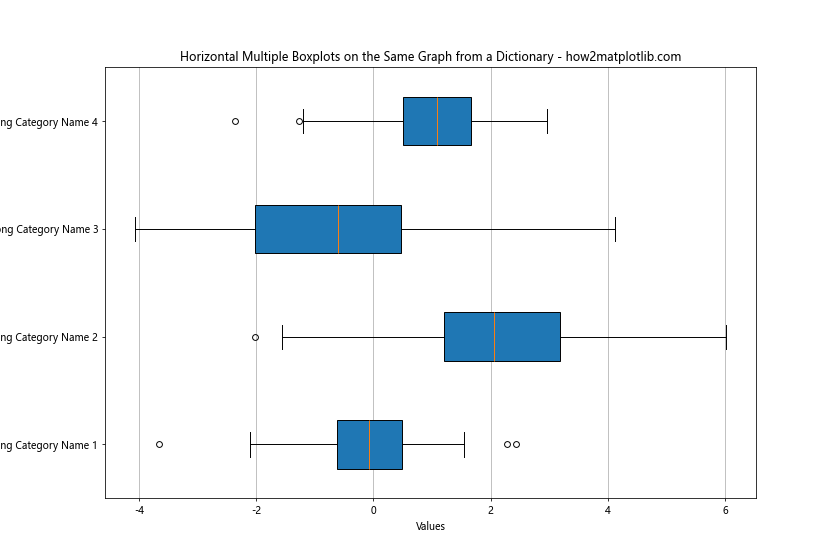
In this example, we use vert=False to create horizontal boxplots. We also switch to set_yticklabels for category names and use set_xlabel instead of set_ylabel. This orientation can be particularly useful when Creating Multiple Boxplots on the Same Graph from a Dictionary with long category names.
Adding a Legend When Creating Multiple Boxplots on the Same Graph from a Dictionary
When Creating Multiple Boxplots on the Same Graph from a Dictionary, adding a legend can improve the readability of your plot, especially when you’ve customized the colors. Here’s how to add a legend:
import matplotlib.pyplot as plt
import numpy as np

# Sample data
data = {
    'Group A': np.random.normal(0, 1, 100),
    'Group B': np.random.normal(2, 1.5, 100),
    'Group C': np.random.normal(-1, 2, 100),
    'Group D': np.random.normal(1, 1, 100)
}

# Colors for each boxplot
colors = ['lightblue', 'lightgreen', 'lightpink', 'lightyellow']

# Creating multiple boxplots
fig, ax = plt.subplots(figsize=(12, 6))
box_plot = ax.boxplot(data.values(), patch_artist=True)

# Customizing colors and creating legend handles
legend_elements = []
for patch, color, (name, values) in zip(box_plot['boxes'], colors, data.items()):
    patch.set_facecolor(color)
    legend_elements.append(plt.Rectangle((0,0),1,1, facecolor=color, edgecolor='black', label=name))

# Customizing the plot
ax.set_xticklabels(data.keys())
ax.set_title('Multiple Boxplots with Legend - how2matplotlib.com')
ax.set_ylabel('Values')

# Adding the legend
ax.legend(handles=legend_elements, loc='upper right')

plt.show()
Output:
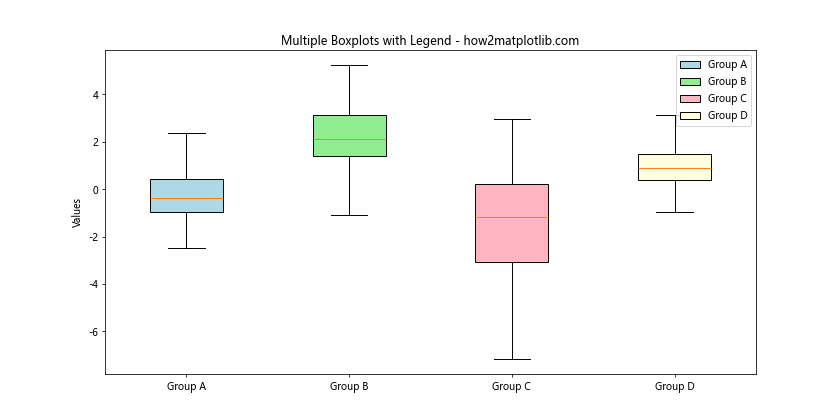
In this example, we create custom legend elements using plt.Rectangle and add them to the plot using ax.legend(). This technique enhances the interpretability of your visualization when Creating Multiple Boxplots on the Same Graph from a Dictionary.
Comparing Distributions with Violin Plots When Creating Multiple Boxplots on the Same Graph from a Dictionary
While boxplots are excellent for showing summary statistics, violin plots can provide more detailed information about the distribution of data. When Creating Multiple Boxplots on the Same Graph from a Dictionary, you might want to consider using violin plots for comparison:
import matplotlib.pyplot as plt
import numpy as np

# Sample data
data = {
    'Distribution A': np.random.normal(0, 1, 1000),
    'Distribution B': np.concatenate([np.random.normal(-1, 0.5, 500), np.random.normal(1, 0.5, 500)]),
    'Distribution C': np.random.exponential(1, 1000),
    'Distribution D': np.random.uniform(-2, 2, 1000)
}

# Creating violin plots
fig, ax = plt.subplots(figsize=(12, 6))
violin_plot = ax.violinplot(data.values(), showmeans=True, showextrema=True, showmedians=True)

# Customizing the plot
ax.set_xticks(range(1, len(data) + 1))
ax.set_xticklabels(data.keys())
ax.set_title('Violin Plots for Comparing Distributions - how2matplotlib.com')
ax.set_ylabel('Values')

plt.show()
Output:
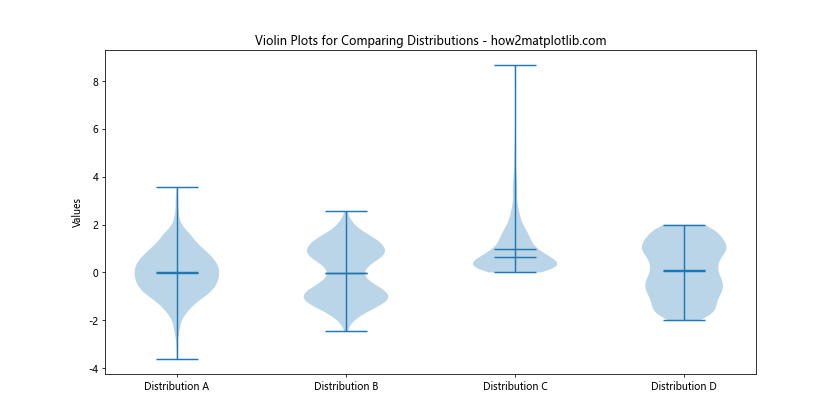
In this example, we use ax.violinplot() instead of ax.boxplot() to create violin plots. Violin plots show the full distribution of the data, which can be particularly useful when dealing with multimodal distributions or when you want to visualize the density of data points at different values.
Combining Boxplots and Scatter Plots When Creating Multiple Boxplots on the Same Graph from a Dictionary
Sometimes, when Creating Multiple Boxplots on the Same Graph from a Dictionary, you might want to show both the summary statistics and the individual data points. Here’s how to combine boxplots with scatter plots:
import matplotlib.pyplot as plt
import numpy as np

# Sample data
data = {
    'Group 1': np.random.normal(0, 1, 30),
    'Group 2': np.random.normal(2, 1.5, 30),
    'Group 3': np.random.normal(-1, 2, 30)
}

# Creating multiple boxplots with scatter plots
fig, ax = plt.subplots(figsize=(12, 6))
box_plot = ax.boxplot(data.values(), patch_artist=True)

# Adding scatter plots
for i, (name, values) in enumerate(data.items()):
    # Add some jitter to the x-axis
    x = np.random.normal(i+1, 0.04, len(values))
    ax.scatter(x, values, alpha=0.5)

# Customizing the plot
ax.set_xticklabels(data.keys())
ax.set_title('Boxplots with Scatter Plots - how2matplotlib.com')
ax.set_ylabel('Values')

plt.show()
Output:
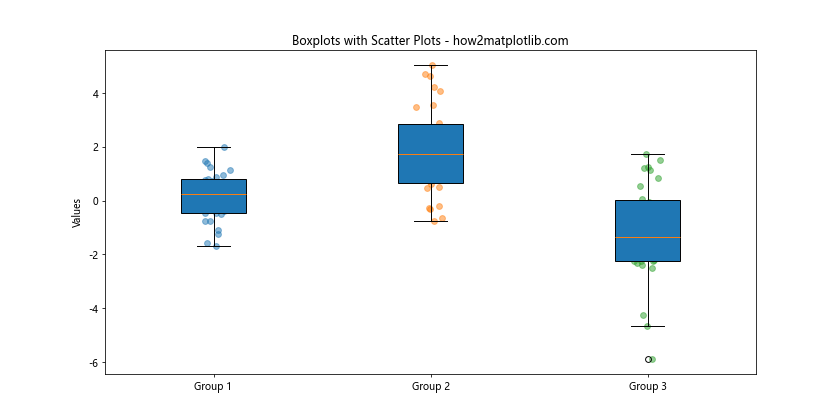
In this example, we first create the boxplots and then overlay scatter plots for each group. We add a small amount of jitter to the x-coordinates of the scatter points to prevent overlapping. This combination provides a comprehensive view of both the distribution and individual data points when Creating Multiple Boxplots on the Same Graph from a Dictionary.
Adding Notches to Boxplots When Creating Multiple Boxplots on the Same Graph from a Dictionary
Notched boxplots can be useful for comparing medians across groups. The notches represent the confidence interval around the median. If the notches of two boxes do not overlap, there is strong evidence that their medians differ. Here’s how to add notches when Creating Multiple Boxplots on the Same Graph from a Dictionary:
import matplotlib.pyplot as plt
import numpy as np

# Sample data
data = {
    'Sample A': np.random.normal(0, 1, 100),
    'Sample B': np.random.normal(0.5, 1, 100),
    'Sample C': np.random.normal(1, 1, 100),
    'Sample D': np.random.normal(1.5, 1, 100)
}

# Creating multiple boxplots with notches
fig, ax = plt.subplots(figsize=(12, 6))
box_plot = ax.boxplot(data.values(), notch=True, patch_artist=True)

# Customizing the plot
ax.set_xticklabels(data.keys())
ax.set_title('Notched Boxplots for Comparing Medians - how2matplotlib.com')
ax.set_ylabel('Values')

plt.show()
Output:
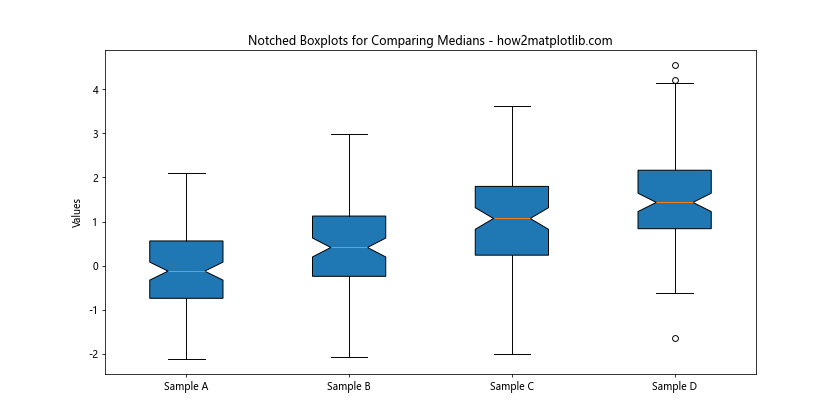
In this example, we use the notch=True parameter in the boxplot function to create notched boxplots. This can be particularly useful when you want to visually compare the medians of different groups when Creating Multiple Boxplots on the Same Graph from a Dictionary.
Creating Grouped Boxplots When Creating Multiple Boxplots on the Same Graph from a Dictionary
Sometimes, you might want to create grouped boxplots to compare multiple variables across different categories. Here’s how to achieve this when Creating Multiple Boxplots on the Same Graph from a Dictionary:
import matplotlib.pyplot as plt
import numpy as np

# Sample data
data = {
    'Category 1': {'A': np.random.normal(0, 1, 100), 'B': np.random.normal(2, 1, 100), 'C': np.random.normal(1, 1, 100)},
    'Category 2': {'A': np.random.normal(1, 1, 100), 'B': np.random.normal(3, 1, 100), 'C': np.random.normal(2, 1, 100)},
    'Category 3': {'A': np.random.normal(2, 1, 100), 'B': np.random.normal(4, 1, 100), 'C': np.random.normal(3, 1, 100)}
}

# Creating grouped boxplots
fig, ax = plt.subplots(figsize=(12, 6))

num_categories = len(data)
num_variables = len(next(iter(data.values())))
positions = np.arange(num_categories) * (num_variables + 1)

for i, (variable, color) in enumerate(zip(['A', 'B', 'C'], ['lightblue', 'lightgreen', 'lightpink'])):
    variable_data = [data[category][variable] for category in data.keys()]
    box_plot = ax.boxplot(variable_data, positions=positions + i, patch_artist=True, widths=0.6)
    for patch in box_plot['boxes']:
        patch.set_facecolor(color)

# Customizing the plot
ax.set_xticks(positions + 1)
ax.set_xticklabels(data.keys())
ax.set_title('Grouped Boxplots - how2matplotlib.com')
ax.set_ylabel('Values')

# Adding a legend
legend_elements = [plt.Rectangle((0,0),1,1, facecolor=color, edgecolor='black', label=var)
                   for var, color in zip(['A', 'B', 'C'], ['lightblue', 'lightgreen', 'lightpink'])]
ax.legend(handles=legend_elements, loc='upper left')

plt.show()
Output:
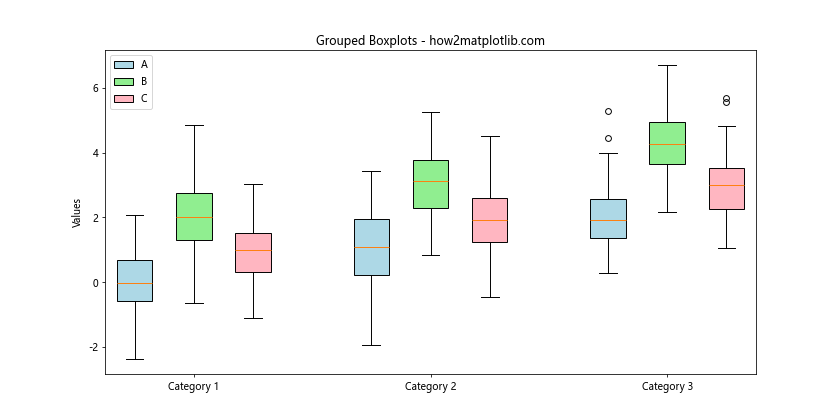
In this example, we create grouped boxplots by carefully positioning each boxplot and using different colors for each variable. This technique allows for easy comparison of multiple variables across different categories when Creating Multiple Boxplots on the Same Graph from a Dictionary.
Adding Statistical Comparisons When Creating Multiple Boxplots on the Same Graph from a Dictionary
When Creating Multiple Boxplots on the Same Graph from a Dictionary, you might want to add statistical comparisons between groups. Here’s an example of how to add significance bars:
import matplotlib.pyplot as plt
import numpy as np
from scipy import stats

# Sample data
data = {
    'Group 1': np.random.normal(0, 1, 100),
    'Group 2': np.random.normal(0.5, 1, 100),
    'Group 3': np.random.normal(1, 1, 100),
    'Group 4': np.random.normal(1.5, 1, 100)
}

# Creating multiple boxplots
fig, ax = plt.subplots(figsize=(12, 6))
box_plot = ax.boxplot(data.values(), patch_artist=True)

# Customizing the plot
ax.set_xticklabels(data.keys())
ax.set_title('Boxplots with Statistical Comparisons - how2matplotlib.com')
ax.set_ylabel('Values')

# Performing t-tests and adding significance bars
def add_significance_bar(start, end, height, p_value):
    ax.plot([start, start, end, end], [height, height+0.05, height+0.05, height], color='black')
    ax.text((start+end)/2, height+0.05, f'p = {p_value:.3f}', ha='center', va='bottom')

groups = list(data.keys())
for i in range(len(groups)):
    for j in range(i+1, len(groups)):
        t_stat, p_value = stats.ttest_ind(data[groups[i]], data[groups[j]])
        add_significance_bar(i+1, j+1, ax.get_ylim()[1], p_value)

plt.show()
Output:
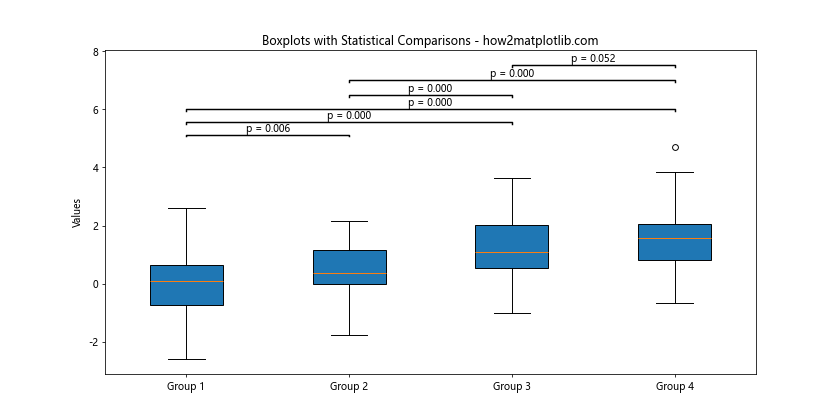
In this example, we perform t-tests between all pairs of groups and add significance bars to the plot. This can be particularly useful when you want to highlight statistical differences between groups when Creating Multiple Boxplots on the Same Graph from a Dictionary.
Handling Large Datasets When Creating Multiple Boxplots on the Same Graph from a Dictionary
When dealing with large datasets, Creating Multiple Boxplots on the Same Graph from a Dictionary can become challenging due to performance issues and visual clutter. Here’s an approach to handle large datasets:
import matplotlib.pyplot as plt
import numpy as np

# Large sample data
data = {f'Group {i}': np.random.normal(i, 1, 10000) for i in range(20)}

# Creating multiple boxplots
fig, ax = plt.subplots(figsize=(15, 6))
box_plot = ax.boxplot(data.values(), patch_artist=True, showfliers=False)

# Customizing the plot
ax.set_xticklabels(data.keys(), rotation=45, ha='right')
ax.set_title('Multiple Boxplots for Large Datasets - how2matplotlib.com')
ax.set_ylabel('Values')

# Adding a colormap
colors = plt.cm.viridis(np.linspace(0, 1, len(data)))
for patch, color in zip(box_plot['boxes'], colors):
    patch.set_facecolor(color)

plt.tight_layout()
plt.show()
Output:
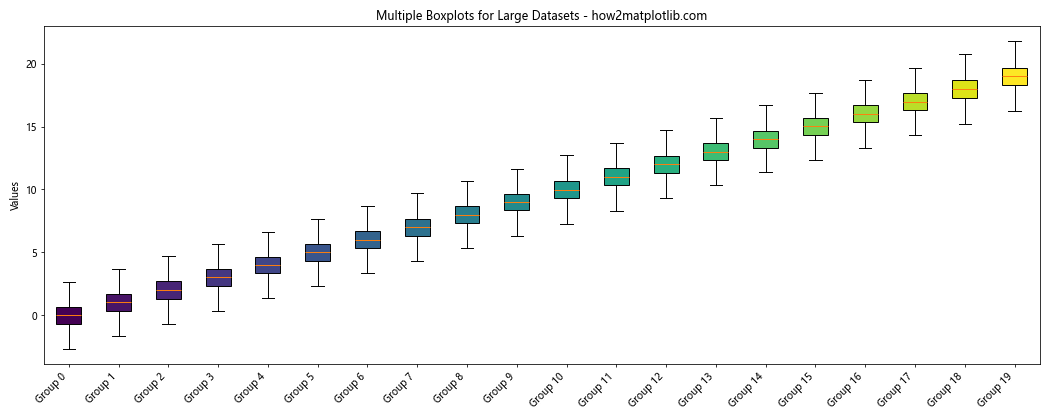
In this example, we use showfliers=False to hide outliers, which can clutter the plot with large datasets. We also use a colormap to distinguish between different groups easily. This approach allows for effective visualization even when Creating Multiple Boxplots on the Same Graph from a Dictionary with large datasets.
Conclusion
Creating Multiple Boxplots on the Same Graph from a Dictionary is a powerful technique for comparing distributions across multiple groups or categories. Throughout this article, we’ve explored various aspects of this visualization method, from basic implementation to advanced customization and handling of large datasets.
We’ve seen how to prepare data, customize colors and styles, add statistical annotations, handle outliers, create horizontal boxplots, add legends, and even combine boxplots with other plot types like scatter plots and violin plots. We’ve also explored how to create grouped boxplots, add statistical comparisons, and create interactive visualizations.