How to Combine Two Boxplots With the Same Axes Using Matplotlib
Combining two boxplots with the same axes is a powerful visualization technique that allows for easy comparison of data distributions. This article will explore various methods and techniques for combining two boxplots with the same axes using Matplotlib, a popular plotting library in Python. We’ll cover everything from basic concepts to advanced customization options, providing you with a comprehensive guide to creating informative and visually appealing combined boxplots.
Understanding Boxplots and Their Importance
Before diving into combining two boxplots with the same axes, let’s first understand what boxplots are and why they are important in data visualization.
A boxplot, also known as a box-and-whisker plot, is a standardized way of displaying the distribution of data based on five summary statistics: minimum, first quartile (Q1), median, third quartile (Q3), and maximum. Boxplots are particularly useful for comparing distributions between different groups or datasets.
When combining two boxplots with the same axes, we can easily compare the distributions of two different datasets or groups side by side. This allows for quick and intuitive visual comparisons of central tendencies, spread, and potential outliers between the two datasets.
Basic Syntax for Combining Two Boxplots With the Same Axes
To start combining two boxplots with the same axes using Matplotlib, we’ll first look at the basic syntax and structure of the code. Here’s a simple example to get us started:
import matplotlib.pyplot as plt
import numpy as np

# Generate sample data
data1 = np.random.normal(0, 1, 100)
data2 = np.random.normal(2, 1.5, 100)

# Create a figure and axis object
fig, ax = plt.subplots(figsize=(8, 6))

# Create the boxplots
ax.boxplot([data1, data2], labels=['Data 1', 'Data 2'])

# Set title and labels
ax.set_title('Combining Two Boxplots With the Same Axes - how2matplotlib.com')
ax.set_xlabel('Datasets')
ax.set_ylabel('Values')

# Show the plot
plt.show()
Output:
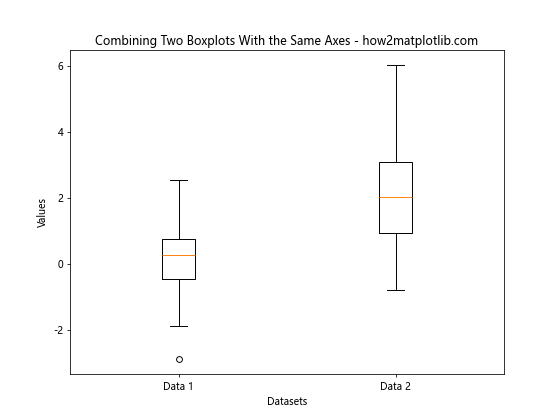
In this example, we’ve created two datasets using NumPy’s random normal distribution. We then use Matplotlib’s boxplot function to create two boxplots side by side on the same axes. The labels parameter is used to provide names for each boxplot.
Customizing Combined Boxplots
When combining two boxplots with the same axes, there are various customization options available to enhance the visual appeal and clarity of your plot. Let’s explore some of these options:
Adding Notches
Notches can be added to the boxplots to provide a visual indication of the confidence interval around the median:
import matplotlib.pyplot as plt
import numpy as np

data1 = np.random.normal(0, 1, 100)
data2 = np.random.normal(2, 1.5, 100)

fig, ax = plt.subplots(figsize=(8, 6))

ax.boxplot([data1, data2], labels=['Data 1', 'Data 2'], notch=True)

ax.set_title('Combined Boxplots with Notches - how2matplotlib.com')
ax.set_xlabel('Datasets')
ax.set_ylabel('Values')

plt.show()
Output:
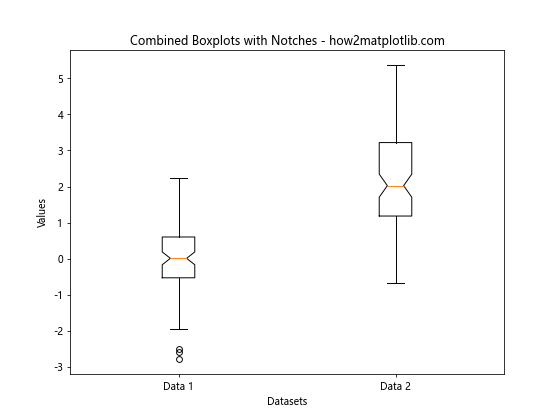
The notch=True parameter adds notches to the boxplots, which can be useful for comparing medians between the two datasets.
Handling Outliers in Combined Boxplots
When combining two boxplots with the same axes, handling outliers effectively is crucial for accurate data representation. Let’s explore some techniques for dealing with outliers:
Showing Outliers as Individual Points
By default, Matplotlib shows outliers as individual points. You can customize the appearance of these points:
import matplotlib.pyplot as plt
import numpy as np

data1 = np.random.normal(0, 1, 100)
data2 = np.random.normal(2, 1.5, 100)

fig, ax = plt.subplots(figsize=(8, 6))

ax.boxplot([data1, data2], labels=['Data 1', 'Data 2'],
           flierprops=dict(marker='o', markerfacecolor='red', markersize=8))

ax.set_title('Combined Boxplots with Customized Outliers - how2matplotlib.com')
ax.set_xlabel('Datasets')
ax.set_ylabel('Values')

plt.show()
Output:
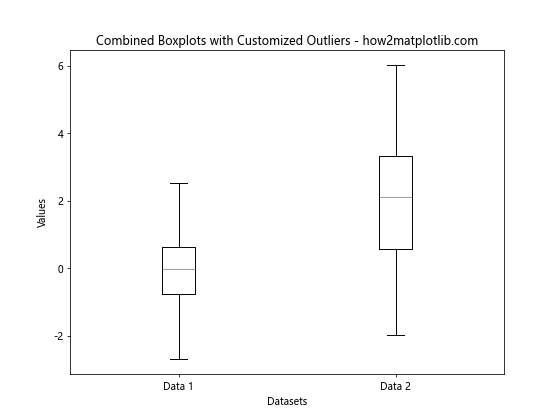
In this example, we’ve customized the outlier points to be red circles with a larger size, making them more visible.
Removing Outliers
In some cases, you may want to remove outliers from your combined boxplots:
import matplotlib.pyplot as plt
import numpy as np

data1 = np.random.normal(0, 1, 100)
data2 = np.random.normal(2, 1.5, 100)

fig, ax = plt.subplots(figsize=(8, 6))

ax.boxplot([data1, data2], labels=['Data 1', 'Data 2'], showfliers=False)

ax.set_title('Combined Boxplots without Outliers - how2matplotlib.com')
ax.set_xlabel('Datasets')
ax.set_ylabel('Values')

plt.show()
Output:
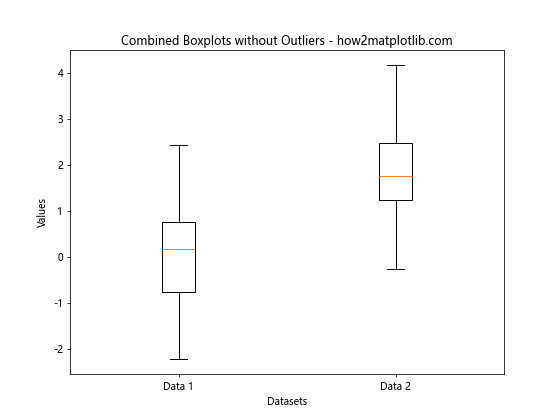
The showfliers=False parameter removes the outlier points from the boxplots, focusing on the main distribution of the data.
Adding Statistical Information to Combined Boxplots
When combining two boxplots with the same axes, it can be helpful to include additional statistical information to provide more context for the data. Here are some ways to add statistical information to your combined boxplots:
Adding Mean Values
You can add mean values to your combined boxplots to complement the median information:
import matplotlib.pyplot as plt
import numpy as np

data1 = np.random.normal(0, 1, 100)
data2 = np.random.normal(2, 1.5, 100)

fig, ax = plt.subplots(figsize=(8, 6))

bp = ax.boxplot([data1, data2], labels=['Data 1', 'Data 2'])

# Add mean values
means = [np.mean(data1), np.mean(data2)]
ax.scatter([1, 2], means, marker='D', color='red', s=50, zorder=3)

ax.set_title('Combined Boxplots with Mean Values - how2matplotlib.com')
ax.set_xlabel('Datasets')
ax.set_ylabel('Values')

plt.show()
Output:
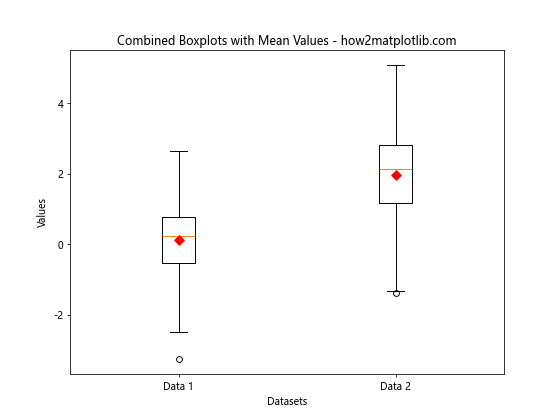
In this example, we’ve added red diamond markers to represent the mean values for each dataset.
Adding Text Annotations
You can add text annotations to provide more detailed statistical information:
import matplotlib.pyplot as plt
import numpy as np

data1 = np.random.normal(0, 1, 100)
data2 = np.random.normal(2, 1.5, 100)

fig, ax = plt.subplots(figsize=(8, 6))

bp = ax.boxplot([data1, data2], labels=['Data 1', 'Data 2'])

# Add statistical annotations
for i, data in enumerate([data1, data2], 1):
    mean = np.mean(data)
    std = np.std(data)
    ax.text(i, ax.get_ylim()[1], f'Mean: {mean:.2f}\nStd: {std:.2f}',
            horizontalalignment='center', verticalalignment='bottom')

ax.set_title('Combined Boxplots with Statistical Annotations - how2matplotlib.com')
ax.set_xlabel('Datasets')
ax.set_ylabel('Values')

plt.show()
Output:
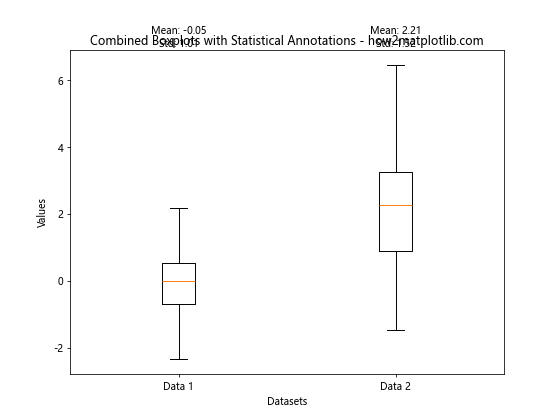
This example adds text annotations above each boxplot, showing the mean and standard deviation for each dataset.
Comparing Multiple Groups Using Combined Boxplots
Combining two boxplots with the same axes can be extended to compare multiple groups or categories. This is particularly useful when you want to visualize the distribution of a variable across different categories or time periods.
Creating Grouped Boxplots
Here’s an example of how to create grouped boxplots for multiple categories:
import matplotlib.pyplot as plt
import numpy as np

# Generate sample data for three categories and two groups
category1 = [np.random.normal(0, 1, 100), np.random.normal(2, 1, 100)]
category2 = [np.random.normal(1, 1.5, 100), np.random.normal(3, 1.5, 100)]
category3 = [np.random.normal(2, 2, 100), np.random.normal(4, 2, 100)]

fig, ax = plt.subplots(figsize=(10, 6))

# Create grouped boxplots
bp1 = ax.boxplot(category1, positions=[1, 2], widths=0.6, patch_artist=True)
bp2 = ax.boxplot(category2, positions=[4, 5], widths=0.6, patch_artist=True)
bp3 = ax.boxplot(category3, positions=[7, 8], widths=0.6, patch_artist=True)

# Customize colors
colors = ['lightblue', 'lightgreen']
for bplot, color in zip([bp1, bp2, bp3], ['lightblue', 'lightgreen', 'lightyellow']):
    for patch in bplot['boxes']:
        patch.set_facecolor(color)

# Set labels and title
ax.set_xticklabels(['Group 1', 'Group 2'] * 3)
ax.set_xticks([1.5, 4.5, 7.5])
ax.set_xticklabels(['Category 1', 'Category 2', 'Category 3'])
ax.set_title('Grouped Boxplots for Multiple Categories - how2matplotlib.com')
ax.set_ylabel('Values')

# Add a legend
ax.legend([bp1["boxes"][0], bp2["boxes"][0], bp3["boxes"][0]],
          ['Category 1', 'Category 2', 'Category 3'],
          loc='upper left')

plt.show()
Output:
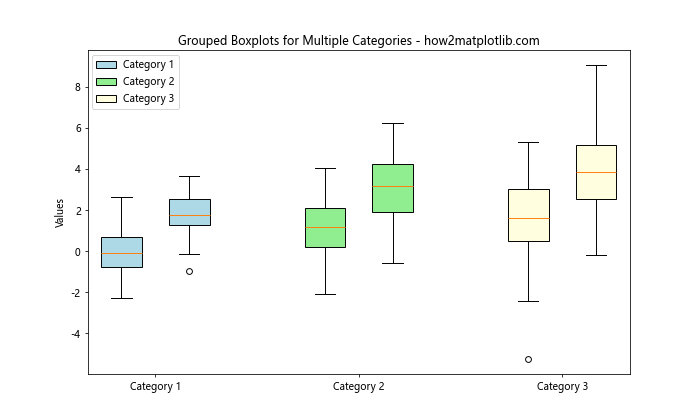
In this example, we’ve created grouped boxplots for three categories, each with two groups. The boxplots are positioned and colored to make it easy to compare both within and between categories.
Combining Boxplots with Other Plot Types
When combining two boxplots with the same axes, you can enhance your visualization by adding other plot types to provide additional context or information. Let’s explore some ways to combine boxplots with other plot types:
Adding Scatter Points
You can overlay individual data points on your combined boxplots to show the distribution of the raw data:
import matplotlib.pyplot as plt
import numpy as np

data1 = np.random.normal(0, 1, 100)
data2 = np.random.normal(2, 1.5, 100)

fig, ax = plt.subplots(figsize=(8, 6))

# Create boxplots
bp = ax.boxplot([data1, data2], labels=['Data 1', 'Data 2'])

# Add scatter points
for i, data in enumerate([data1, data2], 1):
    y = data
    x = np.random.normal(i, 0.04, len(y))
    ax.scatter(x, y, alpha=0.3)

ax.set_title('Combined Boxplots with Scatter Points - how2matplotlib.com')
ax.set_xlabel('Datasets')
ax.set_ylabel('Values')

plt.show()
Output:
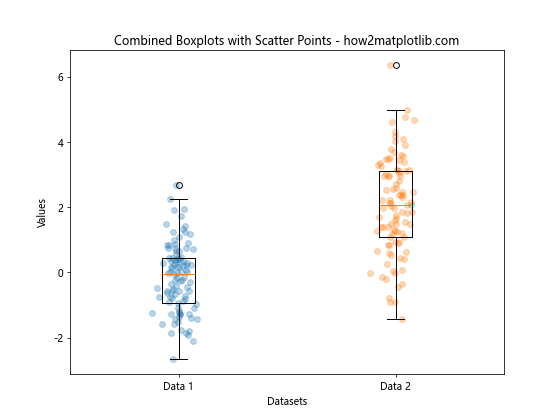
This example adds semi-transparent scatter points to each boxplot, providing a more detailed view of the data distribution.
Adding Violin Plots
Violin plots can be combined with boxplots to show the probability density of the data:
import matplotlib.pyplot as plt
import numpy as np

data1 = np.random.normal(0, 1, 100)
data2 = np.random.normal(2, 1.5, 100)

fig, ax = plt.subplots(figsize=(8, 6))

# Create violin plots
vp = ax.violinplot([data1, data2], positions=[1, 2], showmeans=True, showextrema=False, showmedians=False)

# Create boxplots
bp = ax.boxplot([data1, data2], positions=[1, 2], widths=0.3, patch_artist=True)

# Customize colors
colors = ['lightblue', 'lightgreen']
for patch, color in zip(bp['boxes'], colors):
    patch.set_facecolor(color)

ax.set_xticks([1, 2])
ax.set_xticklabels(['Data 1', 'Data 2'])
ax.set_title('Combined Boxplots and Violin Plots - how2matplotlib.com')
ax.set_xlabel('Datasets')
ax.set_ylabel('Values')

plt.show()
Output:
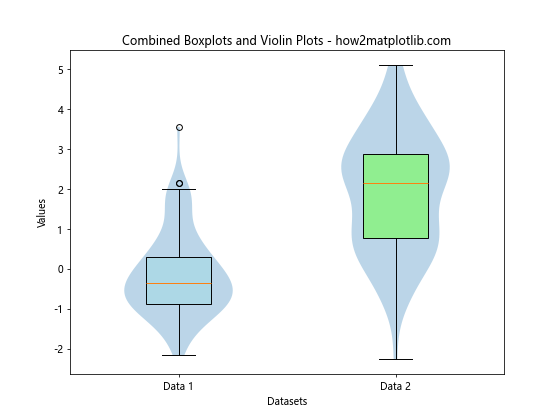
This example combines boxplots with violin plots, providing both a summary of the data’s distribution and its probability density.
Handling Large Datasets When Combining Boxplots
When combining two boxplots with the same axes for large datasets, you may encounter performance issues or visual clutter. Here are some strategies to handle large datasets effectively:
Using Random Sampling
For very large datasets, you can use random sampling to create more manageable boxplots:
import matplotlib.pyplot as plt
import numpy as np

# Generate large datasets
data1 = np.random.normal(0, 1, 100000)
data2 = np.random.normal(2, 1.5, 100000)

# Sample from the datasets
sample_size = 1000
sample1 = np.random.choice(data1, sample_size, replace=False)
sample2 = np.random.choice(data2, sample_size, replace=False)

fig, ax = plt.subplots(figsize=(8, 6))

# Create boxplots from samples
ax.boxplot([sample1, sample2], labels=['Data 1', 'Data 2'])

ax.set_title('Combined Boxplots with Sampled Data - how2matplotlib.com')
ax.set_xlabel('Datasets')
ax.set_ylabel('Values')

plt.show()
Output:
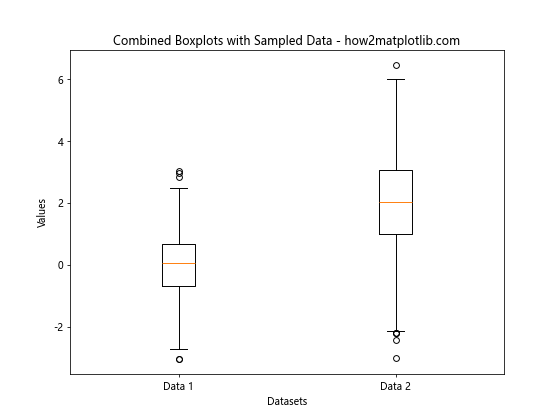
This example demonstrates how to use random sampling to create boxplots from large datasets, reducing computational load and visual clutter.
Advanced Customization Techniques for Combined Boxplots
When combining two boxplots with the same axes, you can apply various advanced customization techniques to create more informative and visually appealing plots. Let’s explore some of these techniques:
Adding Confidence Intervals
You can add confidence intervals to your combined boxplots to provide more statistical information:
import matplotlib.pyplot as plt
import numpy as np
from scipy import stats

def mean_confidence_interval(data, confidence=0.95):
    a = 1.0 * np.array(data)
    n = len(a)
    m, se = np.mean(a), stats.sem(a)
    h = se * stats.t.ppf((1 + confidence) / 2., n-1)
    return m, m-h, m+h

data1 = np.random.normal(0, 1, 100)
data2 = np.random.normal(2, 1.5, 100)

fig, ax = plt.subplots(figsize=(8, 6))

bp = ax.boxplot([data1, data2], labels=['Data 1', 'Data 2'])

# Add confidence intervals
for i, data in enumerate([data1, data2], 1):
    m, lower, upper = mean_confidence_interval(data)
    ax.vlines(i, lower, upper, color='r', linestyle='--', lw=2)
    ax.scatter(i, m, color='r', s=50, zorder=3)

ax.set_title('Combined Boxplots with Confidence Intervals - how2matplotlib.com')
ax.set_xlabel('Datasets')
ax.set_ylabel('Values')

plt.show()
Output:
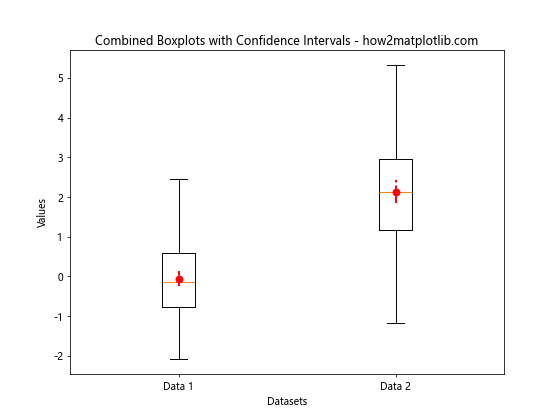
This example adds 95% confidence intervals as red dashed lines to each boxplot, with the mean represented by a red dot.
Creating Horizontal Boxplots
You can create horizontal boxplots for a different visual perspective:
import matplotlib.pyplot as plt
import numpy as np

data1 = np.random.normal(0, 1, 100)
data2 = np.random.normal(2, 1.5, 100)

fig, ax = plt.subplots(figsize=(8, 6))

bp = ax.boxplot([data1, data2], labels=['Data 1', 'Data 2'], vert=False)

ax.set_title('Horizontal Combined Boxplots - how2matplotlib.com')
ax.set_ylabel('Datasets')
ax.set_xlabel('Values')

plt.show()
Output:
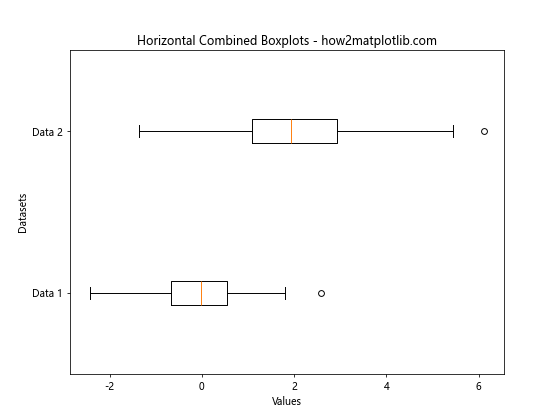
This example creates horizontal boxplots by setting vert=False in the boxplot function.
Adding a Color Gradient
You can add a color gradient to your boxplots to represent additional information:
import matplotlib.pyplot as plt
import numpy as np
from matplotlib.colors import LinearSegmentedColormap

data1 = np.random.normal(0, 1, 100)
data2 = np.random.normal(2, 1.5, 100)

fig, ax = plt.subplots(figsize=(8, 6))

bp = ax.boxplot([data1, data2], labels=['Data 1', 'Data 2'], patch_artist=True)

# Create a custom colormap
cmap = LinearSegmentedColormap.from_list("", ["lightblue", "darkblue"])

# Apply color gradient
for i, box in enumerate(bp['boxes']):
    box.set_facecolor(cmap(i / (len(bp['boxes']) - 1)))

ax.set_title('Combined Boxplots with Color Gradient - how2matplotlib.com')
ax.set_xlabel('Datasets')
ax.set_ylabel('Values')

plt.show()
Output:
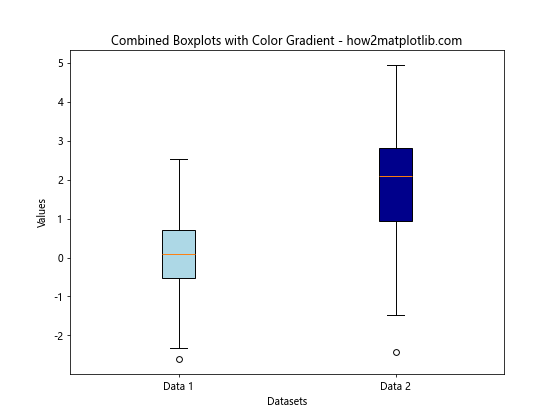
This example applies a color gradient to the boxplots, which can be useful for representing an additional dimension of information, such as time or category order.
Combining Boxplots with Subplots
When working with multiple datasets or categories, you might want to combine boxplots with subplots for a more comprehensive visualization. Here’s how you can do that:
import matplotlib.pyplot as plt
import numpy as np

# Generate sample data
data1 = [np.random.normal(0, 1, 100), np.random.normal(2, 1.5, 100)]
data2 = [np.random.normal(1, 2, 100), np.random.normal(3, 1, 100)]

fig, (ax1, ax2) = plt.subplots(1, 2, figsize=(12, 6))

# Create boxplots in each subplot
bp1 = ax1.boxplot(data1, labels=['Group A', 'Group B'])
bp2 = ax2.boxplot(data2, labels=['Group A', 'Group B'])

# Customize each subplot
ax1.set_title('Dataset 1 - how2matplotlib.com')
ax2.set_title('Dataset 2 - how2matplotlib.com')

for ax in (ax1, ax2):
    ax.set_ylabel('Values')

fig.suptitle('Combining Boxplots with Subplots', fontsize=16)

plt.tight_layout()
plt.show()
Output:
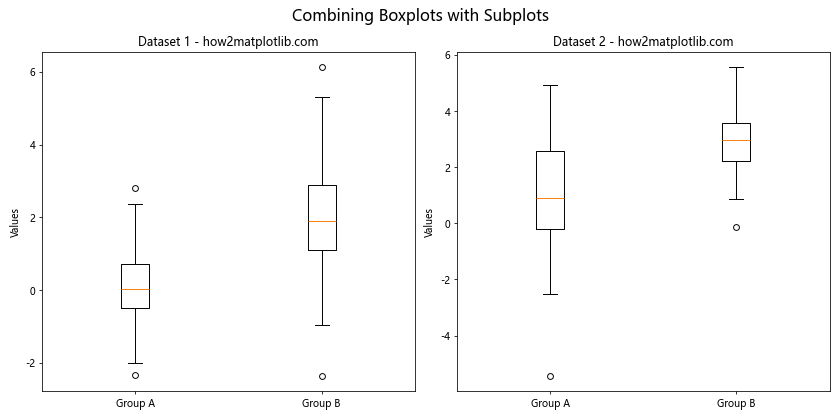
This example creates two subplots, each containing a pair of boxplots. This approach allows for easy comparison between different datasets or categories.
Handling Missing Data in Combined Boxplots
When combining two boxplots with the same axes, you may encounter situations where one or both datasets contain missing values. Here’s how to handle missing data:
import matplotlib.pyplot as plt
import numpy as np

# Generate sample data with missing values
data1 = np.random.normal(0, 1, 100)
data2 = np.random.normal(2, 1.5, 100)

# Introduce missing values
data1[np.random.choice(100, 10, replace=False)] = np.nan
data2[np.random.choice(100, 20, replace=False)] = np.nan

fig, ax = plt.subplots(figsize=(8, 6))

# Create boxplots, ignoring NaN values
bp = ax.boxplot([data1[~np.isnan(data1)], data2[~np.isnan(data2)]],
                labels=['Data 1', 'Data 2'])

ax.set_title('Combined Boxplots with Missing Data - how2matplotlib.com')
ax.set_xlabel('Datasets')
ax.set_ylabel('Values')

# Add text to show the number of valid data points
for i, data in enumerate([data1, data2], 1):
    valid_count = np.sum(~np.isnan(data))
    ax.text(i, ax.get_ylim()[1], f'n={valid_count}',
            horizontalalignment='center', verticalalignment='bottom')

plt.show()
Output:
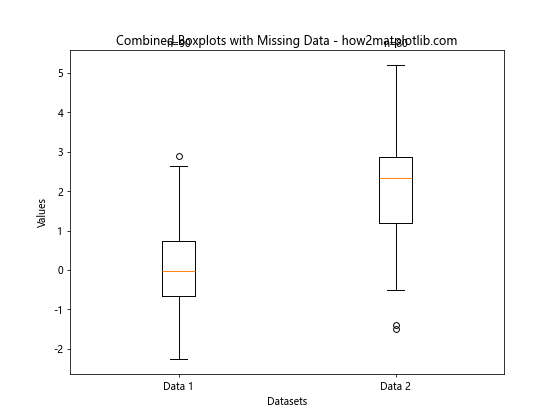
This example demonstrates how to create boxplots while ignoring NaN values, and adds text annotations to show the number of valid data points for each dataset.
Best Practices for Combining Two Boxplots With the Same Axes
When combining two boxplots with the same axes, it’s important to follow some best practices to ensure your visualization is clear, informative, and easy to interpret. Here are some key guidelines:
- Use consistent scales: Ensure that both boxplots use the same scale on the y-axis for accurate comparisons.
Choose appropriate colors: Use distinct but complementary colors for each boxplot to make them easily distinguishable.
Add clear labels: Include descriptive labels for each boxplot and axis to provide context for the data.
Consider adding statistical information: Include means, medians, or other relevant statistics to provide more insight into the data.
Handle outliers appropriately: Decide whether to show or exclude outliers based on your data and analysis goals.
Use notches when appropriate: Add notches to the boxplots if you want to show confidence intervals around the median.
Combine with other plot types when necessary: Consider adding scatter plots or violin plots to provide additional context.
Pay attention to sample sizes: If the sample sizes differ significantly between the two datasets, make this clear in your visualization or caption.
Use horizontal orientation when appropriate: Consider using horizontal boxplots for long category names or when comparing many groups.
Ensure accessibility: Choose colors that are distinguishable for colorblind viewers and use patterns or textures when necessary.
Troubleshooting Common Issues When Combining Boxplots
When combining two boxplots with the same axes, you may encounter some common issues. Here are some problems and their solutions: