How to Change the Color of Matplotlib Violin Plots
Changing the color of Matplotlib violin plots is an essential skill for data visualization enthusiasts. Violin plots are a powerful tool for displaying the distribution of data across different categories, and customizing their colors can greatly enhance the visual appeal and interpretability of your plots. In this comprehensive guide, we’ll explore various techniques for changing the color of Matplotlib violin plots, providing detailed explanations and easy-to-understand code examples along the way.
Understanding Matplotlib Violin Plots
Before diving into changing the color of Matplotlib violin plots, it’s important to understand what violin plots are and how they work. Violin plots are similar to box plots but provide more information about the distribution of data. They combine a box plot with a kernel density estimation, resulting in a shape that resembles a violin.
Let’s start with a basic example of creating a violin plot:
import matplotlib.pyplot as plt
import numpy as np

# Generate sample data
data = [np.random.normal(0, std, 100) for std in range(1, 4)]

# Create a violin plot
fig, ax = plt.subplots()
ax.violinplot(data)
ax.set_title("Basic Violin Plot - how2matplotlib.com")
plt.show()
Output:
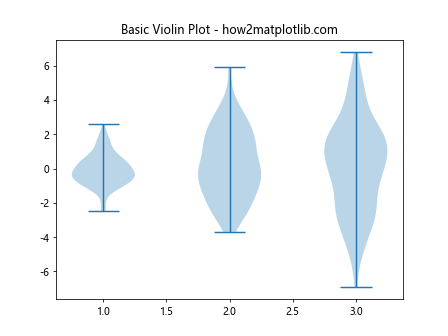
This code creates a simple violin plot with default colors. Now, let’s explore how to change the color of Matplotlib violin plots.
Customizing Individual Violin Colors
Sometimes, you may want to assign different colors to each violin in your plot. This can be achieved by using the facecolor parameter and providing a list of colors.
import matplotlib.pyplot as plt
import numpy as np

data = [np.random.normal(0, std, 100) for std in range(1, 4)]

fig, ax = plt.subplots()
violin_parts = ax.violinplot(data)

colors = ['red', 'green', 'blue']
for i, pc in enumerate(violin_parts['bodies']):
    pc.set_facecolor(colors[i])
    pc.set_edgecolor('black')

ax.set_title("Violin Plot with Custom Colors - how2matplotlib.com")
plt.show()
Output:
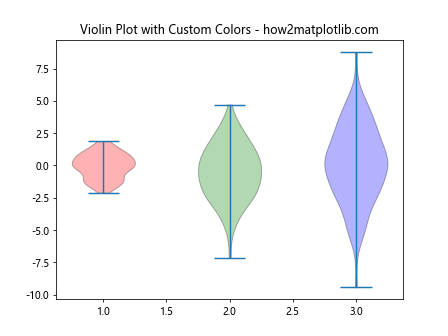
This code assigns different colors to each violin in the plot, making it easier to distinguish between different data distributions.
Using Colormap to Change Violin Plot Colors
Colormaps provide a powerful way to assign colors to your violin plots based on data values or other criteria. Matplotlib offers a wide range of colormaps that you can use to create visually appealing violin plots.
import matplotlib.pyplot as plt
import numpy as np

data = [np.random.normal(0, std, 100) for std in range(1, 6)]

fig, ax = plt.subplots()
violin_parts = ax.violinplot(data)

cmap = plt.get_cmap('viridis')
for i, pc in enumerate(violin_parts['bodies']):
    pc.set_facecolor(cmap(i / len(data)))
    pc.set_edgecolor('black')

ax.set_title("Violin Plot with Colormap - how2matplotlib.com")
plt.show()
Output:
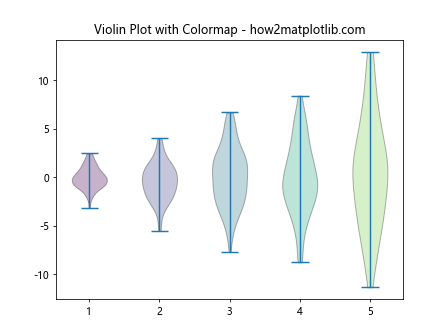
This code uses the ‘viridis’ colormap to assign colors to each violin based on its index. You can experiment with different colormaps to achieve the desired visual effect.
Changing Violin Plot Colors Based on Data Values
You can also change the color of Matplotlib violin plots based on the actual data values. This can be particularly useful when you want to highlight certain characteristics of your data distribution.
import matplotlib.pyplot as plt
import numpy as np

data = [np.random.normal(0, std, 100) for std in range(1, 6)]

fig, ax = plt.subplots()
violin_parts = ax.violinplot(data)

cmap = plt.get_cmap('coolwarm')
for i, pc in enumerate(violin_parts['bodies']):
    pc.set_facecolor(cmap(np.mean(data[i])))
    pc.set_edgecolor('black')

ax.set_title("Violin Plot with Colors Based on Data Values - how2matplotlib.com")
plt.show()
Output:
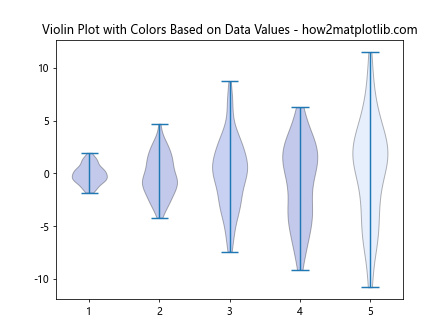
In this example, we use the ‘coolwarm’ colormap to assign colors to each violin based on the mean value of its corresponding data set.
Adding Transparency to Violin Plots
Changing the color of Matplotlib violin plots can also involve adjusting their transparency. This can be particularly useful when dealing with overlapping violins or when you want to emphasize certain aspects of your data.
import matplotlib.pyplot as plt
import numpy as np

data = [np.random.normal(0, std, 100) for std in range(1, 4)]

fig, ax = plt.subplots()
violin_parts = ax.violinplot(data)

for pc in violin_parts['bodies']:
    pc.set_facecolor('blue')
    pc.set_edgecolor('black')
    pc.set_alpha(0.6)

ax.set_title("Violin Plot with Transparency - how2matplotlib.com")
plt.show()
Output:
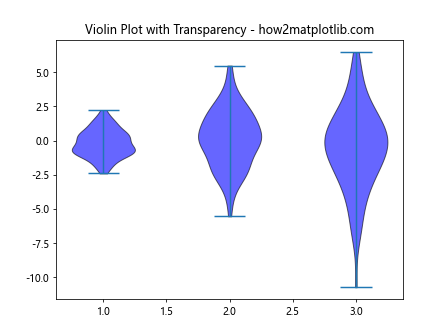
This code sets the transparency of the violin bodies to 60%, allowing for better visibility of overlapping regions.
Changing Colors in Horizontal Violin Plots
So far, we’ve focused on vertical violin plots. However, you can also create horizontal violin plots and customize their colors. Here’s an example:
import matplotlib.pyplot as plt
import numpy as np

data = [np.random.normal(0, std, 100) for std in range(1, 4)]

fig, ax = plt.subplots()
violin_parts = ax.violinplot(data, vert=False)

colors = ['red', 'green', 'blue']
for i, pc in enumerate(violin_parts['bodies']):
    pc.set_facecolor(colors[i])
    pc.set_edgecolor('black')

ax.set_title("Horizontal Violin Plot with Custom Colors - how2matplotlib.com")
plt.show()
Output:
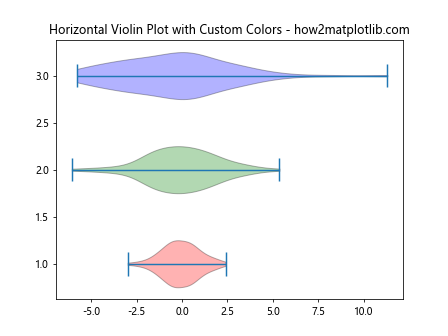
This code creates a horizontal violin plot with custom colors for each violin.
Using a Color Cycle for Violin Plots
When dealing with multiple violin plots, you can use Matplotlib’s color cycle to automatically assign different colors to each violin.
import matplotlib.pyplot as plt
import numpy as np

data = [np.random.normal(0, std, 100) for std in range(1, 6)]

fig, ax = plt.subplots()
violin_parts = ax.violinplot(data)

for i, pc in enumerate(violin_parts['bodies']):
    pc.set_facecolor(plt.cm.Set3(i / len(data)))
    pc.set_edgecolor('black')

ax.set_title("Violin Plot with Color Cycle - how2matplotlib.com")
plt.show()
Output:
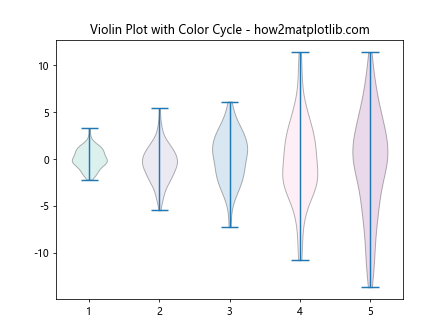
This example uses the ‘Set3’ colormap to automatically assign different colors to each violin in the plot.
Changing Colors in Split Violin Plots
Split violin plots are useful for comparing two distributions side by side. You can customize the colors of each half of the split violin to enhance the visual comparison.
import matplotlib.pyplot as plt
import numpy as np

def split_violin(data1, data2):
    fig, ax = plt.subplots()

    parts = ax.violinplot([data1, data2], positions=[1, 2], showmeans=False,
                          showmedians=False, showextrema=False)

    for i, pc in enumerate(parts['bodies']):
        if i == 0:
            pc.set_facecolor('lightblue')
        else:
            pc.set_facecolor('lightgreen')
        pc.set_edgecolor('black')
        m = np.mean(pc.get_paths()[0].vertices[:, 0])
        pc.get_paths()[0].vertices[:, 0] = np.clip(pc.get_paths()[0].vertices[:, 0], -np.inf, m)
        pc.set_alpha(0.7)

    ax.set_title("Split Violin Plot with Custom Colors - how2matplotlib.com")
    ax.set_xticks([1, 2])
    ax.set_xticklabels(['Data 1', 'Data 2'])
    plt.show()

data1 = np.random.normal(0, 1, 1000)
data2 = np.random.normal(1, 1.5, 1000)
split_violin(data1, data2)
This code creates a split violin plot with different colors for each half, making it easy to compare two distributions.
Changing Colors in Grouped Violin Plots
When working with grouped data, you can create grouped violin plots and customize their colors to distinguish between different groups and categories.
import matplotlib.pyplot as plt
import numpy as np

def grouped_violin(data, labels, colors):
    fig, ax = plt.subplots()

    positions = np.arange(1, len(data) + 1)
    parts = ax.violinplot(data, positions=positions, showmeans=False,
                          showmedians=False, showextrema=False)

    for i, pc in enumerate(parts['bodies']):
        pc.set_facecolor(colors[i])
        pc.set_edgecolor('black')
        pc.set_alpha(0.7)

    ax.set_title("Grouped Violin Plot with Custom Colors - how2matplotlib.com")
    ax.set_xticks(positions)
    ax.set_xticklabels(labels)
    plt.show()

data = [np.random.normal(0, std, 100) for std in range(1, 5)]
labels = ['Group A', 'Group B', 'Group C', 'Group D']
colors = ['red', 'green', 'blue', 'orange']
grouped_violin(data, labels, colors)
This example creates a grouped violin plot with custom colors for each group, making it easy to compare distributions across different categories.
Changing Colors in Violin Plots with Subplots
When creating multiple violin plots in subplots, you can customize the colors of each subplot independently.
import matplotlib.pyplot as plt
import numpy as np

fig, (ax1, ax2) = plt.subplots(1, 2, figsize=(12, 5))

data1 = [np.random.normal(0, std, 100) for std in range(1, 4)]
data2 = [np.random.normal(0, std, 100) for std in range(2, 5)]

parts1 = ax1.violinplot(data1)
parts2 = ax2.violinplot(data2)

colors1 = ['red', 'green', 'blue']
colors2 = ['orange', 'purple', 'cyan']

for i, pc in enumerate(parts1['bodies']):
    pc.set_facecolor(colors1[i])
    pc.set_edgecolor('black')

for i, pc in enumerate(parts2['bodies']):
    pc.set_facecolor(colors2[i])
    pc.set_edgecolor('black')

ax1.set_title("Subplot 1 - how2matplotlib.com")
ax2.set_title("Subplot 2 - how2matplotlib.com")
plt.tight_layout()
plt.show()
Output:
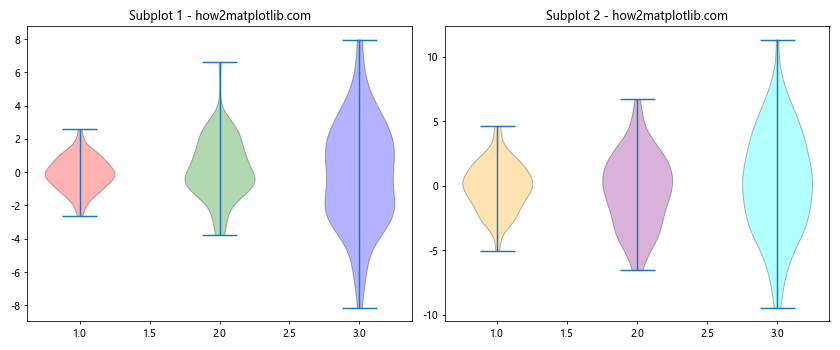
This code creates two subplots with violin plots, each with its own color scheme.
Using Custom Color Palettes for Violin Plots
You can create custom color palettes to use in your violin plots, allowing for more fine-tuned control over the color scheme.
import matplotlib.pyplot as plt
import numpy as np
import seaborn as sns

data = [np.random.normal(0, std, 100) for std in range(1, 6)]

custom_palette = sns.color_palette("husl", n_colors=len(data))

fig, ax = plt.subplots()
violin_parts = ax.violinplot(data)

for i, pc in enumerate(violin_parts['bodies']):
    pc.set_facecolor(custom_palette[i])
    pc.set_edgecolor('black')

ax.set_title("Violin Plot with Custom Color Palette - how2matplotlib.com")
plt.show()
Output:
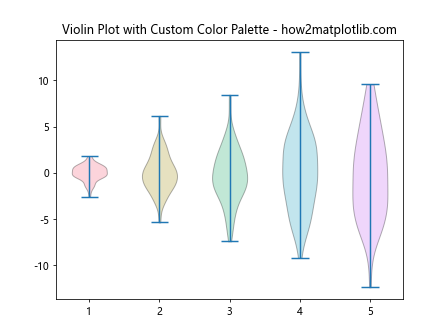
This example uses a custom color palette created with Seaborn to assign colors to each violin in the plot.
Animating Color Changes in Violin Plots
For a more dynamic visualization, you can create an animation that changes the colors of violin plots over time.
import matplotlib.pyplot as plt
import numpy as np
import matplotlib.animation as animation

def update(frame):
    data = [np.random.normal(0, std, 100) for std in range(1, 4)]
    violin_parts = ax.violinplot(data)

    colors = plt.cm.viridis(frame / 100)
    for pc in violin_parts['bodies']:
        pc.set_facecolor(colors)
        pc.set_edgecolor('black')

    return violin_parts['bodies']

fig, ax = plt.subplots()
ax.set_title("Animated Violin Plot Colors - how2matplotlib.com")

anim = animation.FuncAnimation(fig, update, frames=100, interval=100, blit=True)
plt.show()
Output:
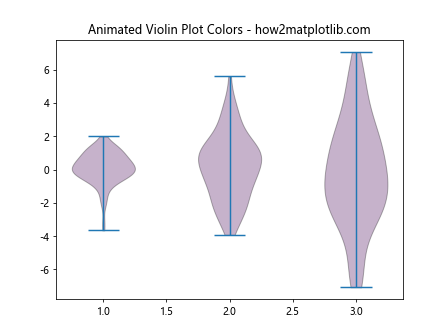
This example creates an animation where the colors of the violin plots change over time using the ‘viridis’ colormap.
Changing Colors in Violin Plots with Outliers
When dealing with data that contains outliers, you might want to highlight them using different colors in your violin plots.
import matplotlib.pyplot as plt
import numpy as np

def violin_plot_with_outliers(data):
    fig, ax = plt.subplots()

    violin_parts = ax.violinplot(data, showextrema=False)

    for i, d in enumerate(data):
        # Calculate quartiles and IQR
        q1, q3 = np.percentile(d, [25, 75])
        iqr = q3 - q1
        lower_bound = q1 - (1.5 * iqr)
        upper_bound = q3 + (1.5 * iqr)

        # Identify outliers
        outliers = d[(d < lower_bound) | (d > upper_bound)]

        # Plot violin
        pc = violin_parts['bodies'][i]
        pc.set_facecolor('lightblue')
        pc.set_edgecolor('black')

        # Plot outliers
        ax.scatter([i+1] * len(outliers), outliers, color='red', s=10)

    ax.set_title("Violin Plot with Highlighted Outliers - how2matplotlib.com")
    plt.show()

data = [np.concatenate([np.random.normal(0, 1, 95), np.random.normal(0, 5, 5)]) for _ in range(3)]
violin_plot_with_outliers(data)
This code creates violin plots with outliers highlighted in red, making it easy to identify unusual data points.
Conclusion
Changing the color of Matplotlib violin plots is a powerful technique for enhancing the visual appeal and interpretability of your data visualizations. By mastering the various methods discussed in this comprehensive guide, you can create stunning and informative violin plots that effectively communicate your data’s distribution and characteristics.
Remember to experiment with different color schemes, transparency levels, and customization techniques to find the perfect visual representation for your specific dataset. Whether you’re working on simple comparisons or complex multi-group analyses, the ability to change the color of Matplotlib violin plots will prove invaluable in your data visualization toolkit.