How to Adjust the Width of Box in Boxplot in Matplotlib
Adjust the Width of Box in Boxplot in Matplotlib is an essential skill for data visualization enthusiasts and professionals alike. This article will delve deep into the intricacies of adjusting box widths in boxplots using Matplotlib, providing you with a thorough understanding of the topic and practical examples to enhance your data visualization skills.
Understanding Boxplots and the Importance of Adjusting Box Width
Before we dive into adjusting the width of boxes in boxplots, let’s first understand what boxplots are and why adjusting their box width is crucial. Boxplots, also known as box-and-whisker plots, are a standardized way of displaying the distribution of data based on a five-number summary: minimum, first quartile, median, third quartile, and maximum. The ability to adjust the width of box in boxplot in Matplotlib allows for better visualization and comparison of data distributions, especially when dealing with multiple datasets or categories.
Example 1: Creating a Basic Boxplot
Let’s start with a basic example of creating a boxplot using Matplotlib:
import matplotlib.pyplot as plt
import numpy as np

# Generate sample data
data = np.random.randn(100)

# Create a boxplot
plt.figure(figsize=(8, 6))
plt.boxplot(data)
plt.title("Basic Boxplot - how2matplotlib.com")
plt.ylabel("Values")
plt.show()
Output:
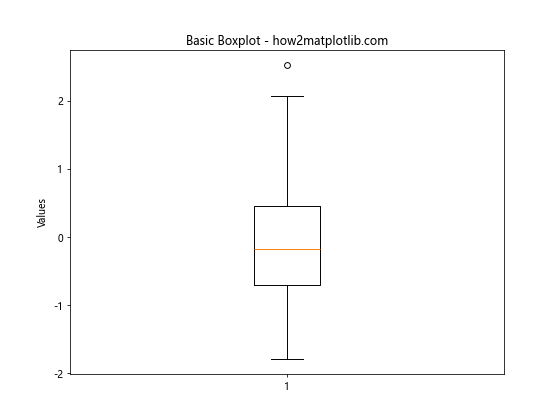
In this example, we create a simple boxplot using random data. The default box width is used, which may not always be ideal for all datasets or visualization purposes.
Adjusting Box Width Using the ‘widths’ Parameter
One of the most straightforward ways to adjust the width of box in boxplot in Matplotlib is by using the ‘widths’ parameter. This parameter allows you to specify the width of the boxes as a fraction of the maximum possible width.
Example 2: Adjusting Box Width with ‘widths’ Parameter
import matplotlib.pyplot as plt
import numpy as np

# Generate sample data
data = [np.random.randn(100) for _ in range(3)]

# Create a boxplot with adjusted box width
plt.figure(figsize=(10, 6))
plt.boxplot(data, widths=0.5)
plt.title("Boxplot with Adjusted Width - how2matplotlib.com")
plt.ylabel("Values")
plt.xlabel("Groups")
plt.show()
Output:
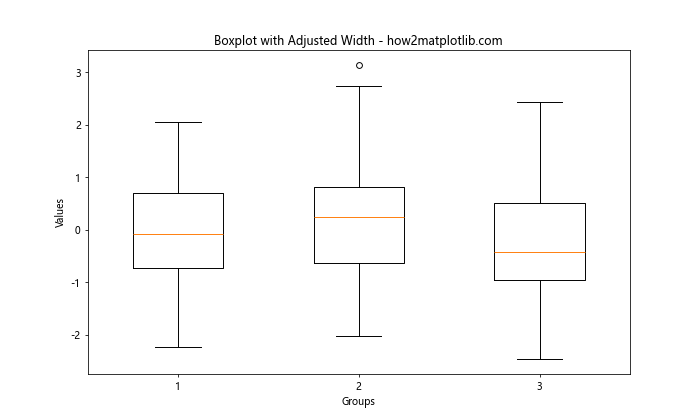
In this example, we set the ‘widths’ parameter to 0.5, which makes the boxes half as wide as they would be by default. This can be particularly useful when you want to emphasize the distribution of data within each box.
Using Different Widths for Multiple Boxes
When working with multiple datasets or categories, you might want to adjust the width of box in boxplot in Matplotlib differently for each box. This can be achieved by passing a list of width values to the ‘widths’ parameter.
Example 3: Varying Box Widths for Multiple Datasets
import matplotlib.pyplot as plt
import numpy as np

# Generate sample data
data1 = np.random.randn(100)
data2 = np.random.randn(80)
data3 = np.random.randn(120)

# Create a boxplot with varying box widths
plt.figure(figsize=(12, 6))
plt.boxplot([data1, data2, data3], widths=[0.3, 0.5, 0.7])
plt.title("Boxplot with Varying Widths - how2matplotlib.com")
plt.ylabel("Values")
plt.xlabel("Datasets")
plt.show()
Output:
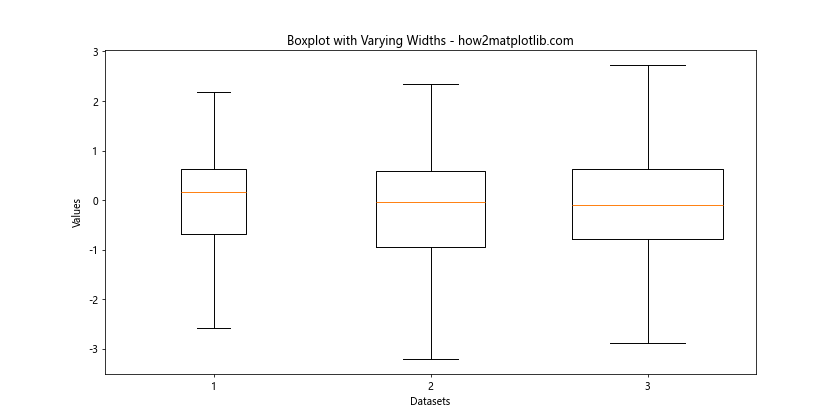
In this example, we create three datasets of different sizes and adjust the width of box in boxplot in Matplotlib for each dataset individually. This can be useful when you want to visually represent the sample size or importance of each dataset.
Adjusting Box Width in Horizontal Boxplots
Sometimes, you may want to create horizontal boxplots instead of vertical ones. The process of adjusting the width of box in boxplot in Matplotlib remains similar, but you’ll need to use the ‘vert’ parameter to change the orientation.
Example 4: Adjusting Box Width in Horizontal Boxplots
import matplotlib.pyplot as plt
import numpy as np

# Generate sample data
data = [np.random.randn(100) for _ in range(4)]

# Create a horizontal boxplot with adjusted box width
plt.figure(figsize=(10, 8))
plt.boxplot(data, vert=False, widths=0.6)
plt.title("Horizontal Boxplot with Adjusted Width - how2matplotlib.com")
plt.xlabel("Values")
plt.ylabel("Groups")
plt.show()
Output:
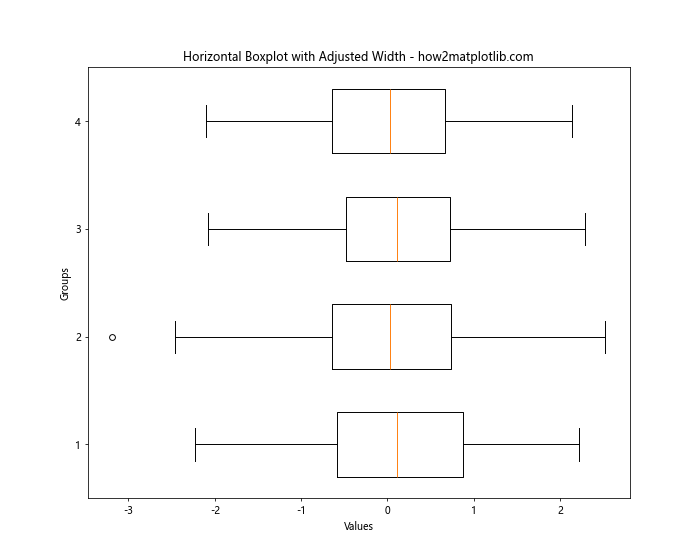
In this example, we create a horizontal boxplot by setting ‘vert=False’ and adjust the width of box in boxplot in Matplotlib using the ‘widths’ parameter.
Fine-tuning Box Width with ‘patch_artist’ Parameter
For more control over the appearance of your boxplots, you can use the ‘patch_artist’ parameter in combination with adjusting the box width. This allows you to customize the fill color and transparency of the boxes.
Example 5: Adjusting Box Width and Appearance with ‘patch_artist’
import matplotlib.pyplot as plt
import numpy as np

# Generate sample data
data = [np.random.randn(100) for _ in range(3)]

# Create a boxplot with adjusted width and custom appearance
plt.figure(figsize=(10, 6))
bp = plt.boxplot(data, widths=0.4, patch_artist=True)

# Customize box colors
colors = ['lightblue', 'lightgreen', 'lightpink']
for patch, color in zip(bp['boxes'], colors):
    patch.set_facecolor(color)
    patch.set_alpha(0.7)

plt.title("Boxplot with Adjusted Width and Custom Appearance - how2matplotlib.com")
plt.ylabel("Values")
plt.xlabel("Groups")
plt.show()
Output:
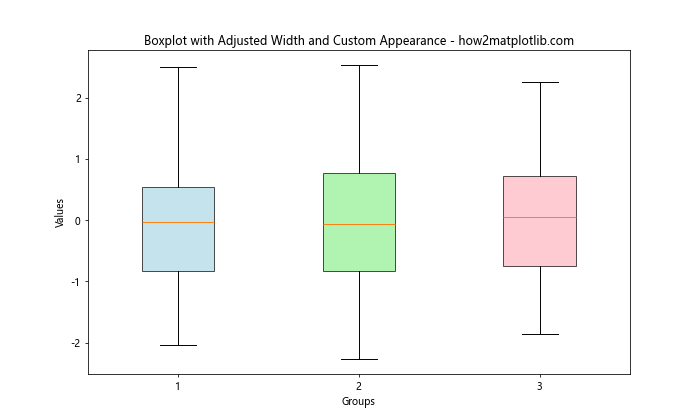
In this example, we adjust the width of box in boxplot in Matplotlib and use the ‘patch_artist’ parameter to customize the appearance of the boxes. This can be particularly useful when you want to distinguish between different categories or datasets visually.
Adjusting Box Width in Seaborn
While we’re focusing on Matplotlib, it’s worth mentioning that Seaborn, a statistical data visualization library built on top of Matplotlib, also provides options to adjust the width of box in boxplot. Seaborn’s interface can sometimes be more intuitive for certain tasks.
Example 6: Adjusting Box Width in Seaborn
import matplotlib.pyplot as plt
import seaborn as sns
import numpy as np

# Generate sample data
data = np.random.randn(100, 3)
df = pd.DataFrame(data, columns=['A', 'B', 'C'])

# Create a boxplot with adjusted width using Seaborn
plt.figure(figsize=(10, 6))
sns.boxplot(data=df, width=0.5)
plt.title("Seaborn Boxplot with Adjusted Width - how2matplotlib.com")
plt.ylabel("Values")
plt.show()
In this example, we use Seaborn to create a boxplot and adjust the width of box in boxplot. Seaborn provides a simpler interface for certain types of plots, including boxplots.
Advanced Techniques for Adjusting Box Width
As you become more proficient in adjusting the width of box in boxplot in Matplotlib, you may want to explore more advanced techniques. These can include dynamically calculating box widths based on data characteristics or creating custom boxplot functions.
Example 7: Dynamically Adjusting Box Width Based on Data Variance
import matplotlib.pyplot as plt
import numpy as np

def dynamic_boxplot(data, base_width=0.5):
    variances = [np.var(d) for d in data]
    max_variance = max(variances)
    widths = [base_width * (v / max_variance) for v in variances]

    plt.figure(figsize=(12, 6))
    plt.boxplot(data, widths=widths)
    plt.title("Boxplot with Dynamically Adjusted Widths - how2matplotlib.com")
    plt.ylabel("Values")
    plt.xlabel("Groups")
    plt.show()

# Generate sample data with different variances
data1 = np.random.normal(0, 1, 100)
data2 = np.random.normal(0, 2, 100)
data3 = np.random.normal(0, 0.5, 100)

dynamic_boxplot([data1, data2, data3])
In this advanced example, we create a custom function that adjusts the width of box in boxplot in Matplotlib based on the variance of each dataset. This can be useful when you want to visually represent the spread of data in addition to its distribution.
Combining Box Width Adjustment with Other Customizations
To create truly informative and visually appealing boxplots, you often need to combine adjusting the width of box in boxplot in Matplotlib with other customizations. This can include adding labels, changing colors, or incorporating additional statistical information.
Example 8: Comprehensive Boxplot Customization
import matplotlib.pyplot as plt
import numpy as np

# Generate sample data
np.random.seed(42)
data = [np.random.normal(0, std, 100) for std in range(1, 4)]

# Create a customized boxplot
fig, ax = plt.subplots(figsize=(10, 6))

bp = ax.boxplot(data, widths=0.6, patch_artist=True,
                showmeans=True, meanline=True, showfliers=False)

# Customize colors and styles
colors = ['#FFB3BA', '#BAFFC9', '#BAE1FF']
for patch, color in zip(bp['boxes'], colors):
    patch.set_facecolor(color)

for element in ['whiskers', 'caps', 'medians', 'means']:
    plt.setp(bp[element], color='#444444')

# Add labels and title
ax.set_xticklabels(['Low', 'Medium', 'High'])
ax.set_ylabel('Values')
ax.set_title('Comprehensive Boxplot Customization - how2matplotlib.com')

# Add a legend
ax.legend([bp["boxes"][0], bp["means"][0]], ['Distribution', 'Mean'],
          loc='upper left')

plt.show()
Output:
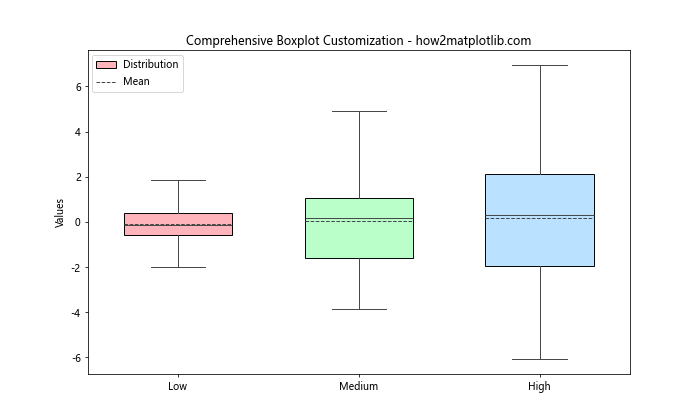
In this comprehensive example, we not only adjust the width of box in boxplot in Matplotlib but also customize colors, add mean lines, remove outliers, and include a legend. This level of customization allows you to create highly informative and visually appealing boxplots.
Best Practices for Adjusting Box Width in Boxplots
When adjusting the width of box in boxplot in Matplotlib, it’s important to keep certain best practices in mind to ensure your visualizations are both informative and aesthetically pleasing.
- Consistency: If you’re comparing multiple datasets, try to keep the box widths consistent unless there’s a specific reason to vary them.
Proportionality: Consider making the box width proportional to the sample size or another relevant metric.
Avoid Extremes: Very narrow or very wide boxes can distort the perception of the data. Stick to widths between 0.3 and 0.8 for most cases.
Balance with Whitespace: Ensure there’s enough whitespace between boxes for easy visual separation.
Consider the Audience: Adjust the width based on your audience’s familiarity with boxplots and the complexity of the data.
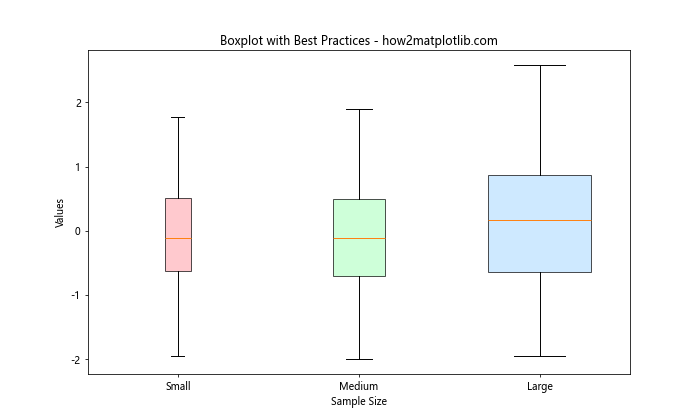
Example 9: Implementing Best Practices
import matplotlib.pyplot as plt
import numpy as np

# Generate sample data with different sample sizes
data1 = np.random.normal(0, 1, 50)
data2 = np.random.normal(0, 1, 100)
data3 = np.random.normal(0, 1, 200)

# Calculate proportional widths
total_samples = len(data1) + len(data2) + len(data3)
widths = [len(d) / total_samples for d in [data1, data2, data3]]

# Create the boxplot
plt.figure(figsize=(10, 6))
bp = plt.boxplot([data1, data2, data3], widths=widths, patch_artist=True)

# Customize appearance
colors = ['#FFB3BA', '#BAFFC9', '#BAE1FF']
for patch, color in zip(bp['boxes'], colors):
    patch.set_facecolor(color)
    patch.set_alpha(0.7)

plt.title("Boxplot with Best Practices - how2matplotlib.com")
plt.ylabel("Values")
plt.xlabel("Sample Size")
plt.xticks([1, 2, 3], ['Small', 'Medium', 'Large'])

plt.show()
Output:
