How to Add Legend to Boxplot with Multiple Plots in Matplotlib
Adding legend to boxplot with multiple plots is an essential skill for data visualization using Matplotlib. This article will provide a detailed guide on how to effectively add legends to boxplots, especially when dealing with multiple plots. We’ll explore various techniques and best practices for adding legend to boxplot with multiple plots, ensuring your visualizations are both informative and visually appealing.
Understanding Boxplots and the Importance of Adding Legend to Boxplot with Multiple Plots
Before diving into the specifics of adding legend to boxplot with multiple plots, let’s first understand what boxplots are and why legends are crucial when working with multiple plots.
A boxplot, also known as a box-and-whisker plot, is a standardized way of displaying the distribution of data based on five summary statistics: minimum, first quartile, median, third quartile, and maximum. When dealing with multiple boxplots in a single figure, adding legend to boxplot with multiple plots becomes essential for distinguishing between different datasets or categories.
Adding legend to boxplot with multiple plots serves several purposes:
- Identification: It helps viewers identify which boxplot corresponds to which dataset or category.
- Clarity: It enhances the overall clarity of the visualization, making it easier to interpret.
- Comparison: It facilitates easy comparison between different groups or categories.
- Professionalism: It adds a professional touch to your data visualization.
Now, let’s explore various methods for adding legend to boxplot with multiple plots using Matplotlib.
Basic Method for Adding Legend to Boxplot with Multiple Plots
The most straightforward method for adding legend to boxplot with multiple plots involves creating the boxplot and then manually adding a legend. Here’s a simple example:
import matplotlib.pyplot as plt
import numpy as np

# Generate sample data
data1 = np.random.normal(100, 10, 200)
data2 = np.random.normal(90, 20, 200)
data3 = np.random.normal(80, 30, 200)

# Create boxplot
fig, ax = plt.subplots(figsize=(10, 6))
bp = ax.boxplot([data1, data2, data3], patch_artist=True)

# Customize boxplot colors
colors = ['lightblue', 'lightgreen', 'lightpink']
for patch, color in zip(bp['boxes'], colors):
    patch.set_facecolor(color)

# Add legend
ax.legend([bp['boxes'][0], bp['boxes'][1], bp['boxes'][2]],
          ['Data 1', 'Data 2', 'Data 3'],
          loc='upper right')

plt.title('Adding Legend to Boxplot with Multiple Plots - how2matplotlib.com')
plt.show()
Output:
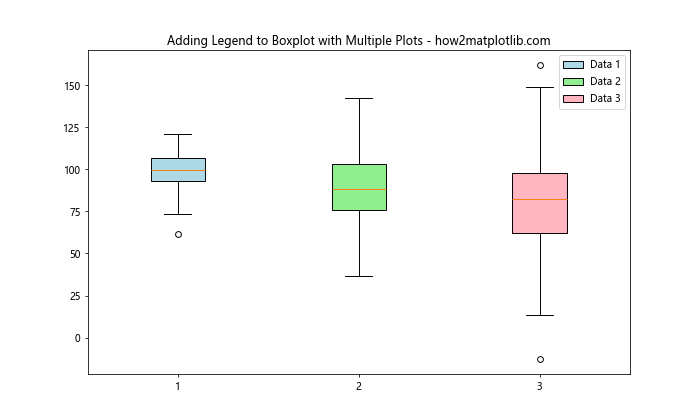
In this example, we’ve created three datasets and plotted them as boxplots. We then added a legend by specifying the box patches and their corresponding labels. This method of adding legend to boxplot with multiple plots is simple but effective.
Using Named Boxplots for Adding Legend to Boxplot with Multiple Plots
Another approach for adding legend to boxplot with multiple plots is to use named boxplots. This method can be particularly useful when dealing with categorical data. Here’s an example:
import matplotlib.pyplot as plt
import numpy as np

# Generate sample data
np.random.seed(42)
data = {
    'Group A': np.random.normal(100, 10, 200),
    'Group B': np.random.normal(90, 20, 200),
    'Group C': np.random.normal(80, 30, 200)
}

# Create boxplot
fig, ax = plt.subplots(figsize=(10, 6))
bp = ax.boxplot(data.values(), patch_artist=True)

# Customize boxplot colors
colors = ['lightblue', 'lightgreen', 'lightpink']
for patch, color in zip(bp['boxes'], colors):
    patch.set_facecolor(color)

# Add legend
ax.legend(bp['boxes'], data.keys(), loc='upper right')

plt.title('Adding Legend to Boxplot with Multiple Plots - how2matplotlib.com')
plt.show()
Output:
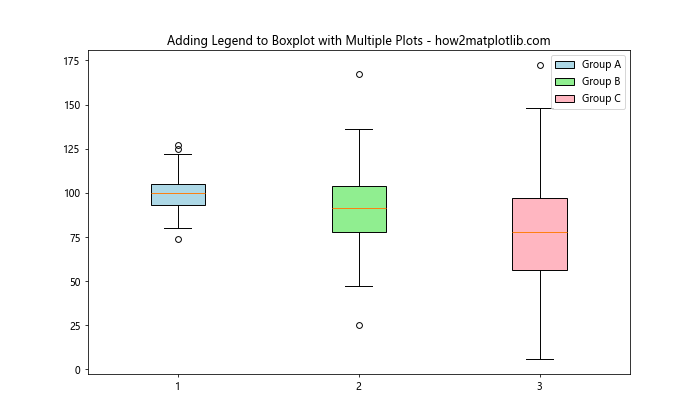
In this example, we’ve used a dictionary to store our data, which allows us to easily associate each dataset with a label. This method of adding legend to boxplot with multiple plots is particularly useful when working with named categories.
Adding Legend to Boxplot with Multiple Plots Using Seaborn
While Matplotlib is powerful, sometimes using higher-level libraries like Seaborn can simplify the process of adding legend to boxplot with multiple plots. Here’s an example using Seaborn:
import matplotlib.pyplot as plt
import seaborn as sns
import pandas as pd
import numpy as np

# Generate sample data
np.random.seed(42)
data = pd.DataFrame({
    'Group': np.repeat(['A', 'B', 'C'], 200),
    'Value': np.concatenate([
        np.random.normal(100, 10, 200),
        np.random.normal(90, 20, 200),
        np.random.normal(80, 30, 200)
    ])
})

# Create boxplot
plt.figure(figsize=(10, 6))
sns.boxplot(x='Group', y='Value', data=data, palette='pastel')

plt.title('Adding Legend to Boxplot with Multiple Plots - how2matplotlib.com')
plt.show()
Output:
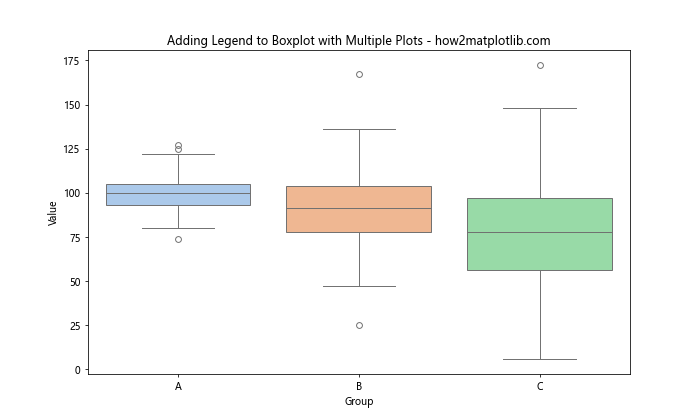
In this example, we’ve used Seaborn’s boxplot function, which automatically handles the legend for us. This method of adding legend to boxplot with multiple plots is particularly useful when working with pandas DataFrames.
Advanced Techniques for Adding Legend to Boxplot with Multiple Plots
Now that we’ve covered the basics, let’s explore some more advanced techniques for adding legend to boxplot with multiple plots.
Adding Legend to Boxplot with Multiple Plots and Multiple Features
Sometimes, you might want to compare multiple features across different groups. Here’s how you can add legend to boxplot with multiple plots in such a scenario:
import matplotlib.pyplot as plt
import numpy as np

# Generate sample data
np.random.seed(42)
data = {
    'Group A': {
        'Feature 1': np.random.normal(100, 10, 200),
        'Feature 2': np.random.normal(90, 15, 200)
    },
    'Group B': {
        'Feature 1': np.random.normal(95, 12, 200),
        'Feature 2': np.random.normal(85, 18, 200)
    },
    'Group C': {
        'Feature 1': np.random.normal(90, 14, 200),
        'Feature 2': np.random.normal(80, 20, 200)
    }
}

# Create boxplot
fig, ax = plt.subplots(figsize=(12, 6))

positions = np.arange(len(data)) * 3
colors = ['lightblue', 'lightgreen']
width = 0.8

for i, (feature, color) in enumerate(zip(['Feature 1', 'Feature 2'], colors)):
    feature_data = [group[feature] for group in data.values()]
    bp = ax.boxplot(feature_data, positions=positions + i, patch_artist=True, widths=width)
    for patch in bp['boxes']:
        patch.set_facecolor(color)

# Customize x-axis
ax.set_xticks(positions + 0.4)
ax.set_xticklabels(data.keys())

# Add legend
ax.legend([plt.Rectangle((0,0),1,1,fc=c) for c in colors], ['Feature 1', 'Feature 2'], loc='upper right')

plt.title('Adding Legend to Boxplot with Multiple Plots and Features - how2matplotlib.com')
plt.show()
Output:
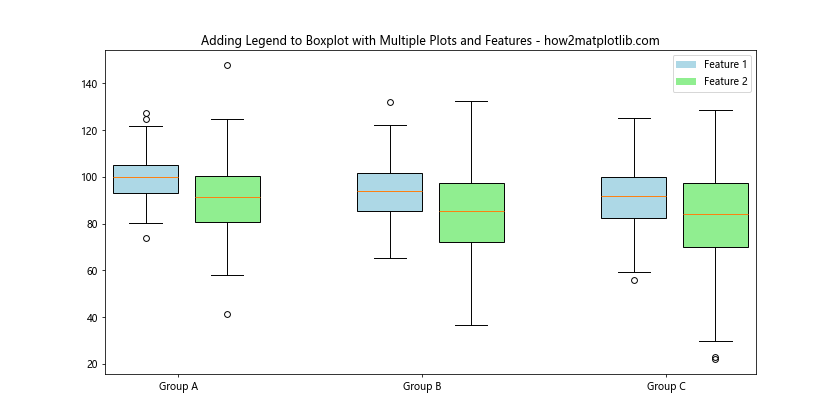
In this example, we’ve created boxplots for two features across three groups. We’ve used different colors for each feature and added a legend to distinguish between them. This advanced method of adding legend to boxplot with multiple plots allows for more complex comparisons.
Adding Legend to Boxplot with Multiple Plots and Subplots
When dealing with a large number of groups or features, it might be beneficial to use subplots. Here’s how you can add legend to boxplot with multiple plots using subplots:
import matplotlib.pyplot as plt
import numpy as np

# Generate sample data
np.random.seed(42)
data = {
    'Category 1': {
        'Group A': np.random.normal(100, 10, 200),
        'Group B': np.random.normal(90, 15, 200),
        'Group C': np.random.normal(80, 20, 200)
    },
    'Category 2': {
        'Group A': np.random.normal(95, 12, 200),
        'Group B': np.random.normal(85, 18, 200),
        'Group C': np.random.normal(75, 22, 200)
    }
}

# Create boxplot with subplots
fig, (ax1, ax2) = plt.subplots(1, 2, figsize=(15, 6))

colors = ['lightblue', 'lightgreen', 'lightpink']

for ax, (category, groups) in zip([ax1, ax2], data.items()):
    bp = ax.boxplot(groups.values(), patch_artist=True)
    for patch, color in zip(bp['boxes'], colors):
        patch.set_facecolor(color)
    ax.set_title(f'{category} - how2matplotlib.com')
    ax.set_xticklabels(groups.keys())

# Add legend
fig.legend(bp['boxes'], groups.keys(), loc='upper center', ncol=3)

plt.tight_layout()
plt.show()
Output:
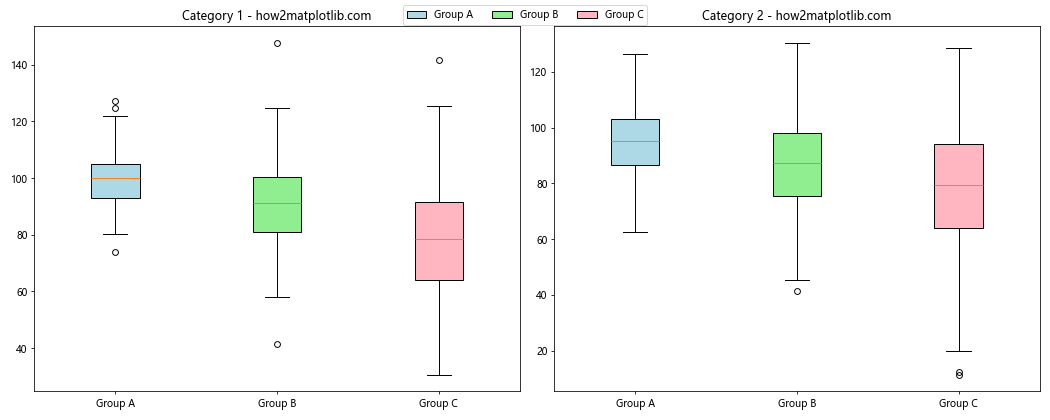
In this example, we’ve created two subplots, each representing a different category. We’ve added a single legend for both subplots at the top of the figure. This method of adding legend to boxplot with multiple plots is particularly useful when dealing with multiple categories or datasets.
Best Practices for Adding Legend to Boxplot with Multiple Plots
When adding legend to boxplot with multiple plots, it’s important to follow some best practices to ensure your visualizations are clear and effective:
- Consistency: Use consistent colors and styles across your boxplots and legends.
- Placement: Choose a legend placement that doesn’t obscure important data points.
- Clarity: Use clear, concise labels in your legend.
- Size: Ensure your legend is large enough to be easily readable.
- Contrast: Use colors that contrast well with your background.
Let’s implement these best practices in an example:
import matplotlib.pyplot as plt
import numpy as np

# Generate sample data
np.random.seed(42)
data = {
    'Product A': np.random.normal(100, 10, 200),
    'Product B': np.random.normal(90, 15, 200),
    'Product C': np.random.normal(80, 20, 200),
    'Product D': np.random.normal(70, 25, 200)
}

# Create boxplot
fig, ax = plt.subplots(figsize=(12, 6))
bp = ax.boxplot(data.values(), patch_artist=True)

# Customize boxplot colors
colors = ['#FF9999', '#66B2FF', '#99FF99', '#FFCC99']
for patch, color in zip(bp['boxes'], colors):
    patch.set_facecolor(color)

# Add legend with best practices
ax.legend(bp['boxes'], data.keys(),
          loc='upper left',
          fontsize=10,
          title='Products',
          title_fontsize=12,
          framealpha=0.7,
          edgecolor='black')

plt.title('Sales Performance - Adding Legend to Boxplot with Multiple Plots\nhow2matplotlib.com', fontsize=14)
plt.ylabel('Sales (in thousands)', fontsize=12)
plt.xlabel('Products', fontsize=12)
plt.grid(True, linestyle='--', alpha=0.7)

plt.tight_layout()
plt.show()
Output:
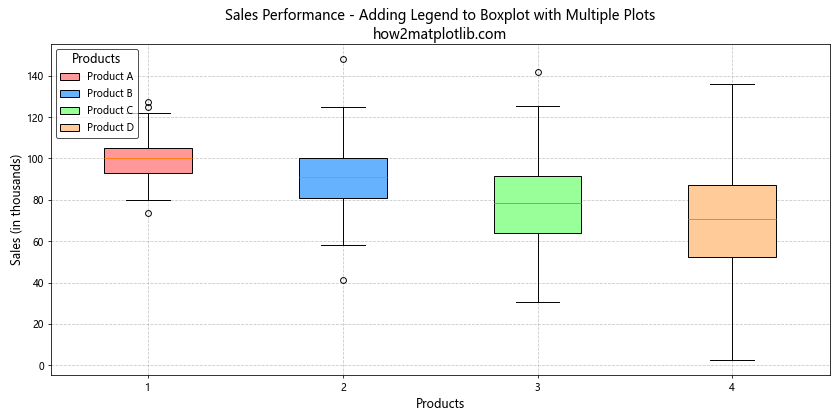
In this example, we’ve implemented several best practices for adding legend to boxplot with multiple plots:
- We’ve used distinct, visually appealing colors for each boxplot.
- The legend is placed in the upper left corner to avoid obscuring data.
- We’ve added a title to the legend for additional clarity.
- The legend has a semi-transparent background with a border for better visibility.
- We’ve adjusted font sizes for readability.
- We’ve added meaningful axis labels and a grid for better context.
Customizing Legend When Adding Legend to Boxplot with Multiple Plots
Matplotlib offers numerous options for customizing legends when adding legend to boxplot with multiple plots. Let’s explore some of these options:
Changing Legend Style
You can customize the appearance of your legend by changing its style. Here’s an example:
import matplotlib.pyplot as plt
import numpy as np

# Generate sample data
np.random.seed(42)
data = {
    'Group A': np.random.normal(100, 10, 200),
    'Group B': np.random.normal(90, 15, 200),
    'Group C': np.random.normal(80, 20, 200)
}

# Create boxplot
fig, ax = plt.subplots(figsize=(10, 6))
bp = ax.boxplot(data.values(), patch_artist=True)

# Customize boxplot colors
colors = ['#FF9999', '#66B2FF', '#99FF99']
for patch, color in zip(bp['boxes'], colors):
    patch.set_facecolor(color)

# Add customized legend
legend = ax.legend(bp['boxes'], data.keys(),
                   loc='upper right',
                   fontsize=10,
                   title='Groups',
                   title_fontsize=12,
                   framealpha=0.8,
                   edgecolor='black',
                   fancybox=True,
                   shadow=True,
                   borderpad=1)

plt.title('Customized Legend - Adding Legend to Boxplot with Multiple Plots\nhow2matplotlib.com', fontsize=14)
plt.show()
Output:
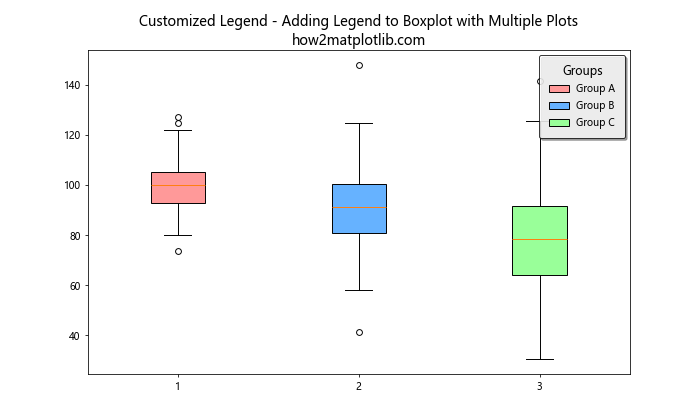
In this example, we’ve customized the legend by adding a shadow, making it semi-transparent, and giving it a fancy box style. These customizations can help make your legend stand out when adding legend to boxplot with multiple plots.
Using a Custom Legend
Sometimes, you might want to create a custom legend that’s not directly tied to the boxplot elements. Here’s how you can do that:
import matplotlib.pyplot as plt
import numpy as np

# Generate sample data
np.random.seed(42)
data = {
    'Category A': np.random.normal(100, 10, 200),
    'Category B': np.random.normal(90, 15, 200),
    'Category C': np.random.normal(80, 20, 200)
}

# Create boxplot
fig, ax = plt.subplots(figsize=(10, 6))
bp = ax.boxplot(data.values(), patch_artist=True)

# Customize boxplot colors
colors = ['#FF9999', '#66B2FF', '#99FF99']
for patch, color in zip(bp['boxes'], colors):
    patch.set_facecolor(color)

# Create custom legend
legend_elements = [plt.Rectangle((0,0),1,1,fc=color, edgecolor='none') for color in colors]
ax.legend(legend_elements, data.keys(),
          loc='upper right',
          title='Categories',
          title_fontsize=12)

plt.title('Custom Legend - Adding Legend to Boxplot with Multiple Plots\nhow2matplotlib.com', fontsize=14)
plt.show()
Output:
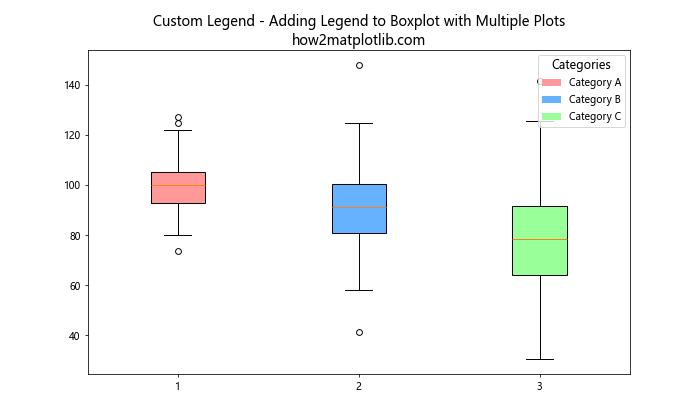
In this example, we’ve created custom legend elements using rectangles that match the colors of our boxplots. This gives us more control over the appearance of our legend when adding legend to boxplot with multiple plots.
Handling Overlapping Legends When Adding Legend to Boxplot with Multiple Plots
When dealing with multiple boxplots, you might encounter situations where the legend overlaps with the plot. Here are some strategies to handle this:
Adjusting Plot Layout
One approach is to adjust the layout of your plot to make room for the legend. Here’s an example:
import matplotlib.pyplot as plt
import numpy as np

# Generate sample data
np.random.seed(42)
data = {f'Group {i}': np.random.normal(100 - i*10, 10 + i*5, 200) for i in range(1, 6)}

# Create boxplot
fig, ax = plt.subplots(figsize=(12, 6))
bp = ax.boxplot(data.values(), patch_artist=True)

# Customize boxplot colors
colors = plt.cm.Set3(np.linspace(0, 1, len(data)))
for patch, color in zip(bp['boxes'], colors):
    patch.set_facecolor(color)

# Adjust plot layout
plt.subplots_adjust(right=0.7)

# Add legend
ax.legend(bp['boxes'], data.keys(),
          loc='center left',
          bbox_to_anchor=(1, 0.5),
          title='Groups',
          title_fontsize=12)

plt.title('Adjusted Layout - Adding Legend to Boxplot with Multiple Plots\nhow2matplotlib.com', fontsize=14)
plt.show()
Output:
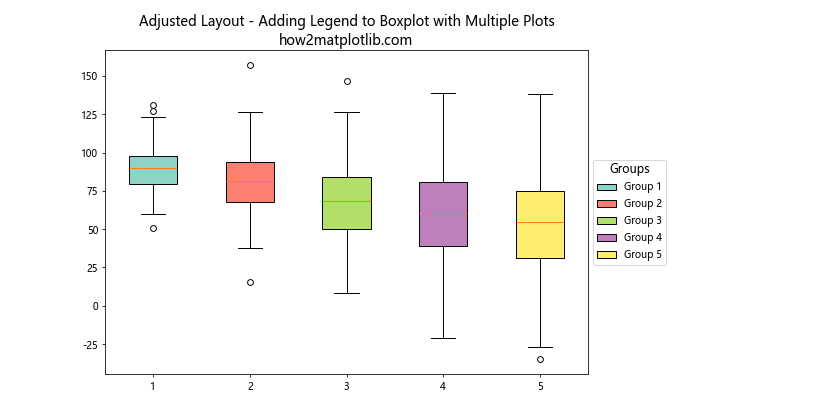
In this example, we’ve used plt.subplots_adjust() to reduce the width of the plot area, making room for the legend on the right side. We’ve also used bbox_to_anchor to position the legend outside the plot area. This approach is particularly useful when adding legend to boxplot with multiple plots that take up a lot of space.
Using a Two-Column Legend
Another strategy for handling overlapping legends when adding legend to boxplot with multiple plots is to use a two-column legend. Here’s how you can do this:
import matplotlib.pyplot as plt
import numpy as np

# Generate sample data
np.random.seed(42)
data = {f'Group {i}': np.random.normal(100 - i*5, 10 + i*2, 200) for i in range(1, 9)}

# Create boxplot
fig, ax = plt.subplots(figsize=(12, 6))
bp = ax.boxplot(data.values(), patch_artist=True)

# Customize boxplot colors
colors = plt.cm.Set3(np.linspace(0, 1, len(data)))
for patch, color in zip(bp['boxes'], colors):
    patch.set_facecolor(color)

# Add two-column legend
ax.legend(bp['boxes'], data.keys(),
          loc='upper center',
          bbox_to_anchor=(0.5, -0.05),
          ncol=2,
          title='Groups',
          title_fontsize=12)

plt.title('Two-Column Legend - Adding Legend to Boxplot with Multiple Plots\nhow2matplotlib.com', fontsize=14)
plt.tight_layout()
plt.show()
Output:
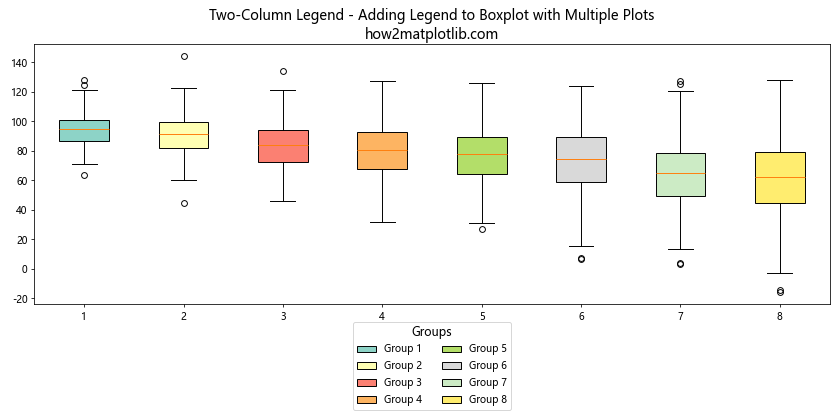
In this example, we’ve used the ncol parameter in the legend() function to create a two-column legend. We’ve also positioned the legend below the plot using bbox_to_anchor. This approach can be very effective when adding legend to boxplot with multiple plots, especially when you have a large number of categories.
Adding Legend to Boxplot with Multiple Plots: Comparing Different Groups
Sometimes, you might want to compare different groups within the same plot. Here’s an example of how to add legend to boxplot with multiple plots in this scenario:
import matplotlib.pyplot as plt
import numpy as np

# Generate sample data
np.random.seed(42)
data = {
    'Group A': {
        'Male': np.random.normal(170, 7, 200),
        'Female': np.random.normal(165, 6, 200)
    },
    'Group B': {
        'Male': np.random.normal(175, 8, 200),
        'Female': np.random.normal(168, 7, 200)
    },
    'Group C': {
        'Male': np.random.normal(172, 9, 200),
        'Female': np.random.normal(166, 8, 200)
    }
}

# Create boxplot
fig, ax = plt.subplots(figsize=(12, 6))

positions = np.arange(len(data)) * 3
colors = ['lightblue', 'lightpink']
width = 0.8

for i, (gender, color) in enumerate(zip(['Male', 'Female'], colors)):
    gender_data = [group[gender] for group in data.values()]
    bp = ax.boxplot(gender_data, positions=positions + i, patch_artist=True, widths=width)
    for patch in bp['boxes']:
        patch.set_facecolor(color)

# Customize x-axis
ax.set_xticks(positions + 0.4)
ax.set_xticklabels(data.keys())

# Add legend
ax.legend([plt.Rectangle((0,0),1,1,fc=c) for c in colors], ['Male', 'Female'], loc='upper right')

plt.title('Comparing Groups - Adding Legend to Boxplot with Multiple Plots\nhow2matplotlib.com', fontsize=14)
plt.ylabel('Height (cm)', fontsize=12)
plt.show()
Output:
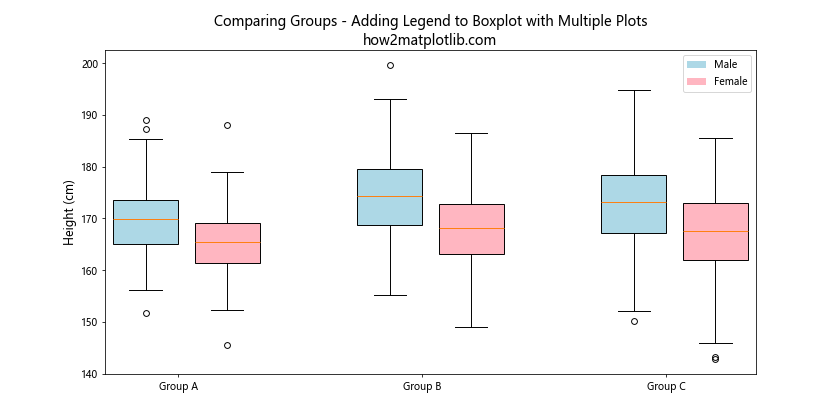
In this example, we’ve created boxplots comparing male and female heights across different groups. We’ve used different colors for each gender and added a legend to distinguish between them. This method of adding legend to boxplot with multiple plots allows for easy comparison between different categories within groups.
Adding Legend to Boxplot with Multiple Plots: Handling Outliers
When adding legend to boxplot with multiple plots, you might want to highlight outliers. Here’s an example of how to do this:
import matplotlib.pyplot as plt
import numpy as np

# Generate sample data
np.random.seed(42)
data = {
    'Group A': np.concatenate([np.random.normal(100, 10, 200), [150, 160]]),
    'Group B': np.concatenate([np.random.normal(90, 15, 200), [140, 145]]),
    'Group C': np.concatenate([np.random.normal(80, 20, 200), [130, 135]])
}

# Create boxplot
fig, ax = plt.subplots(figsize=(10, 6))
bp = ax.boxplot(data.values(), patch_artist=True)

# Customize boxplot colors
colors = ['#FF9999', '#66B2FF', '#99FF99']
for patch, color in zip(bp['boxes'], colors):
    patch.set_facecolor(color)

# Customize outliers
for flier in bp['fliers']:
    flier.set(marker='D', color='red', alpha=0.5)

# Add legend
legend_elements = [plt.Rectangle((0,0),1,1,fc=color, edgecolor='none') for color in colors]
legend_elements.append(plt.Line2D([0], [0], marker='D', color='w', markerfacecolor='red', markersize=10))
ax.legend(legend_elements, list(data.keys()) + ['Outliers'],
          loc='upper right',
          title='Groups',
          title_fontsize=12)

plt.title('Handling Outliers - Adding Legend to Boxplot with Multiple Plots\nhow2matplotlib.com', fontsize=14)
plt.show()
Output:
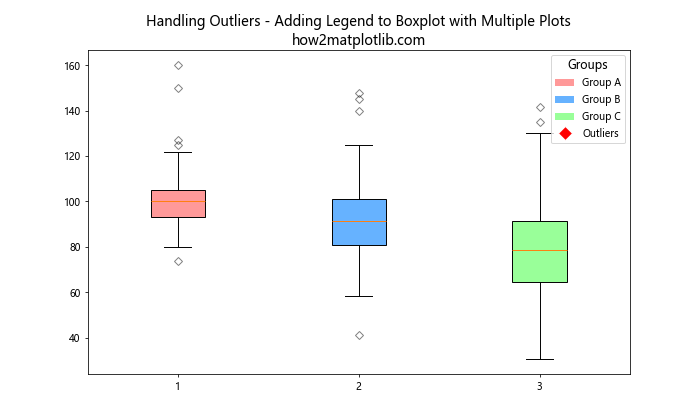
In this example, we’ve customized the appearance of outliers and included them in the legend. This approach can be particularly useful when adding legend to boxplot with multiple plots where outliers are an important part of the data story.
Adding Legend to Boxplot with Multiple Plots: Incorporating Statistical Information
When adding legend to boxplot with multiple plots, you might want to include statistical information in your visualization. Here’s an example of how to do this:
import matplotlib.pyplot as plt
import numpy as np
from scipy import stats

# Generate sample data
np.random.seed(42)
data = {
    'Group A': np.random.normal(100, 10, 200),
    'Group B': np.random.normal(90, 15, 200),
    'Group C': np.random.normal(80, 20, 200)
}

# Create boxplot
fig, ax = plt.subplots(figsize=(12, 6))
bp = ax.boxplot(data.values(), patch_artist=True)

# Customize boxplot colors
colors = ['#FF9999', '#66B2FF', '#99FF99']
for patch, color in zip(bp['boxes'], colors):
    patch.set_facecolor(color)

# Add statistical annotations
for i, (name, group) in enumerate(data.items()):
    mean = np.mean(group)
    median = np.median(group)
    ax.text(i+1, mean, f'Mean: {mean:.2f}', ha='center', va='bottom')
    ax.text(i+1, median, f'Median: {median:.2f}', ha='center', va='top')

# Add legend
legend_elements = [plt.Rectangle((0,0),1,1,fc=color, edgecolor='none') for color in colors]
ax.legend(legend_elements, data.keys(),
          loc='upper right',
          title='Groups',
          title_fontsize=12)

plt.title('Statistical Information - Adding Legend to Boxplot with Multiple Plots\nhow2matplotlib.com', fontsize=14)
plt.show()
Output:
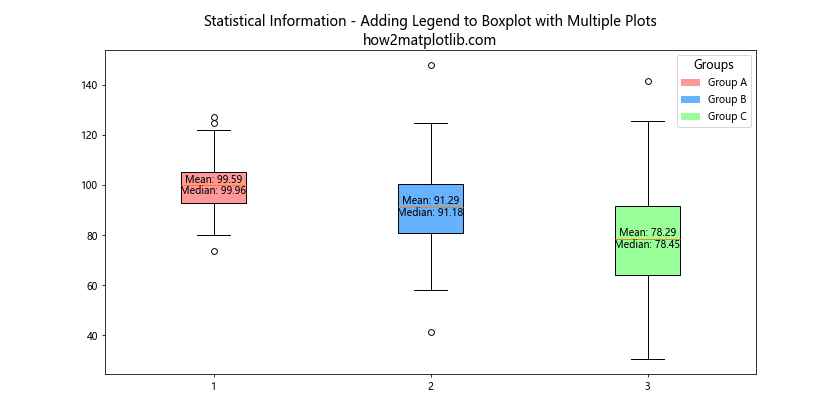
In this example, we’ve added mean and median values as text annotations to each boxplot. This approach provides more detailed information while still maintaining the benefits of adding legend to boxplot with multiple plots.
Conclusion: Mastering the Art of Adding Legend to Boxplot with Multiple Plots
Throughout this comprehensive guide, we’ve explored various techniques and best practices for adding legend to boxplot with multiple plots using Matplotlib. We’ve covered everything from basic methods to advanced techniques, including handling overlapping legends, comparing different groups, dealing with outliers, and incorporating statistical information.