ax.title in Matplotlib
Matplotlib is a powerful plotting library in Python that is used extensively in data visualization. One of the key features of Matplotlib is the ability to customize the appearance of plots, including the titles, labels, and legends. In this article, we will focus specifically on the ax.title method, which is used to set the title of a subplot in a Matplotlib figure.
Understanding ax.title
The ax.title method is part of the axes (ax) object in Matplotlib. It allows you to set the title of an individual subplot. The method provides various parameters to customize the appearance of the title, including the text of the title, the font size, the font weight, and the position.
Basic Usage of ax.title
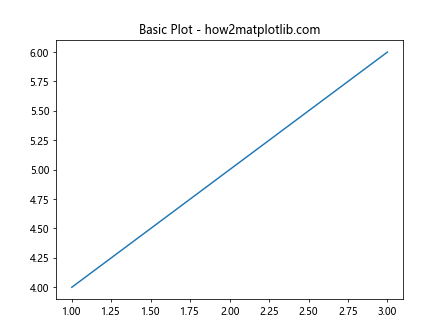
To use ax.title, you first need to create a figure and an axes object. Here is a simple example:
import matplotlib.pyplot as plt

fig, ax = plt.subplots()
ax.plot([1, 2, 3], [4, 5, 6])
ax.set_title('Basic Plot - how2matplotlib.com')
plt.show()
Output:
Customizing the Title
You can customize the appearance of the title using various parameters. Here are some examples:
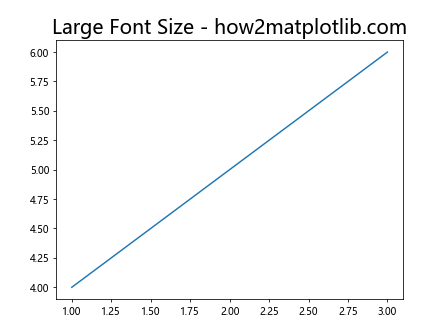
Changing Font Size
import matplotlib.pyplot as plt

fig, ax = plt.subplots()
ax.plot([1, 2, 3], [4, 5, 6])
ax.set_title('Large Font Size - how2matplotlib.com', fontsize=20)
plt.show()
Output:
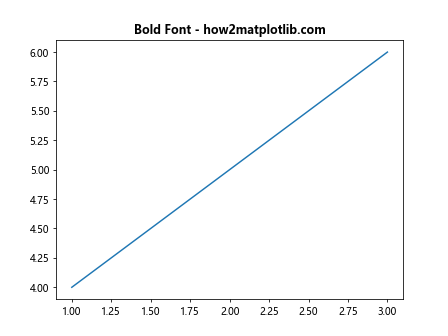
Changing Font Weight
import matplotlib.pyplot as plt

fig, ax = plt.subplots()
ax.plot([1, 2, 3], [4, 5, 6])
ax.set_title('Bold Font - how2matplotlib.com', fontweight='bold')
plt.show()
Output:
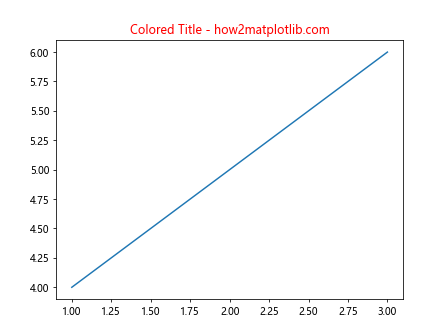
Changing Font Color
import matplotlib.pyplot as plt

fig, ax = plt.subplots()
ax.plot([1, 2, 3], [4, 5, 6])
ax.set_title('Colored Title - how2matplotlib.com', color='red')
plt.show()
Output:
Positioning the Title
The position of the title can also be adjusted. This is particularly useful in complex layouts.
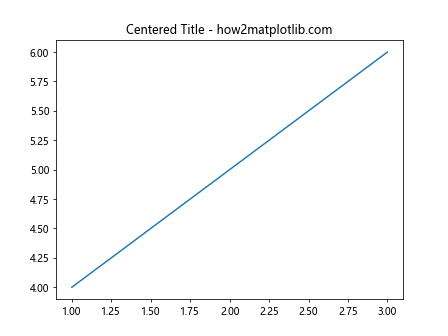
Centering the Title
import matplotlib.pyplot as plt

fig, ax = plt.subplots()
ax.plot([1, 2, 3], [4, 5, 6])
ax.set_title('Centered Title - how2matplotlib.com', loc='center')
plt.show()
Output:
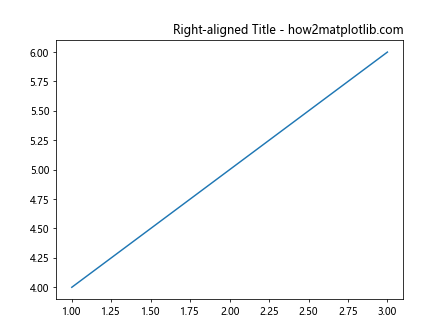
Right-aligning the Title
import matplotlib.pyplot as plt

fig, ax = plt.subplots()
ax.plot([1, 2, 3], [4, 5, 6])
ax.set_title('Right-aligned Title - how2matplotlib.com', loc='right')
plt.show()
Output:
Advanced Title Customization
Matplotlib also allows for more advanced title customizations, such as adding a background color, padding, and using LaTeX formatting.
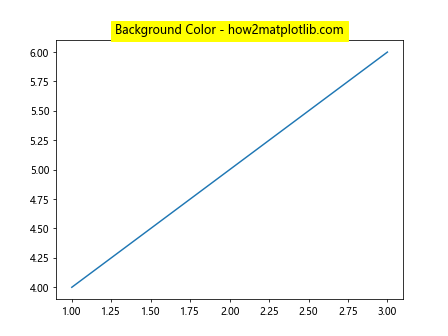
Adding Background Color
import matplotlib.pyplot as plt

fig, ax = plt.subplots()
ax.plot([1, 2, 3], [4, 5, 6])
ax.set_title('Background Color - how2matplotlib.com', backgroundcolor='yellow')
plt.show()
Output:
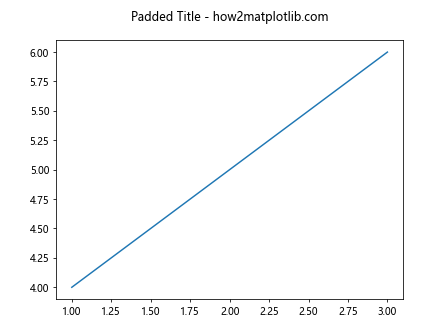
Adding Padding
import matplotlib.pyplot as plt

fig, ax = plt.subplots()
ax.plot([1, 2, 3], [4, 5, 6])
ax.set_title('Padded Title - how2matplotlib.com', pad=20)
plt.show()
Output:
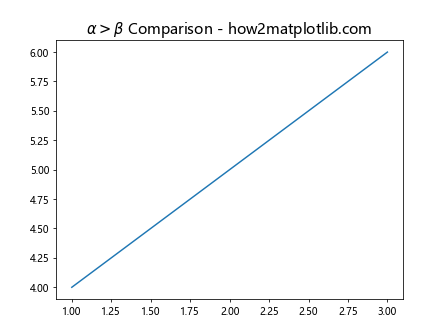
Using LaTeX in Titles
import matplotlib.pyplot as plt

fig, ax = plt.subplots()
ax.plot([1, 2, 3], [4, 5, 6])
ax.set_title(r'$\alpha > \beta$ Comparison - how2matplotlib.com', fontsize=15)
plt.show()
Output:
Conclusion
In this article, we explored the ax.title method in Matplotlib, which is essential for adding titles to subplots. We covered basic usage, customization options including font size, weight, and color, positioning, and advanced features like background color, padding, and LaTeX integration. By mastering ax.title, you can enhance the readability and presentation of your plots, making your data visualizations more effective and appealing.