Comprehensive Guide to Using ax.set_title in Matplotlib
Matplotlib is a powerful library for creating static, interactive, and animated visualizations in Python. One of the fundamental aspects of creating visualizations is adding titles to your plots. Titles provide a context or summarize the visual information which is crucial for making the plots informative and understandable. In this guide, we will explore how to use the ax.set_title method in Matplotlib, providing detailed examples to illustrate various functionalities.
Introduction to ax.set_title
The ax.set_title method is used to set the title of an Axes object in Matplotlib. This method provides flexibility to customize the appearance of the title including its position, font properties, and layout. Before diving into examples, let’s understand the basic syntax of ax.set_title:
ax.set_title(label, fontdict=None, loc='center', pad=None, **kwargs)
- label: This is the text of the title.
- fontdict: A dictionary to override the default text properties.
- loc: This can be ‘left’, ‘center’, or ‘right’. It aligns the title horizontally.
- pad: This is the padding between the axes and the title in points.
- kwargs: Additional keyword arguments are passed to
text.Textobject which represents the title.
Now, let’s explore various examples to understand how to effectively use ax.set_title.
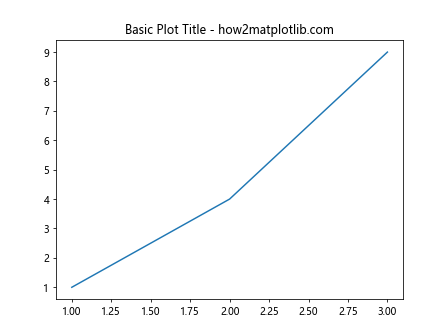
Example 1: Basic Title
Setting a basic title to an Axes object.
import matplotlib.pyplot as plt

fig, ax = plt.subplots()
ax.plot([1, 2, 3], [1, 4, 9])
ax.set_title("Basic Plot Title - how2matplotlib.com")
plt.show()
Output:
Example 2: Title with Font Customizations
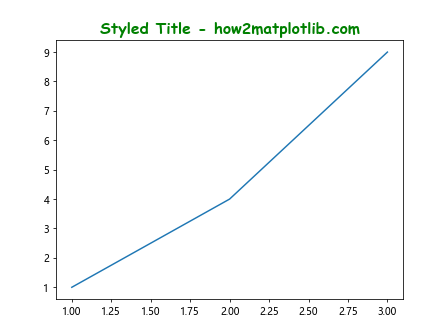
Customizing the font of the title using fontdict.
import matplotlib.pyplot as plt

fig, ax = plt.subplots()
ax.plot([1, 2, 3], [1, 4, 9])
title_font = {'fontname':'Comic Sans MS', 'size':'16', 'color':'green', 'weight':'bold'}
ax.set_title("Styled Title - how2matplotlib.com", fontdict=title_font)
plt.show()
Output:
Example 3: Right-Aligned Title
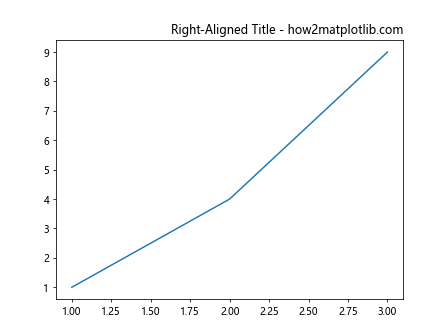
Aligning the title to the right.
import matplotlib.pyplot as plt

fig, ax = plt.subplots()
ax.plot([1, 2, 3], [1, 4, 9])
ax.set_title("Right-Aligned Title - how2matplotlib.com", loc='right')
plt.show()
Output:
Example 4: Title with Padding
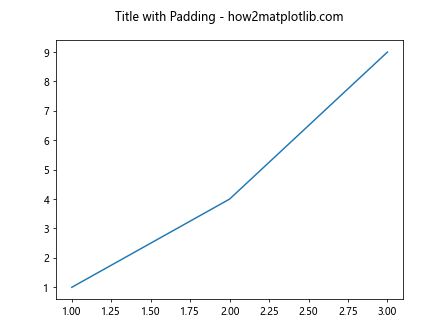
Adding padding between the title and the axes.
import matplotlib.pyplot as plt

fig, ax = plt.subplots()
ax.plot([1, 2, 3], [1, 4, 9])
ax.set_title("Title with Padding - how2matplotlib.com", pad=20)
plt.show()
Output:
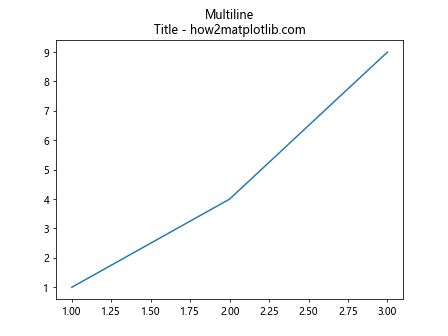
Example 5: Multiline Title
Creating a title that spans multiple lines.
import matplotlib.pyplot as plt

fig, ax = plt.subplots()
ax.plot([1, 2, 3], [1, 4, 9])
ax.set_title("Multiline\nTitle - how2matplotlib.com")
plt.show()
Output:
Example 6: Title with Special Characters
Including special characters in the title.
import matplotlib.pyplot as plt

fig, ax = plt.subplots()
ax.plot([1, 2, 3], [1, 4, 9])
ax.set_title("Title with Special Characters: ©℗® - how2matplotlib.com")
plt.show()
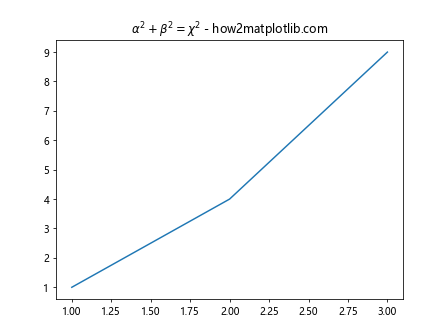
Example 7: Title with Mathematical Expressions
Using LaTeX for mathematical expressions in the title.
import matplotlib.pyplot as plt

fig, ax = plt.subplots()
ax.plot([1, 2, 3], [1, 4, 9])
ax.set_title(r"$\alpha^2 + \beta^2 = \chi^2$ - how2matplotlib.com")
plt.show()
Output:
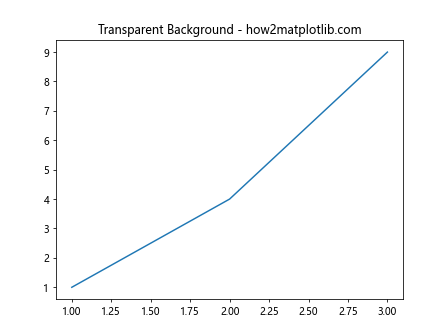
Example 8: Transparent Title Background
Making the title background transparent.
import matplotlib.pyplot as plt

fig, ax = plt.subplots()
ax.plot([1, 2, 3], [1, 4, 9])
ax.set_title("Transparent Background - how2matplotlib.com", backgroundcolor='none')
plt.show()
Output:
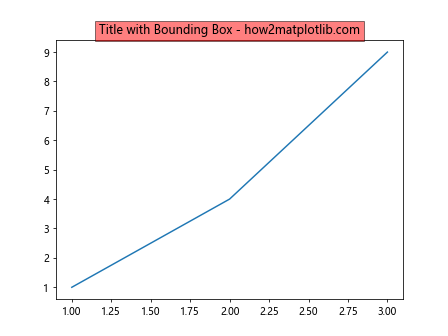
Example 9: Title with Bounding Box
Adding a bounding box around the title.
import matplotlib.pyplot as plt

fig, ax = plt.subplots()
ax.plot([1, 2, 3], [1, 4, 9])
bbox_props = {'facecolor':'red', 'alpha':0.5, 'pad':4}
ax.set_title("Title with Bounding Box - how2matplotlib.com", bbox=bbox_props)
plt.show()
Output:
Example 10: Rotated Title
Rotating the title text.
import matplotlib.pyplot as plt

fig, ax = plt.subplots()
ax.plot([1, 2, 3], [1, 4, 9])
ax.set_title("Rotated Title - how2matplotlib.com", rotation=45)
plt.show()
Output:
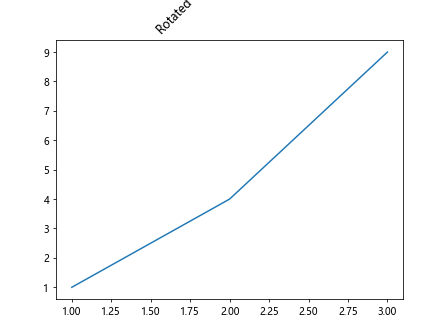
These examples illustrate the versatility of the ax.set_title method in customizing the appearance of plot titles in Matplotlib. By adjusting parameters like font properties, alignment, padding, and rotation, you can enhance the readability and aesthetics of your charts.