Comprehensive Guide to Using ax.set_title in Matplotlib
Matplotlib is a powerful library for creating static, interactive, and animated visualizations in Python. One of the fundamental aspects of creating visualizations is setting titles to your plots. The ax.set_title method is used to add a title to an Axes object in Matplotlib. This guide will provide a detailed explanation of how to use ax.set_title effectively, along with 10-20 standalone examples that demonstrate various features and customizations.
Introduction to ax.set_title
The ax.set_title method is used to set the title of an Axes object in Matplotlib. This method provides flexibility in how the title is displayed, allowing customization of the font size, font weight, position, and more. Setting a title for your plot not only makes it more informative but also enhances the visual appeal.
Syntax of ax.set_title
The basic syntax of ax.set_title is as follows:
Axes.set_title(label, fontdict=None, loc='center', pad=None, **kwargs)
- label: The text of the title.
- fontdict: A dictionary controlling the appearance of the title text, overriding the default font size, weight, and other properties.
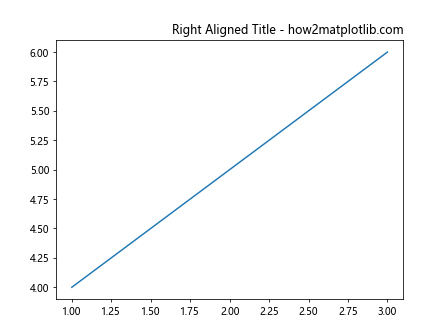
- loc: This parameter can be ‘left’, ‘center’, or ‘right’, and it aligns the title accordingly.
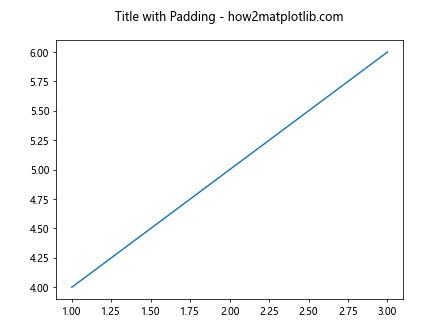
- pad: This parameter sets the padding between the title and the axes in points.
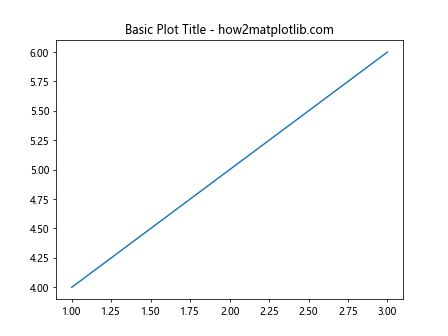
Example 1: Basic Title
import matplotlib.pyplot as plt

fig, ax = plt.subplots()
ax.plot([1, 2, 3], [4, 5, 6])
ax.set_title('Basic Plot Title - how2matplotlib.com')
plt.show()
Output:
Example 2: Title with Font Customizations
import matplotlib.pyplot as plt

fig, ax = plt.subplots()
ax.plot([1, 2, 3], [4, 5, 6])
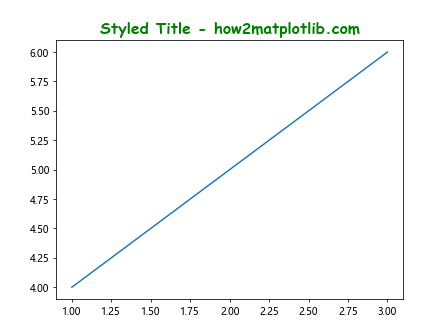
title_font = {'fontname':'Comic Sans MS', 'size':'16', 'color':'green', 'weight':'bold'}
ax.set_title('Styled Title - how2matplotlib.com', fontdict=title_font)
plt.show()
Output:
Example 3: Right-Aligned Title
import matplotlib.pyplot as plt

fig, ax = plt.subplots()
ax.plot([1, 2, 3], [4, 5, 6])
ax.set_title('Right Aligned Title - how2matplotlib.com', loc='right')
plt.show()
Output:
Example 4: Title with Padding
import matplotlib.pyplot as plt

fig, ax = plt.subplots()
ax.plot([1, 2, 3], [4, 5, 6])
ax.set_title('Title with Padding - how2matplotlib.com', pad=20)
plt.show()
Output:
Advanced Title Customizations
Beyond basic text and alignment, ax.set_title allows for advanced typographic and layout customizations. This section explores deeper customizations such as multi-line titles and using LaTeX formatted text.
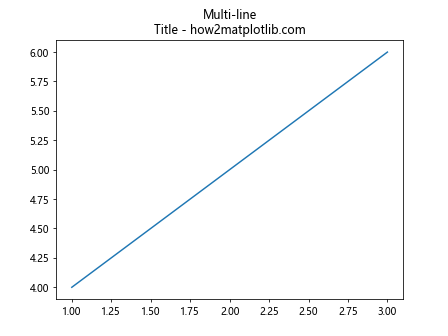
Example 5: Multi-line Title
import matplotlib.pyplot as plt

fig, ax = plt.subplots()
ax.plot([1, 2, 3], [4, 5, 6])
ax.set_title("Multi-line\nTitle - how2matplotlib.com")
plt.show()
Output:
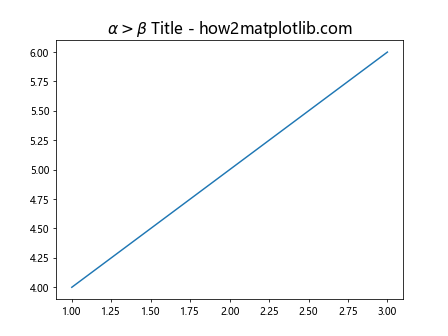
Example 6: Title with LaTeX Formatting
import matplotlib.pyplot as plt

fig, ax = plt.subplots()
ax.plot([1, 2, 3], [4, 5, 6])
ax.set_title(r'$\alpha > \beta$ Title - how2matplotlib.com', fontsize=16)
plt.show()
Output:
Positioning and Layout Considerations
Positioning the title correctly can be crucial for layout, especially when dealing with subplots or complex figures. This section covers how to adjust the title position relative to the Axes and the figure as a whole.
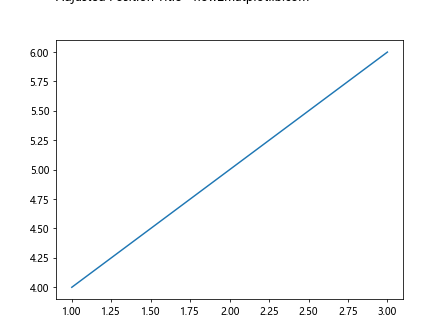
Example 7: Adjusting Title Position
import matplotlib.pyplot as plt

fig, ax = plt.subplots()
ax.plot([1, 2, 3], [4, 5, 6])
ax.set_title('Adjusted Position Title - how2matplotlib.com', loc='left', pad=40)
plt.show()
Output:
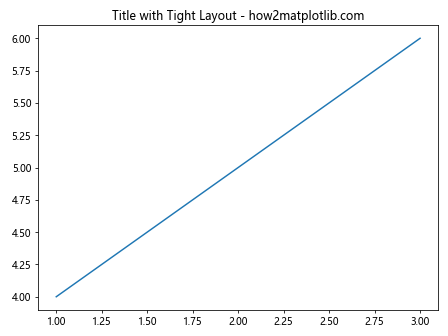
Example 8: Title with Figure Tight Layout
import matplotlib.pyplot as plt

fig, ax = plt.subplots()
ax.plot([1, 2, 3], [4, 5, 6])
ax.set_title('Title with Tight Layout - how2matplotlib.com')
fig.tight_layout(pad=1)
plt.show()
Output:
Conclusion
Setting titles in Matplotlib using ax.set_title is a straightforward yet powerful way to enhance your visualizations. By customizing the title’s text, style, and position, you can make your plots more informative and visually appealing. This guide has provided a comprehensive overview and practical examples to help you master the use of ax.set_title in your plotting endeavors.
Remember, effective visualization is not just about presenting data but also about communicating information clearly and efficiently. Titles play a crucial role in this communication by setting the context and framing the data presented.