Comprehensive Guide to ax.scatter in Matplotlib
Matplotlib is a powerful library for creating static, interactive, and animated visualizations in Python. One of the most useful functions in Matplotlib is ax.scatter, which is used for creating scatter plots. This article provides a detailed guide on how to use ax.scatter effectively, including a variety of examples to illustrate different functionalities and customizations.
Introduction to ax.scatter
The ax.scatter method in Matplotlib is part of the object-oriented API, which allows for the creation of scatter plots. Scatter plots are useful for visualizing the relationship between two variables, showing how much one variable is affected by another. The basic syntax of ax.scatter is:
scatter(x, y, s=None, c=None, marker=None, cmap=None, norm=None, vmin=None, vmax=None, alpha=None, linewidths=None, edgecolors=None)
x,y: These parameters are arrays or sequences of values representing the positions of points on the X and Y axes.s: Size of the markers.c: Color of the markers. Can be a single color or an array for color mapping.marker: The marker style, e.g., circle, triangle, etc.cmap: Colormap instance or registered colormap name.norm: Normalize object to scale luminance data.vmin,vmax: Limits for normalizing luminance data.alpha: Transparency level of the markers.linewidths: Width of the marker edges.edgecolors: Colors of the marker edges.
Basic Scatter Plot
Let’s start with a basic example of a scatter plot.
Example 1: Basic Scatter Plot
import matplotlib.pyplot as plt

x = [1, 2, 3, 4, 5]
y = [2, 3, 5, 7, 11]

fig, ax = plt.subplots()
ax.scatter(x, y)
plt.title("Basic Scatter Plot - how2matplotlib.com")
plt.xlabel("X Axis")
plt.ylabel("Y Axis")
plt.show()
Output:

Customizing Marker Size
You can customize the size of the markers using the s parameter.
Example 2: Scatter Plot with Custom Marker Size
import matplotlib.pyplot as plt

x = [1, 2, 3, 4, 5]
y = [2, 3, 5, 7, 11]
sizes = [20, 50, 100, 200, 500]

fig, ax = plt.subplots()
ax.scatter(x, y, s=sizes)
plt.title("Scatter Plot with Custom Marker Size - how2matplotlib.com")
plt.xlabel("X Axis")
plt.ylabel("Y Axis")
plt.show()
Output:

Color Mapping
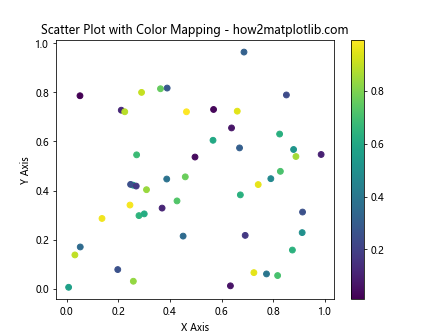
Color mapping is useful for displaying additional variables.
Example 3: Scatter Plot with Color Mapping
import matplotlib.pyplot as plt
import numpy as np

x = np.random.rand(50)
y = np.random.rand(50)
colors = np.random.rand(50)

fig, ax = plt.subplots()
scatter = ax.scatter(x, y, c=colors, cmap='viridis')
plt.colorbar(scatter)
plt.title("Scatter Plot with Color Mapping - how2matplotlib.com")
plt.xlabel("X Axis")
plt.ylabel("Y Axis")
plt.show()
Output:

Using Colormaps
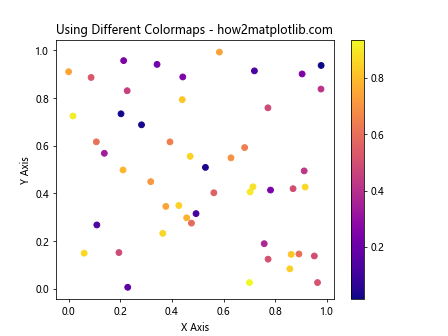
You can use different colormaps to represent data more effectively.
Example 4: Using Different Colormaps
import matplotlib.pyplot as plt
import numpy as np

x = np.random.rand(50)
y = np.random.rand(50)
colors = np.random.rand(50)

fig, ax = plt.subplots()
scatter = ax.scatter(x, y, c=colors, cmap='plasma')
plt.colorbar(scatter)
plt.title("Using Different Colormaps - how2matplotlib.com")
plt.xlabel("X Axis")
plt.ylabel("Y Axis")
plt.show()
Output:

Customizing Marker Edge Color and Line Width
You can customize the edge color and line width of the markers.
Example 5: Customizing Marker Edge Color and Line Width
import matplotlib.pyplot as plt

x = [1, 2, 3, 4, 5]
y = [2, 3, 5, 7, 11]
sizes = [100, 200, 300, 400, 500]
colors = ['red', 'blue', 'green', 'black', 'orange']

fig, ax = plt.subplots()
ax.scatter(x, y, s=sizes, edgecolors='black', linewidths=2, c=colors)
plt.title("Customizing Marker Edge Color and Line Width - how2matplotlib.com")
plt.xlabel("X Axis")
plt.ylabel("Y Axis")
plt.show()
Output:

Transparency
Adjusting the transparency of markers can make plots easier to read when markers overlap.
Example 6: Adjusting Transparency
import matplotlib.pyplot as plt
import numpy as np

x = np.random.rand(100)
y = np.random.rand(100)
colors = np.random.rand(100)
sizes = 1000 * np.random.rand(100)

fig, ax = plt.subplots()
ax.scatter(x, y, c=colors, s=sizes, alpha=0.5, cmap='spring')
plt.title("Adjusting Transparency - how2matplotlib.com")
plt.xlabel("X Axis")
plt.ylabel("Y Axis")
plt.show()
Output:

Conclusion
In this guide, we explored the ax.scatter function in Matplotlib, which is essential for creating scatter plots. We covered basic usage, customization of marker size, color, edge color, transparency, and more. Each example provided a complete, standalone code snippet that can be run to reproduce the visualizations, helping you understand and apply these techniques in your own data visualization tasks.
By mastering ax.scatter, you can create informative and visually appealing scatter plots that can reveal patterns and relationships in your data, making it an invaluable tool in your data analysis and visualization toolkit.