Comprehensive Guide to Using axhline in Matplotlib
Matplotlib is a powerful library for creating static, interactive, and animated visualizations in Python. One of the useful functions provided by Matplotlib is axhline, which allows users to draw horizontal lines across the axis of a plot. This function is particularly useful for highlighting specific data points or trends in data visualization. In this guide, we will explore the axhline function in detail, providing a variety of examples to demonstrate its versatility and utility in different plotting scenarios.
Introduction to axhline
The axhline function in Matplotlib is used to add a horizontal line across the axis of a plot. This function can be called from an Axes object, which is part of the figure. Here is the basic syntax of the axhline function:
Axes.axhline(y=0, xmin=0, xmax=1, **kwargs)
y: The y-coordinate of the horizontal line.xmin: The left end of the line in data coordinates (default is 0).xmax: The right end of the line in data coordinates (default is 1).**kwargs: Additional properties (e.g., color, linestyle, linewidth) can be passed to customize the line.
Basic Usage of axhline
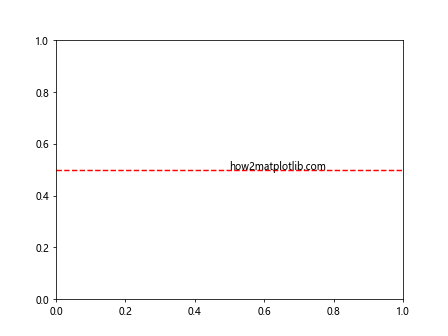
Let’s start with a simple example of how to use axhline to draw a horizontal line at y=0.5 in a plot.
Example 1: Basic Horizontal Line
import matplotlib.pyplot as plt

fig, ax = plt.subplots()
ax.axhline(y=0.5, color='r', linestyle='--')
ax.text(0.5, 0.5, 'how2matplotlib.com', transform=ax.transAxes)
plt.show()
Output:
Customizing Line Properties
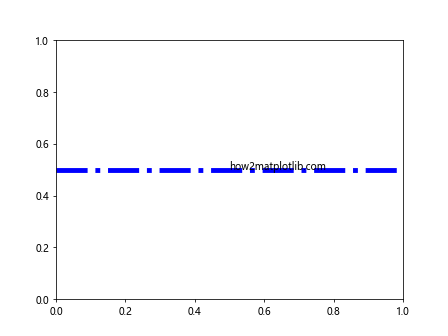
You can customize the appearance of the horizontal line using various parameters like color, linestyle, and linewidth.
Example 2: Customizing Line Style and Width
import matplotlib.pyplot as plt

fig, ax = plt.subplots()
ax.axhline(y=0.5, color='blue', linestyle='-.', linewidth=5)
ax.text(0.5, 0.5, 'how2matplotlib.com', transform=ax.transAxes)
plt.show()
Output:
Extending Lines with xmin and xmax
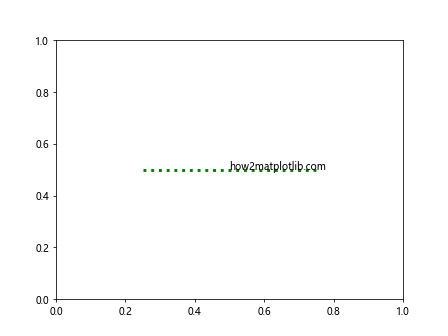
The xmin and xmax parameters control the extent of the horizontal line within the plot. These are normalized from 0 to 1, where 0 is the left of the plot and 1 is the right.
Example 3: Controlling Line Extent
import matplotlib.pyplot as plt

fig, ax = plt.subplots()
ax.axhline(y=0.5, xmin=0.25, xmax=0.75, color='green', linestyle=':', linewidth=3)
ax.text(0.5, 0.5, 'how2matplotlib.com', transform=ax.transAxes)
plt.show()
Output:
Using axhline in Subplots
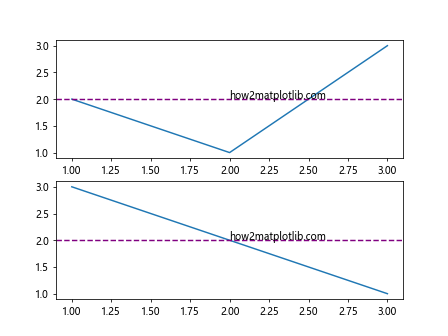
axhline can be particularly useful when working with multiple subplots, as it allows you to highlight specific y-values across different axes.
Example 4: Horizontal Lines in Subplots
import matplotlib.pyplot as plt

fig, (ax1, ax2) = plt.subplots(2, 1)
ax1.plot([1, 2, 3], [2, 1, 3])
ax1.axhline(y=2, color='purple', linestyle='--')
ax1.text(0.5, 0.5, 'how2matplotlib.com', transform=ax1.transAxes)

ax2.plot([1, 2, 3], [3, 2, 1])
ax2.axhline(y=2, color='purple', linestyle='--')
ax2.text(0.5, 0.5, 'how2matplotlib.com', transform=ax2.transAxes)

plt.show()
Output:
Highlighting Data Points
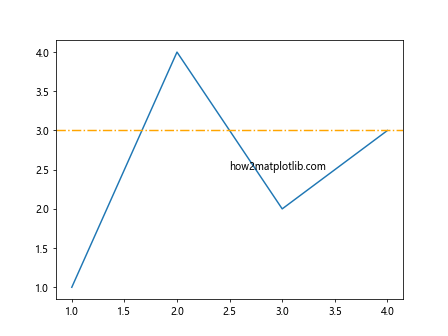
axhline is useful for highlighting specific data points or thresholds in data visualizations.
Example 5: Highlighting Thresholds
import matplotlib.pyplot as plt

fig, ax = plt.subplots()
ax.plot([1, 2, 3, 4], [1, 4, 2, 3])
ax.axhline(y=3, color='orange', linestyle='-.')
ax.text(0.5, 0.5, 'how2matplotlib.com', transform=ax.transAxes)
plt.show()
Output:
Combining axhline with Other Plot Types
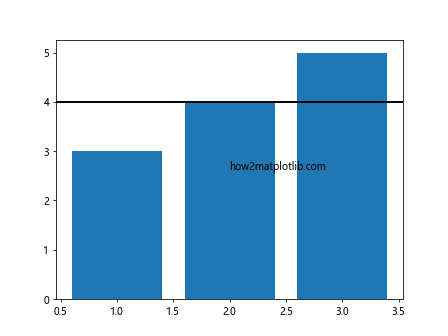
axhline can be combined with other plot types such as bar charts, scatter plots, and histograms to enhance the visual appeal and clarity of data representations.
Example 6: axhline with Bar Chart
import matplotlib.pyplot as plt

fig, ax = plt.subplots()
ax.bar([1, 2, 3], [3, 4, 5])
ax.axhline(y=4, color='black', linewidth=2)
ax.text(0.5, 0.5, 'how2matplotlib.com', transform=ax.transAxes)
plt.show()
Output:
Advanced Customization
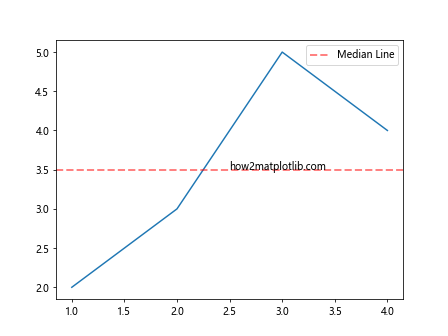
You can further customize axhline by using additional keyword arguments to set properties like alpha (transparency), label (for legends), and zorder (drawing order).
Example 7: Advanced Line Customization
import matplotlib.pyplot as plt

fig, ax = plt.subplots()
ax.plot([1, 2, 3, 4], [2, 3, 5, 4])
ax.axhline(y=3.5, color='red', linestyle='--', linewidth=2, alpha=0.5, label='Median Line')
ax.legend()
ax.text(0.5, 0.5, 'how2matplotlib.com', transform=ax.transAxes)
plt.show()
Output:
Conclusion
The axhline function in Matplotlib is a versatile tool for adding horizontal lines to your plots. Whether you’re highlighting thresholds, emphasizing trends, or simply dividing data visually, axhline provides a straightforward and effective way to enhance your visualizations. By customizing the appearance and behavior of these lines, you can create more informative and appealing charts that better communicate the key insights of your data.
This guide has provided an in-depth look at various uses and customizations of the axhline function, complete with practical examples. By incorporating these techniques into your plotting repertoire, you can elevate the quality and effectiveness of your data visualizations.