Ax Title in Matplotlib
In this article, we will explore how to set and customize the title of an axis (ax title) in Matplotlib, a powerful plotting library in Python. Matplotlib provides extensive control over the appearance and positioning of titles on the axes of a plot. Understanding how to effectively use ax titles can greatly enhance the readability and presentation of a graph.
Introduction to Matplotlib
Matplotlib is a comprehensive library for creating static, animated, and interactive visualizations in Python. It offers an object-oriented API for embedding plots into applications using general-purpose GUI toolkits like Tkinter, wxPython, Qt, or GTK. For simpler use cases, it also provides a pyplot interface, which is reminiscent of MATLAB’s plotting interface.
Setting a Basic Ax Title
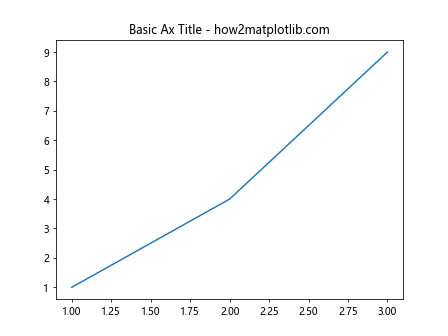
The simplest way to set an ax title in Matplotlib is by using the set_title method of an axes object. Here is an example:
import matplotlib.pyplot as plt

fig, ax = plt.subplots()
ax.plot([1, 2, 3], [1, 4, 9])
ax.set_title("Basic Ax Title - how2matplotlib.com")
plt.show()
Output:
Customizing the Font of the Ax Title
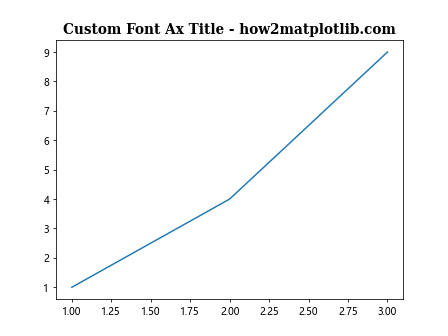
You can customize the appearance of the ax title by adjusting properties such as the font size, font weight, and font family. Here’s how you can change these properties:
import matplotlib.pyplot as plt

fig, ax = plt.subplots()
ax.plot([1, 2, 3], [1, 4, 9])
ax.set_title("Custom Font Ax Title - how2matplotlib.com", fontsize=14, fontweight='bold', fontfamily='serif')
plt.show()
Output:
Positioning the Ax Title
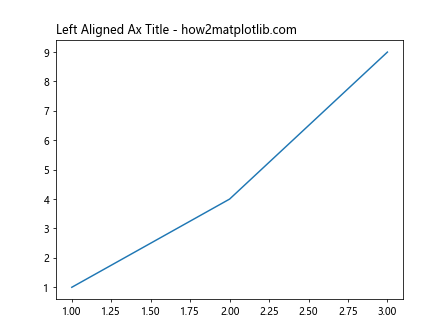
The position of the ax title can be adjusted using the loc parameter. The loc parameter supports values like ‘left’, ‘right’, and ‘center’.
import matplotlib.pyplot as plt

fig, ax = plt.subplots()
ax.plot([1, 2, 3], [1, 4, 9])
ax.set_title("Left Aligned Ax Title - how2matplotlib.com", loc='left')
plt.show()
Output:
Adding Multiple Titles
Sometimes, you might want to add multiple titles to an axis for better clarity or to provide additional information. This can be achieved by creating extra text objects.
import matplotlib.pyplot as
plt

fig, ax = plt.subplots()
ax.plot([1, 2, 3], [1, 4, 9])
ax.set_title("Main Title - how2matplotlib.com", fontsize=16, fontweight='bold')
ax.text(0.5, 1.05, "Subtitle - how2matplotlib.com", transform=ax.transAxes, ha='center', fontsize=10)
plt.show()
Using LaTeX in Ax Titles
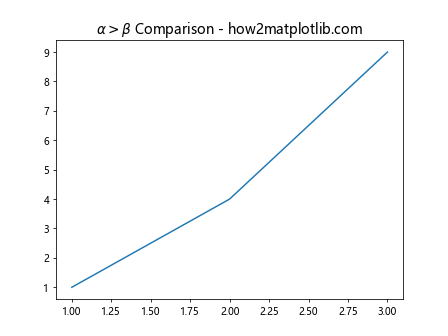
For scientific plots, you may need to include mathematical expressions in your titles. Matplotlib supports LaTeX formatting for text elements.
import matplotlib.pyplot as plt

fig, ax = plt.subplots()
ax.plot([1, 2, 3], [1, 4, 9])
ax.set_title(r"$\alpha > \beta$ Comparison - how2matplotlib.com", fontsize=14)
plt.show()
Output:
Rotating Ax Titles
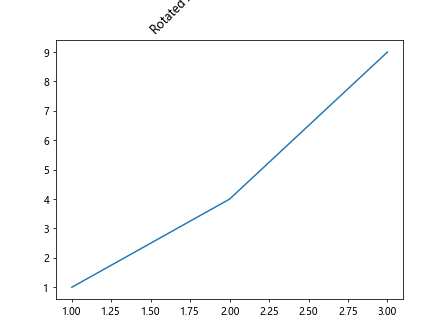
Rotating the ax title can be useful when you need to fit a long title or simply for aesthetic reasons.
import matplotlib.pyplot as plt

fig, ax = plt.subplots()
ax.plot([1, 2, 3], [1, 4, 9])
ax.set_title("Rotated Ax Title - how2matplotlib.com", rotation=45)
plt.show()
Output:
Adjusting Title Padding
The space between the ax title and the axes can be adjusted using the pad parameter. This is particularly useful when the default spacing doesn’t fit well with the overall layout of your plot.
import matplotlib.pyplot as plt

fig, ax = plt.subplots()
ax.plot([1, 2, 3], [1, 4, 9])
ax.set_title("Padded Ax Title - how2matplotlib.com", pad=20)
plt.show()
Output:

Coloring Ax Titles
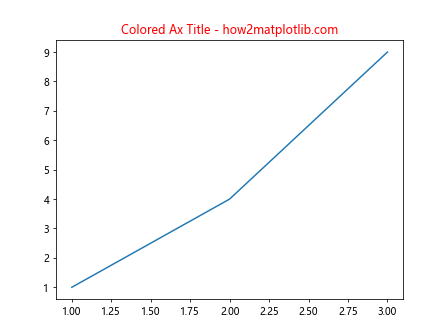
You can set the color of the ax title to enhance readability or to match the theme of your presentation or report.
import matplotlib.pyplot as plt

fig, ax = plt.subplots()
ax.plot([1, 2, 3], [1, 4, 9])
ax.set_title("Colored Ax Title - how2matplotlib.com", color='red')
plt.show()
Output:
Using Different Fonts
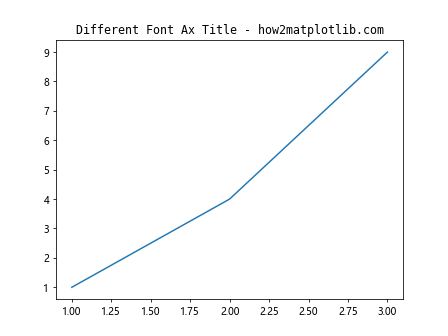
To use different fonts for your ax titles, you can specify the font properties explicitly. This is useful when you need to adhere to specific styling guidelines.
import matplotlib.pyplot as plt

fig, ax = plt.subplots()
ax.plot([1, 2, 3], [1, 4, 9])
ax.set_title("Different Font Ax Title - how2matplotlib.com", family='monospace')
plt.show()
Output:
Conclusion
In this article, we have explored various ways to set and customize the ax titles in Matplotlib. We covered basic title setting, customization of font properties, positioning, and advanced formatting including the use of LaTeX. These techniques are essential for creating professional and informative visualizations. By mastering ax titles, you can significantly improve the readability and effectiveness of your plots.