Ax Title in Matplotlib
Matplotlib is a powerful plotting library in Python that is used extensively in data visualization. One of the key aspects of creating readable and informative plots is the proper use of titles. In this article, we will explore how to manipulate and customize the axes titles in Matplotlib. We will cover various techniques, from basic title setting to advanced customization options.
1. Basic Title Setting
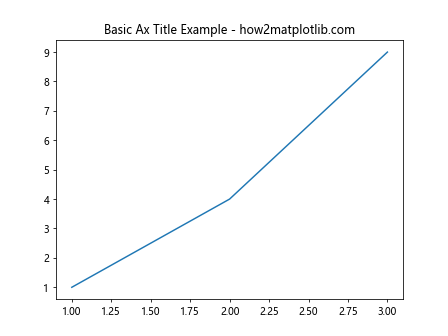
Setting a title for an axis in Matplotlib is straightforward. You can use the set_title method of an axes object. Here is a simple example:
import matplotlib.pyplot as plt

fig, ax = plt.subplots()
ax.plot([1, 2, 3], [1, 4, 9])
ax.set_title("Basic Ax Title Example - how2matplotlib.com")
plt.show()
Output:
2. Font Customization in Titles
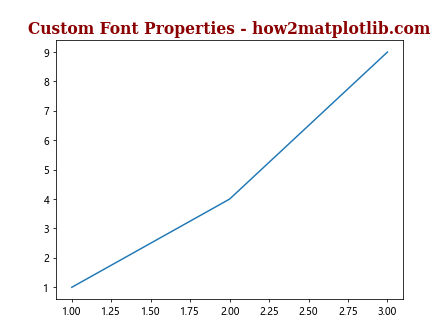
You can customize the font of the title by passing font properties to set_title. Here’s how you can change the font size, style, and weight:
import matplotlib.pyplot as plt

fig, ax = plt.subplots()
ax.plot([1, 2, 3], [1, 4, 9])
title_properties = {
    'family': 'serif',
    'color':  'darkred',
    'weight': 'bold',
    'size': 16,
}
ax.set_title("Custom Font Properties - how2matplotlib.com", fontdict=title_properties)
plt.show()
Output:
3. Positioning the Title
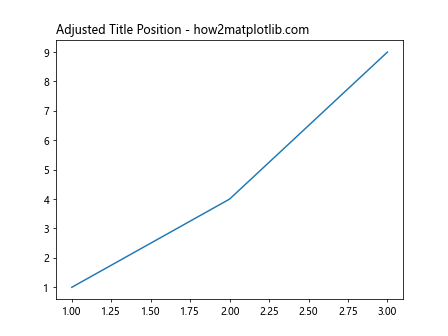
The position of the title can be adjusted relative to the axes. This is useful when you need to fine-tune the layout of your plots.
import matplotlib.pyplot as plt

fig, ax = plt.subplots()
ax.plot([1, 2, 3], [1, 4, 9])
ax.set_title("Adjusted Title Position - how2matplotlib.com", loc='left')
plt.show()
Output:
4. Adding Subtitles
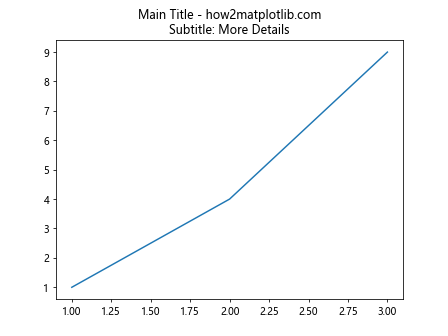
Sometimes, you might want to add a subtitle below the main title. This can be achieved by using the title method with newline characters.
import matplotlib.pyplot as plt

fig, ax = plt.subplots()
ax.plot([1, 2, 3], [1, 4, 9])
ax.set_title("Main Title - how2matplotlib.com\nSubtitle: More Details", loc='center')
plt.show()
Output:
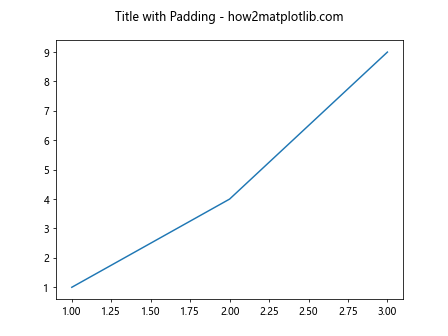
5. Title Padding
Adjusting the padding between the title and the axes can help in fine-tuning the appearance of the plot.
import matplotlib.pyplot as plt

fig, ax = plt.subplots()
ax.plot([1, 2, 3], [1, 4, 9])
ax.set_title("Title with Padding - how2matplotlib.com", pad=20)
plt.show()
Output:
6. Rotating Titles
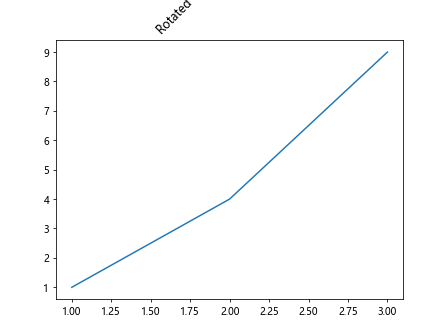
In some cases, especially in subplots, you might want to rotate the title for better spacing or visibility.
import matplotlib.pyplot as plt

fig, ax = plt.subplots()
ax.plot([1, 2, 3], [1, 4, 9])
ax.set_title("Rotated Title - how2matplotlib.com", rotation=45)
plt.show()
Output:
7. Multi-line Titles
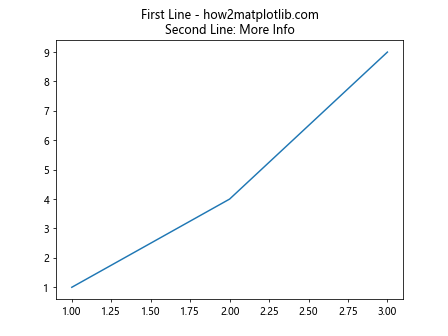
For more descriptive titles, you might need to use multiple lines. This can be done by inserting newline characters in the title string.
import matplotlib.pyplot as plt

fig, ax = plt.subplots()
ax.plot([1, 2, 3], [1, 4, 9])
ax.set_title("First Line - how2matplotlib.com\nSecond Line: More Info")
plt.show()
Output:
8. Using LaTeX in Titles
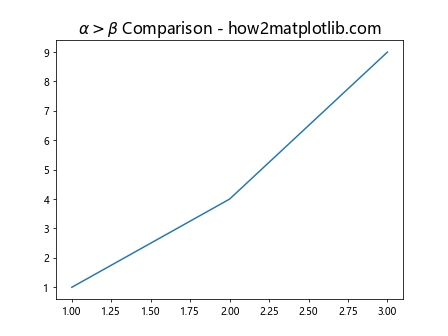
For scientific plots, you might need to include mathematical expressions in titles. Matplotlib supports LaTeX formatting.
import matplotlib.pyplot as plt

fig, ax = plt.subplots()
ax.plot([1, 2, 3], [1, 4, 9])
ax.set_title(r"$\alpha > \beta$ Comparison - how2matplotlib.com", fontsize=16)
plt.show()
Output:
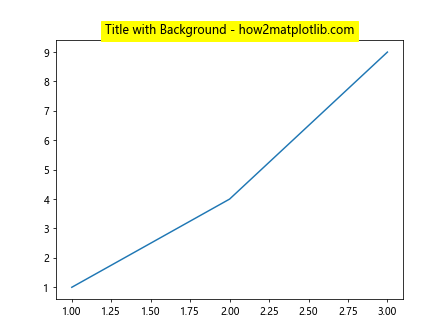
9. Title with Background Color
Setting a background color for the title can make it stand out more, especially in complex plots.
import matplotlib.pyplot as plt

fig, ax = plt.subplots()
ax.plot([1, 2, 3], [1, 4, 9])
ax.set_title("Title with Background - how2matplotlib.com", backgroundcolor='yellow')
plt.show()
Output:
10. Transparent Title Background
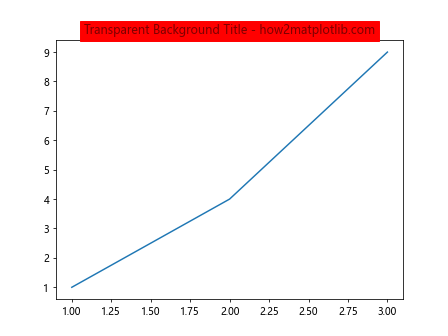
Sometimes, a subtle effect can be achieved by making the title background slightly transparent.
import matplotlib.pyplot as plt

fig, ax = plt.subplots()
ax.plot([1, 2, 3], [1, 4, 9])
ax.set_title("Transparent Background Title - how2matplotlib.com", backgroundcolor='red', alpha=0.5)
plt.show()
Output:
In conclusion, customizing the title of an axis in Matplotlib is a powerful way to enhance the readability and appearance of your plots. By adjusting the font, position, and style of the title, you can convey a lot of information in a clear and aesthetically pleasing manner. Whether you are preparing plots for a scientific publication or a business report, mastering these techniques will greatly enhance your data visualization skills.