Automatically Rescale ylim and xlim in Matplotlib
In data visualization, ensuring that your plots accurately reflect the scale and distribution of your data is crucial. Matplotlib, a popular plotting library in Python, provides extensive functionalities for creating static, interactive, and animated visualizations. One common requirement is to automatically adjust the y-axis and x-axis limits (ylim and xlim) based on the data or specific criteria. This article explores various methods to automatically rescale ylim and xlim in Matplotlib, enhancing the adaptability and readability of plots.
Understanding ylim and xlim
Before diving into the methods to rescale these limits, it’s important to understand what ylim and xlim are. In Matplotlib, ylim and xlim are properties of the axes that define the range of values shown on the y-axis and x-axis respectively. By default, Matplotlib tries to set these limits to encompass all data points tightly. However, in many cases, customizing these limits is necessary to highlight specific aspects of the data.
Basic Usage of ylim and xlim
Let’s start with the basic usage of setting ylim and xlim.
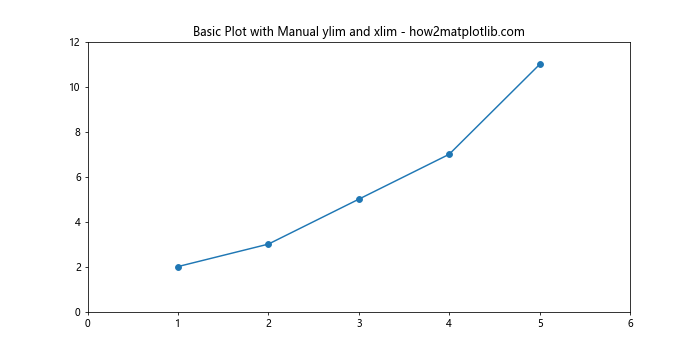
Example 1: Setting ylim and xlim Manually
import matplotlib.pyplot as plt

# Sample data
x = [1, 2, 3, 4, 5]
y = [2, 3, 5, 7, 11]

plt.figure(figsize=(10, 5))
plt.plot(x, y, marker='o')
plt.ylim(0, 12)  # Set y-axis limits
plt.xlim(0, 6)   # Set x-axis limits
plt.title("Basic Plot with Manual ylim and xlim - how2matplotlib.com")
plt.show()
Output:
Automatically Adjusting ylim and xlim
To make plots more dynamic and adaptable to different datasets, automatic adjustment of ylim and xlim is often preferable.
Example 2: Auto-Rescaling with relim and autoscale_view
import matplotlib.pyplot as plt
import numpy as np

# Generating random data
x = np.random.randn(100)
y = np.random.randn(100)

plt.figure(figsize=(10, 5))
plt.scatter(x, y)
plt.gca().relim()  # Recalculate limits
plt.gca().autoscale_view()  # Auto-scale the view
plt.title("Auto-Rescaled Axes with relim and autoscale_view - how2matplotlib.com")
plt.show()
Output:
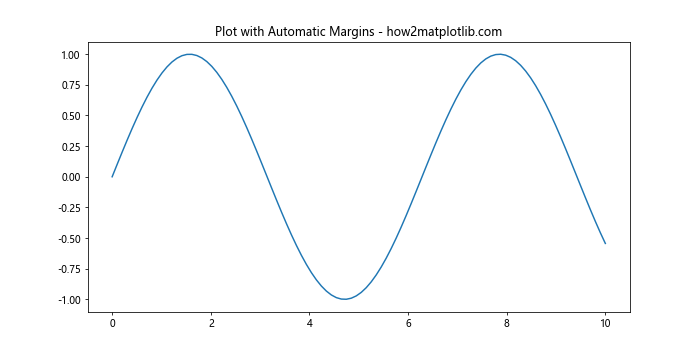
Example 3: Using margins
import matplotlib.pyplot as plt
import numpy as np

x = np.linspace(0, 10, 100)
y = np.sin(x)

plt.figure(figsize=(10, 5))
plt.plot(x, y)
plt.margins(0.05)  # Add 5% padding to the autoscaling
plt.title("Plot with Automatic Margins - how2matplotlib.com")
plt.show()
Output:
Advanced Rescaling Techniques
For more control over the rescaling behavior, you can use event handlers or update the limits based on specific conditions.
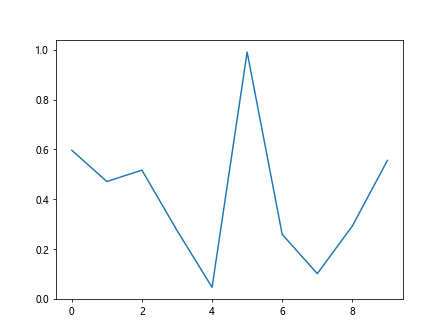
Example 4: Dynamic Rescaling Based on Updated Data
import matplotlib.pyplot as plt
import numpy as np

class DynamicUpdate:
    def __init__(self):
        self.fig, self.ax = plt.subplots()
        self.xdata = []
        self.ydata = []
        self.ax.set_title("Dynamic Rescaling Plot - how2matplotlib.com")

    def add_point(self, x, y):
        self.xdata.append(x)
        self.ydata.append(y)
        self.ax.cla()  # Clear the current axes
        self.ax.plot(self.xdata, self.ydata)
        self.ax.relim()  # Recalculate limits
        self.ax.autoscale_view()  # Auto-scale the view
        plt.draw()

# Usage
updater = DynamicUpdate()
for i in range(10):
    updater.add_point(i, np.random.rand())

plt.show()
Output:
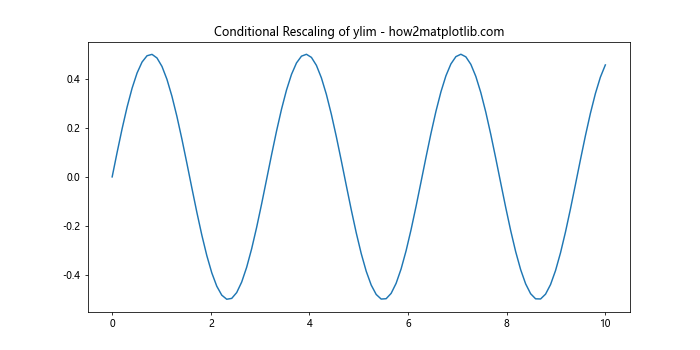
Example 5: Conditional Rescaling
import matplotlib.pyplot as plt
import numpy as np

x = np.linspace(0, 10, 100)
y = np.sin(x) * np.cos(x)

plt.figure(figsize=(10, 5))
plt.plot(x, y)
current_ylim = plt.ylim()
if current_ylim[0] > -0.5:
    plt.ylim(-0.5, current_ylim[1])  # Adjust y-axis limit conditionally
plt.title("Conditional Rescaling of ylim - how2matplotlib.com")
plt.show()
Output:
Conclusion
In this article, we explored various methods to automatically rescale ylim and xlim in Matplotlib. These techniques allow for dynamic and adaptable visualizations that can adjust to different datasets and specific visualization needs. By understanding and utilizing these methods, you can enhance the clarity and effectiveness of your data visualizations.
This guide provided a comprehensive look at automatic rescaling techniques in Matplotlib, complete with practical examples. Whether you are dealing with simple plots or complex dynamic visualizations, these strategies will help ensure that your plots are always optimally scaled to your data.