Automatically Position Text Box in Matplotlib
Matplotlib is a powerful library for creating static, interactive, and animated visualizations in Python. One of the common tasks when creating graphs is to add text boxes that provide additional information about the data being visualized. Positioning these text boxes can sometimes be challenging, especially when dealing with dynamic data where the layout isn’t fixed. In this article, we will explore various methods to automatically position text boxes in Matplotlib plots, ensuring that the text is both readable and aesthetically pleasing.
Introduction to Text Boxes in Matplotlib
Text boxes in Matplotlib are used to display text inside a box. These boxes can contain annotations, explanations, or any other information that enhances the understanding of the plot. The positioning of these boxes is crucial as it affects the readability and the overall look of the visualization.
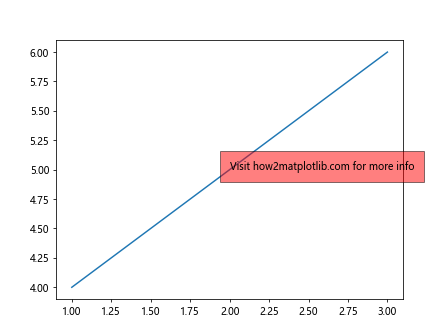
Example 1: Basic Text Box
import matplotlib.pyplot as plt

fig, ax = plt.subplots()
ax.plot([1, 2, 3], [4, 5, 6])

# Adding a basic text box
ax.text(2, 5, 'Visit how2matplotlib.com for more info', style='italic', bbox={'facecolor': 'red', 'alpha': 0.5, 'pad': 10})

plt.show()
Output:
Automatic Positioning Techniques
The challenge with positioning text boxes is ensuring that they do not overlap with any important elements of the plot, such as data points or labels. Matplotlib provides several tools and techniques to help automate this process.
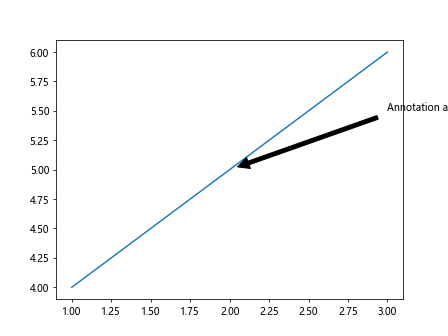
Example 2: Using annotate with a Data Coordinate
import matplotlib.pyplot as plt

fig, ax = plt.subplots()
ax.plot([1, 2, 3], [4, 5, 6])

# Using annotate to position text
ax.annotate('Annotation at how2matplotlib.com', xy=(2, 5), xytext=(3, 5.5),
            arrowprops=dict(facecolor='black', shrink=0.05))

plt.show()
Output:
Example 3: Adjusting Text Position Based on Data
import matplotlib.pyplot as plt
import numpy as np

x = np.linspace(0, 10, 100)
y = np.sin(x)

fig, ax = plt.subplots()
ax.plot(x, y)

# Automatically adjusting text position
max_y = np.max(y)
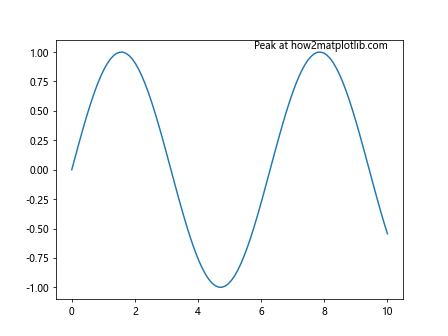
ax.text(x[np.argmax(y)], max_y, 'Peak at how2matplotlib.com', horizontalalignment='center', verticalalignment='bottom')

plt.show()
Output:
Using Bounding Boxes to Avoid Overlap
Bounding boxes can be used to detect overlaps and adjust the positions of text boxes accordingly.
Example 4: Checking Overlap
import matplotlib.pyplot as plt
import numpy as np

fig, ax = plt.subplots()
ax.plot([1, 2, 3], [4, 5, 6])

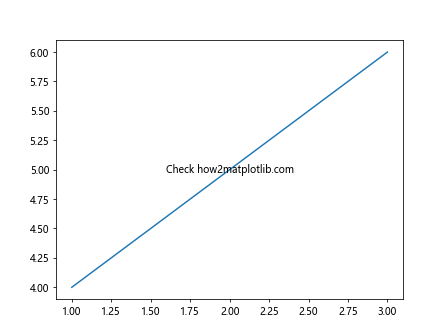
text = ax.text(2, 5, 'Check how2matplotlib.com', va='center', ha='center')

# Check if text overlaps with any other elements
renderer = fig.canvas.get_renderer()
bbox = text.get_window_extent(renderer=renderer)
is_overlapping = bbox.overlaps(ax.bbox)

plt.show()
Output:
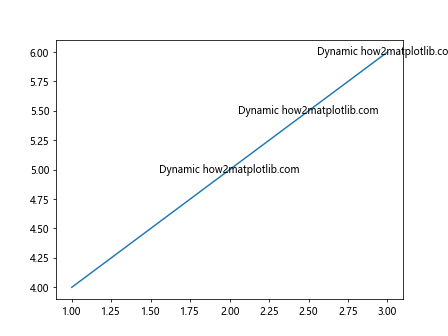
Example 5: Dynamically Adjust Text Position
import matplotlib.pyplot as plt
import numpy as np

fig, ax = plt.subplots()
ax.plot([1, 2, 3], [4, 5, 6])

text_positions = [(2, 5), (2.5, 5.5), (3, 6)]
for pos in text_positions:
    text = ax.text(*pos, 'Dynamic how2matplotlib.com', va='center', ha='center')
    renderer = fig.canvas.get_renderer()
    bbox = text.get_window_extent(renderer=renderer)
    if bbox.overlaps(ax.bbox):
        text.set_position((pos[0], pos[1] + 0.5))

plt.show()
Output:
Advanced Techniques
For more complex plots, more sophisticated methods may be required to position text boxes intelligently.
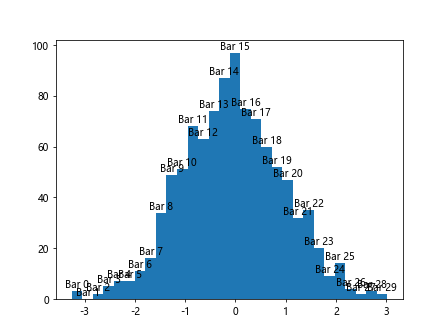
Example 6: Integrating with Plot Elements
import matplotlib.pyplot as plt
import numpy as np

data = np.random.randn(1000)
fig, ax = plt.subplots()
hist = ax.hist(data, bins=30)

for i, patch in enumerate(hist[2]):
    ax.text(patch.get_x() + patch.get_width() / 2, patch.get_height(), 'Bar {}'.format(i), ha='center', va='bottom')

plt.show()
Output:
Conclusion
Automatically positioning text boxes in Matplotlib requires understanding both the basic and advanced features of the library. By using the techniques outlined in this article, you can enhance the readability and aesthetics of your plots. Whether you are dealing with simple line plots or complex visualizations, these methods provide a foundation for effectively integrating text into your figures.
Remember, the key to effective visualization is not just presenting data, but making it accessible and understandable to your audience. With these tools at your disposal, you can ensure that your text annotations contribute positively to this goal.