Automated Legend Creation in Matplotlib
Creating legends in Matplotlib is an essential part of visualizing data in Python. Legends help to identify different groups of data by associating plot elements with labels. This article will explore various ways to automate the creation of legends in Matplotlib, providing detailed examples to illustrate different techniques and customization options.
Introduction to Matplotlib Legends
In Matplotlib, a legend is an area of the plot that describes each of the plotted data series. The legend associates a symbol or color in the plot with a description (label). Adding a legend to a plot involves using the legend() function, which automatically extracts labels from the plotted data.
Basic Legend
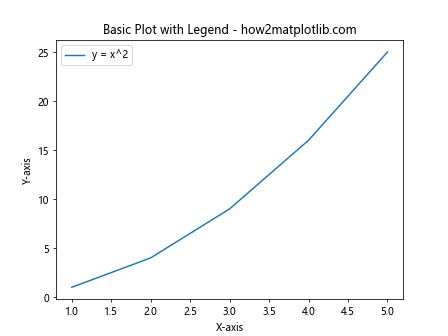
Here’s a simple example to start with:
import matplotlib.pyplot as plt

x = [1, 2, 3, 4, 5]
y = [1, 4, 9, 16, 25]

plt.plot(x, y, label='y = x^2')
plt.xlabel('X-axis')
plt.ylabel('Y-axis')
plt.title('Basic Plot with Legend - how2matplotlib.com')
plt.legend()
plt.show()
Output:
Customizing the Legend
Matplotlib allows for extensive customization of the legend. You can change the location, font size, frame, and more.
Changing the Location of the Legend
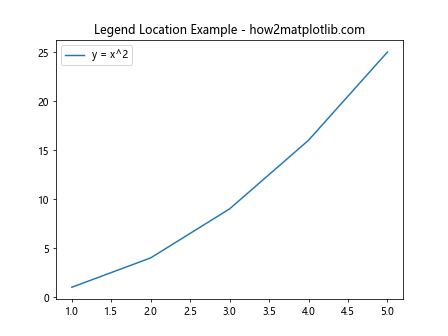
The location of the legend can be specified by using the loc parameter.
import matplotlib.pyplot as plt

x = [1, 2, 3, 4, 5]
y = [1, 4, 9, 16, 25]

plt.plot(x, y, label='y = x^2')
plt.legend(loc='upper left')
plt.title('Legend Location Example - how2matplotlib.com')
plt.show()
Output:
Setting the Number of Columns in a Legend
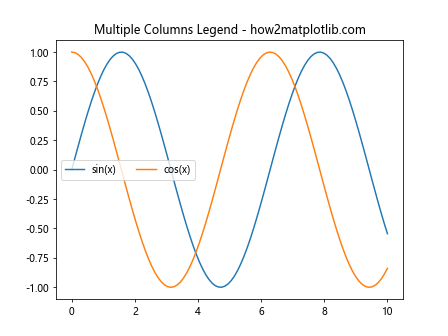
For plots with multiple labels, you might want to organize the legend into multiple columns:
import matplotlib.pyplot as plt
import numpy as np

x = np.linspace(0, 10, 100)
y1 = np.sin(x)
y2 = np.cos(x)

plt.plot(x, y1, label='sin(x)')
plt.plot(x, y2, label='cos(x)')
plt.legend(ncol=2)
plt.title('Multiple Columns Legend - how2matplotlib.com')
plt.show()
Output:
Customizing the Font Size of Legend Text
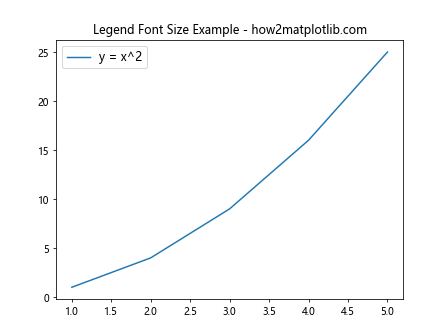
You can specify the font size of the text in the legend using the fontsize parameter.
import matplotlib.pyplot as plt
import numpy as np

x = [1, 2, 3, 4, 5]
y = [1, 4, 9, 16, 25]

plt.plot(x, y, label='y = x^2')
plt.legend(fontsize='large')
plt.title('Legend Font Size Example - how2matplotlib.com')
plt.show()
Output:
Using a Frame around the Legend
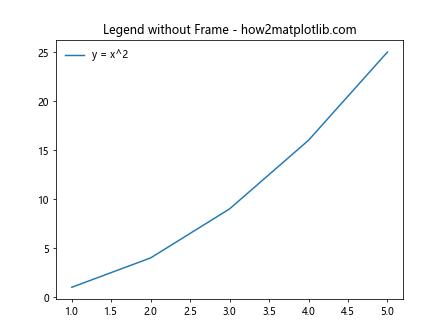
The frame around the legend can be toggled using the frameon parameter.
import matplotlib.pyplot as plt
import numpy as np

x = [1, 2, 3, 4, 5]
y = [1, 4, 9, 16, 25]

plt.plot(x, y, label='y = x^2')
plt.legend(frameon=False)
plt.title('Legend without Frame - how2matplotlib.com')
plt.show()
Output:
Advanced Legend Handling
Handling Overlapping Plots
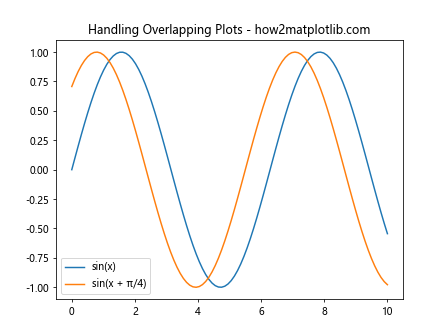
When dealing with multiple plots that overlap, it’s crucial to manage the legend carefully to ensure clarity.
import matplotlib.pyplot as plt
import numpy as np

x = np.linspace(0, 10, 100)
y1 = np.sin(x)
y2 = np.sin(x + np.pi / 4)

plt.plot(x, y1, label='sin(x)')
plt.plot(x, y2, label='sin(x + π/4)')
plt.legend()
plt.title('Handling Overlapping Plots - how2matplotlib.com')
plt.show()
Output:
Custom Legend Handlers
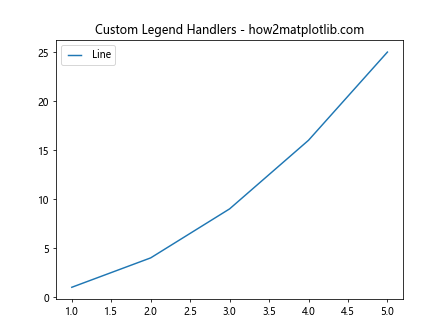
For more complex legends, custom handlers can be used to create unique legend entries.
import matplotlib.pyplot as plt
import numpy as np
from matplotlib.legend_handler import HandlerLine2D

x = [1, 2, 3, 4, 5]
y = [1, 4, 9, 16, 25]

line, = plt.plot(x, y, label='Line')
plt.legend(handler_map={line: HandlerLine2D(numpoints=4)})
plt.title('Custom Legend Handlers - how2matplotlib.com')
plt.show()
Output:
Interactive Legends
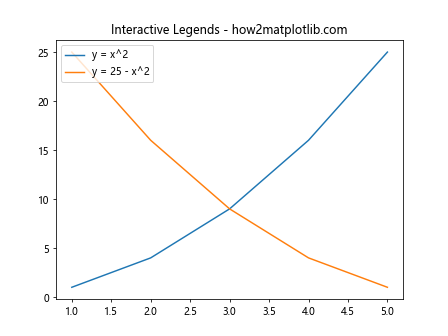
Interactive legends allow users to toggle the visibility of plots by clicking on legend items.
import matplotlib.pyplot as plt
import numpy as np
from matplotlib.legend_handler import HandlerLine2D

x = [1, 2, 3, 4, 5]
y = [1, 4, 9, 16, 25]
y2 = [25, 16, 9, 4, 1]

fig, ax = plt.subplots()
line1, = ax.plot(x, y, label='y = x^2')
line2, = ax.plot(x, y2, label='y = 25 - x^2')

legend = ax.legend(loc='upper left')
line1.set_picker(5)  # 5 pts tolerance
line2.set_picker(5)

def onpick(event):
    legline = event.artist
    origline = line1 if legline == legend.get_lines()[0] else line2
    vis = not origline.get_visible()
    origline.set_visible(vis)
    legline.set_alpha(1.0 if vis else 0.2)
    fig.canvas.draw()

fig.canvas.mpl_connect('pick_event', onpick)
plt.title('Interactive Legends - how2matplotlib.com')
plt.show()
Output:
Conclusion
In this article, we’ve explored various ways to automate and customize legends in Matplotlib. By understanding these techniques, you can enhance the readability and aesthetics of your plots. Whether you’re dealing with simple or complex datasets, Matplotlib provides the tools necessary to create effective visual representations of your data.