Adjusting the Spacing Between the Edge of the Plot and the X-Axis in Matplotlib
Matplotlib is a powerful plotting library in Python that is used extensively in data visualization. One of the common tasks when creating plots is adjusting the spacing between the edges of the plot and the axes. This article focuses on how to adjust the spacing between the edge of the plot and the X-axis using Matplotlib. We will explore various techniques and properties that can be manipulated to achieve the desired spacing, enhancing the readability and aesthetics of the plots.
Understanding the Basics of Matplotlib
Before diving into the specifics of adjusting spacing, it’s important to understand some basic concepts of Matplotlib. Matplotlib operates on a figure-and-axes plotting framework where the figure is the overall window or page that everything is drawn on, and the axes are individual plots within the figure.
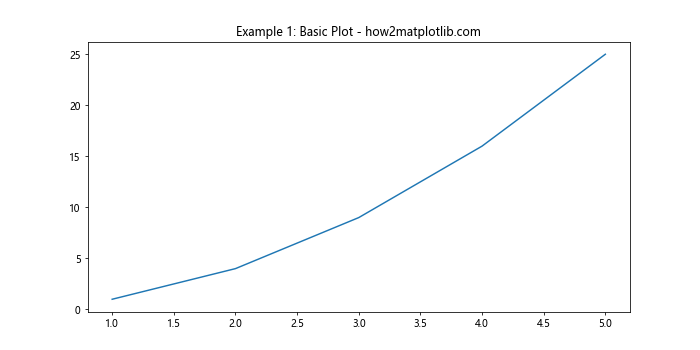
Example 1: Basic Plot
import matplotlib.pyplot as plt

plt.figure(figsize=(10, 5))
plt.plot([1, 2, 3, 4, 5], [1, 4, 9, 16, 25])
plt.title("Example 1: Basic Plot - how2matplotlib.com")
plt.show()
Output:
Adjusting Spacing Using Subplots Adjust
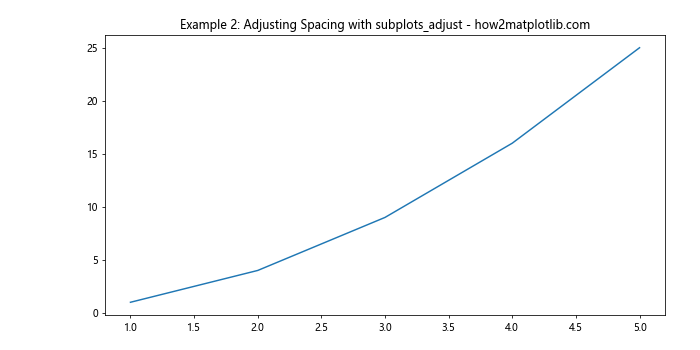
One of the simplest ways to adjust the spacing is by using the subplots_adjust method, which allows you to control the spacing around the axes.
Example 2: Adjusting Spacing with subplots_adjust
import matplotlib.pyplot as plt

plt.figure(figsize=(10, 5))
plt.plot([1, 2, 3, 4, 5], [1, 4, 9, 16, 25])
plt.subplots_adjust(left=0.15, right=0.95, bottom=0.1, top=0.9)
plt.title("Example 2: Adjusting Spacing with subplots_adjust - how2matplotlib.com")
plt.show()
Output:
Using tight_layout
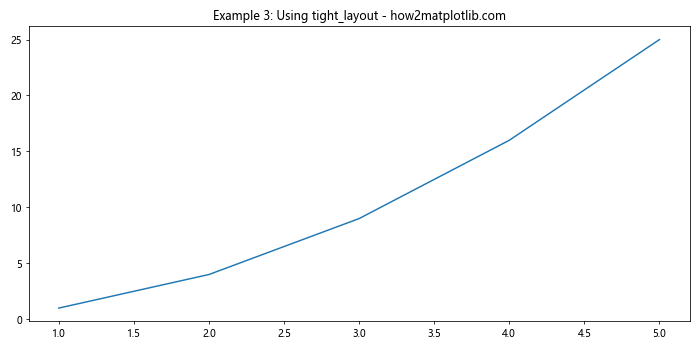
The tight_layout method automatically adjusts the subplot parameters to give specified padding and prevent things like the titles, tick labels, and axes labels from overlapping.
Example 3: Using tight_layout
import matplotlib.pyplot as plt

plt.figure(figsize=(10, 5))
plt.plot([1, 2, 3, 4, 5], [1, 4, 9, 16, 25])
plt.title("Example 3: Using tight_layout - how2matplotlib.com")
plt.tight_layout()
plt.show()
Output:
Manipulating Axis Properties Directly
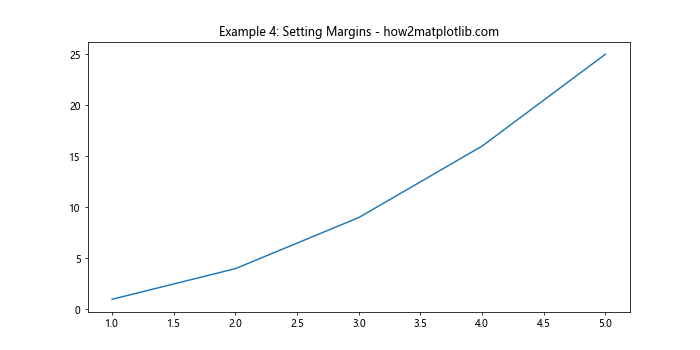
For more control, you can manipulate the axis properties directly using the Axes object.
Example 4: Setting Margins
import matplotlib.pyplot as plt

fig, ax = plt.subplots(figsize=(10, 5))
ax.plot([1, 2, 3, 4, 5], [1, 4, 9, 16, 25])
ax.margins(x=0.05)
ax.set_title("Example 4: Setting Margins - how2matplotlib.com")
plt.show()
Output:
Using set_position
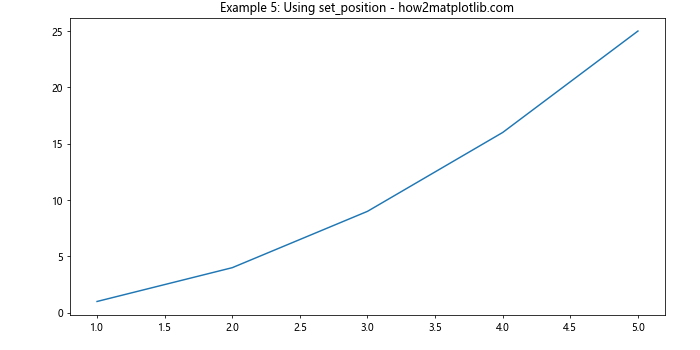
The set_position method of the Axes object can be used to manually set the position of the axes within the figure.
Example 5: Using set_position
import matplotlib.pyplot as plt

fig, ax = plt.subplots(figsize=(10, 5))
ax.plot([1, 2, 3, 4, 5], [1, 4, 9, 16, 25])
ax.set_position([0.1, 0.1, 0.85, 0.85])  # [left, bottom, width, height]
ax.set_title("Example 5: Using set_position - how2matplotlib.com")
plt.show()
Output:
Conclusion
Adjusting the spacing between the edge of the plot and the X-axis is crucial for creating visually appealing and readable plots. Matplotlib provides several tools and methods to customize this spacing, including subplots_adjust, tight_layout, direct manipulation of axis properties, and set_position. By understanding and utilizing these tools, you can significantly enhance the presentation of your data visualizations.
In this article, we have covered several techniques and provided examples that demonstrate how to adjust the spacing in Matplotlib. Each method offers different levels of control and can be chosen based on the specific requirements of your visualization task.