Adjusting the Heights of Individual Subplots in Matplotlib in Python
Matplotlib is a comprehensive library for creating static, interactive, and animated visualizations in Python. One of the common tasks when working with Matplotlib is adjusting the layout of subplots. Specifically, adjusting the heights of individual subplots can be crucial for creating visually appealing and informative plots. This article will guide you through various methods to adjust the heights of individual subplots using Matplotlib, complete with detailed examples.
Introduction to Subplots in Matplotlib
Subplots are individual plots that live within a larger figure. They are useful when you want to compare multiple visualizations side by side. Matplotlib provides several ways to create and manipulate subplots, including functions like subplot(), subplots(), and subplot2grid().
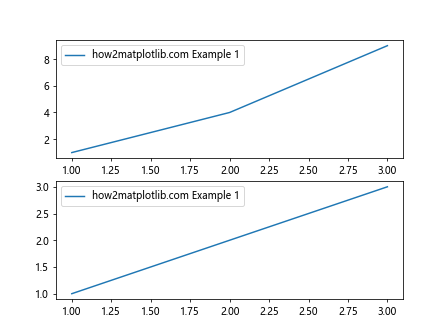
Example 1: Basic Subplot Creation
import matplotlib.pyplot as plt

# Create a figure and a set of subplots
fig, axs = plt.subplots(2, 1)
axs[0].plot([1, 2, 3], [1, 4, 9], label="how2matplotlib.com Example 1")
axs[1].plot([1, 2, 3], [1, 2, 3], label="how2matplotlib.com Example 1")

axs[0].legend()
axs[1].legend()

plt.show()
Output:
Adjusting Heights Using subplots_adjust
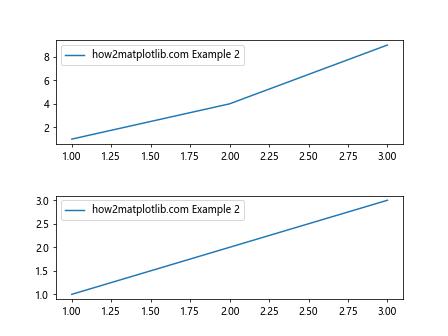
The subplots_adjust method of the figure object is a straightforward way to adjust the spacing between subplots. You can specify the top, bottom, left, right, and the spacings between subplots.
Example 2: Adjusting Subplot Heights with subplots_adjust
import matplotlib.pyplot as plt

fig, axs = plt.subplots(2, 1)
axs[0].plot([1, 2, 3], [1, 4, 9], label="how2matplotlib.com Example 2")
axs[1].plot([1, 2, 3], [1, 2, 3], label="how2matplotlib.com Example 2")

fig.subplots_adjust(hspace=0.5)  # Adjust the height spacing

axs[0].legend()
axs[1].legend()

plt.show()
Output:
Using GridSpec for Flexible Subplot Management
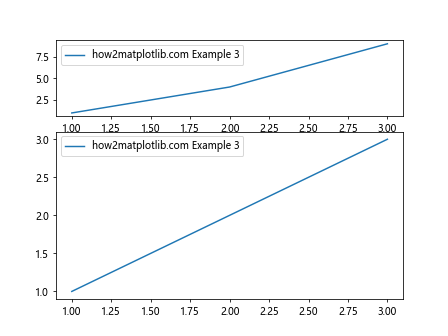
GridSpec is a more powerful tool for arranging subplots. You can specify the number of rows and columns in the grid, and then place subplots in different positions and sizes within the grid.
Example 3: Creating Subplots with GridSpec
import matplotlib.pyplot as plt
from matplotlib.gridspec import GridSpec

fig = plt.figure()
gs = GridSpec(3, 1, figure=fig)

ax1 = fig.add_subplot(gs[0, 0])
ax2 = fig.add_subplot(gs[1:, 0])

ax1.plot([1, 2, 3], [1, 4, 9], label="how2matplotlib.com Example 3")
ax2.plot([1, 2, 3], [1, 2, 3], label="how2matplotlib.com Example 3")

ax1.legend()
ax2.legend()

plt.show()
Output:
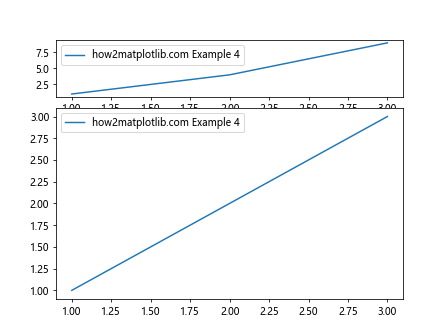
Example 4: Adjusting Heights with GridSpec
import matplotlib.pyplot as plt
from matplotlib.gridspec import GridSpec

fig = plt.figure()
gs = GridSpec(4, 1, figure=fig)

ax1 = fig.add_subplot(gs[0:1, 0])
ax2 = fig.add_subplot(gs[1:4, 0])

ax1.plot([1, 2, 3], [1, 4, 9], label="how2matplotlib.com Example 4")
ax2.plot([1, 2, 3], [1, 2, 3], label="how2matplotlib.com Example 4")

ax1.legend()
ax2.legend()

plt.show()
Output:
Using subplot2grid for Positional Control
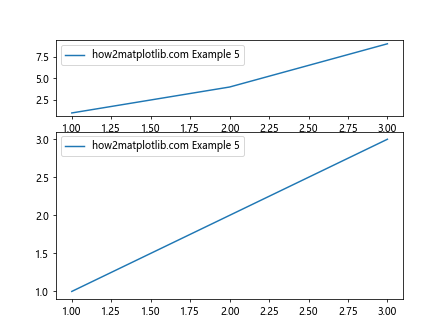
subplot2grid is another method that provides a way to create subplots in a grid and control their position and size.
Example 5: Creating Subplots with subplot2grid
import matplotlib.pyplot as plt
from matplotlib.gridspec import GridSpec

ax1 = plt.subplot2grid((3, 1), (0, 0))
ax2 = plt.subplot2grid((3, 1), (1, 0), rowspan=2)

ax1.plot([1, 2, 3], [1, 4, 9], label="how2matplotlib.com Example 5")
ax2.plot([1, 2, 3], [1, 2, 3], label="how2matplotlib.com Example 5")

ax1.legend()
ax2.legend()

plt.show()
Output:
Conclusion
Adjusting the heights of individual subplots in Matplotlib allows for customized plot layouts that can enhance the presentation of data. Whether you use subplots_adjust, GridSpec, or subplot2grid, Matplotlib provides the flexibility to tailor subplot arrangements to your specific needs. By mastering these techniques, you can create more effective and visually appealing plots.