Adding Value Labels on a Matplotlib Bar Chart
Creating visualizations with Matplotlib is a fundamental skill for data scientists and analysts. One common task is enhancing bar charts by adding value labels directly on the bars. This not only makes the charts more informative but also improves the readability, especially when presenting data to an audience not familiar with reading graphs. In this article, we will explore various ways to add value labels to bar charts using Matplotlib, a popular plotting library in Python.
Introduction to Matplotlib
Matplotlib is a comprehensive library for creating static, animated, and interactive visualizations in Python. It provides an object-oriented API for embedding plots into applications using general-purpose GUI toolkits like Tkinter, wxPython, Qt, or GTK. For simple tasks, Matplotlib also offers a scripting interface that is reminiscent of MATLAB.
Basic Bar Chart
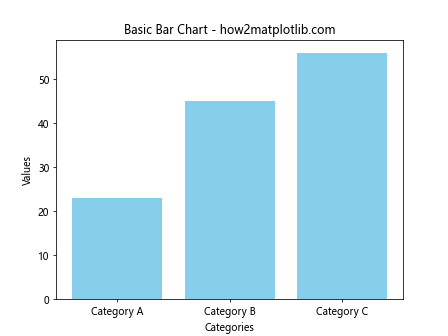
Before we dive into adding labels, let’s start with how to create a basic bar chart. Here’s an example:
import matplotlib.pyplot as plt

# Data
categories = ['Category A', 'Category B', 'Category C']
values = [23, 45, 56]

fig, ax = plt.subplots()
ax.bar(categories, values, color='skyblue')
ax.set_title('Basic Bar Chart - how2matplotlib.com')
ax.set_xlabel('Categories')
ax.set_ylabel('Values')

plt.show()
Output:
Adding Value Labels to Bars
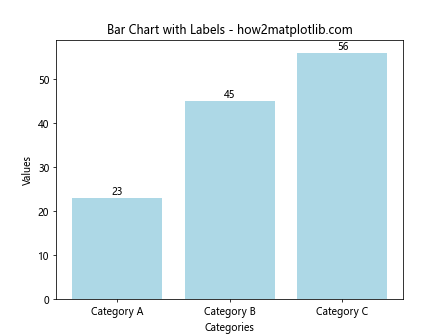
To add text labels above the bars in a bar chart, you can use the text method of the Axes object. Here is a simple example:
import matplotlib.pyplot as plt

# Data
categories = ['Category A', 'Category B', 'Category C']
values = [23, 45, 56]

fig, ax = plt.subplots()
bars = ax.bar(categories, values, color='lightblue')

# Adding value labels
for bar in bars:
    yval = bar.get_height()
    ax.text(bar.get_x() + bar.get_width()/2, yval, int(yval), ha='center', va='bottom')

ax.set_title('Bar Chart with Labels - how2matplotlib.com')
ax.set_xlabel('Categories')
ax.set_ylabel('Values')

plt.show()
Output:
Formatting Value Labels
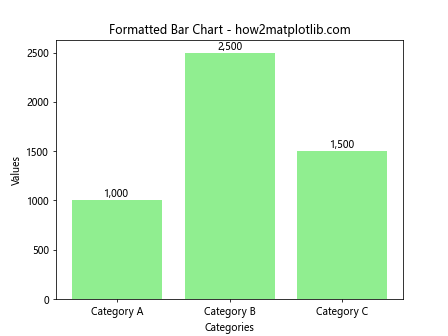
You can format the labels to make them more readable or to add additional information. Here’s how you can format the labels with a thousand separator:
import matplotlib.pyplot as plt
import locale

# Set locale to use commas as thousand separators
locale.setlocale(locale.LC_ALL, 'en_US')

# Data
categories = ['Category A', 'Category B', 'Category C']
values = [1000, 2500, 1500]

fig, ax = plt.subplots()
bars = ax.bar(categories, values, color='lightgreen')

# Adding formatted value labels
for bar in bars:
    yval = bar.get_height()
    ax.text(bar.get_x() + bar.get_width()/2, yval, f'{yval:n}', ha='center', va='bottom')

ax.set_title('Formatted Bar Chart - how2matplotlib.com')
ax.set_xlabel('Categories')
ax.set_ylabel('Values')

plt.show()
Output:
Rotating Value Labels
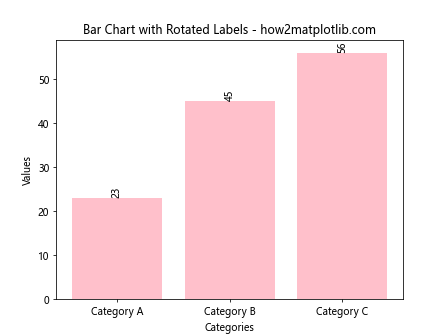
If the values are too large or if you prefer a different aesthetic, you might want to rotate the labels. Here’s how to rotate value labels:
import matplotlib.pyplot as plt

# Data
categories = ['Category A', 'Category B', 'Category C']
values = [23, 45, 56]

fig, ax = plt.subplots()
bars = ax.bar(categories, values, color='pink')

# Adding rotated value labels
for bar in bars:
    yval = bar.get_height()
    ax.text(bar.get_x() + bar.get_width()/2, yval, int(yval), ha='center', va='bottom', rotation=90)

ax.set_title('Bar Chart with Rotated Labels - how2matplotlib.com')
ax.set_xlabel('Categories')
ax.set_ylabel('Values')

plt.show()
Output:
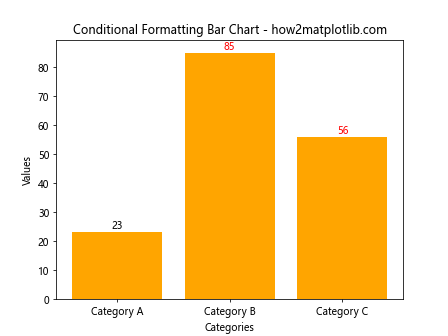
Conditional Formatting of Labels
Sometimes, you might want to format the labels differently based on certain conditions. For example, you might want to highlight values above a certain threshold:
import matplotlib.pyplot as plt

# Data
categories = ['Category A', 'Category B', 'Category C']
values = [23, 85, 56]

fig, ax = plt.subplots()
bars = ax.bar(categories, values, color='orange')

# Adding conditional formatted value labels
threshold = 50
for bar in bars:
    yval = bar.get_height()
    color = 'red' if yval > threshold else 'black'
    ax.text(bar.get_x() + bar.get_width()/2, yval, int(yval), ha='center', va='bottom', color=color)

ax.set_title('Conditional Formatting Bar Chart - how2matplotlib.com')
ax.set_xlabel('Categories')
ax.set_ylabel('Values')

plt.show()
Output:
Conclusion
Adding value labels to a bar chart can significantly enhance its effectiveness in conveying data insights. By using Matplotlib’s text method, you can easily place labels directly on or above the bars, customize their appearance, and even apply conditional formatting. This guide has shown you several ways to add and customize value labels on bar charts using Matplotlib. Whether you’re preparing a presentation, a report, or just exploring data, these techniques will help you create more informative and visually appealing charts.