Adding Textures to Graphs Using Matplotlib
Matplotlib is a powerful plotting library in Python that allows for extensive customization of graphs, including the addition of textures. Textures can enhance the visual appeal of graphs and make them more informative, especially when dealing with complex data visualizations. This article will guide you through the process of adding textures to graphs using Matplotlib, providing detailed examples and complete, standalone code snippets.
Introduction to Textures in Matplotlib
Textures in Matplotlib are typically applied to bars, patches, and other graph elements to differentiate them visually. This can be particularly useful in printed materials or presentations where color differences alone may not be sufficient. Textures are applied using patterns of lines, dots, or other shapes, which can be customized in terms of orientation, frequency, and color.
Setting Up Your Environment
Before we dive into the examples, ensure you have the necessary tools installed. You’ll need Python and Matplotlib. You can install Matplotlib using pip if you haven’t already:
pip install matplotlib
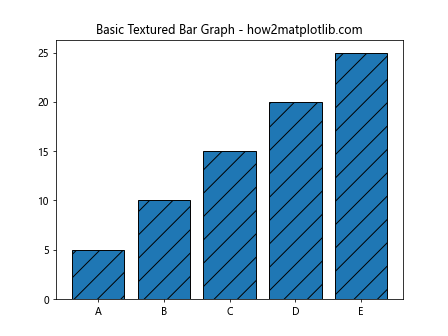
Example 1: Basic Textured Bar Graph
Let’s start with a simple example of a bar graph with a horizontal line texture.
import matplotlib.pyplot as plt
import numpy as np

data = [5, 10, 15, 20, 25]
labels = ['A', 'B', 'C', 'D', 'E']

fig, ax = plt.subplots()
bars = ax.bar(labels, data, edgecolor='black')
for bar in bars:
    bar.set_hatch('/')
ax.set_title("Basic Textured Bar Graph - how2matplotlib.com")
plt.show()
Output:
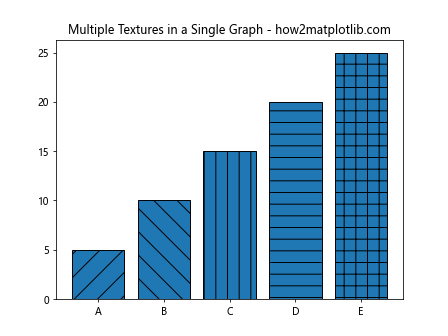
Example 2: Multiple Textures in a Single Graph
This example demonstrates how to use different textures for different bars in a bar graph.
import matplotlib.pyplot as plt
import numpy as np

data = [5, 10, 15, 20, 25]
labels = ['A', 'B', 'C', 'D', 'E']
textures = ['/', '\\', '|', '-', '+']

fig, ax = plt.subplots()
bars = ax.bar(labels, data, edgecolor='black')
for bar, hatch in zip(bars, textures):
    bar.set_hatch(hatch)
ax.set_title("Multiple Textures in a Single Graph - how2matplotlib.com")
plt.show()
Output:
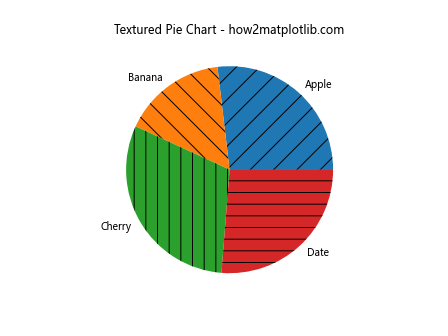
Example 3: Adding Textures to Pie Charts
Textures can also be added to pie charts to differentiate the slices.
import matplotlib.pyplot as plt

sizes = [215, 130, 245, 210]
labels = ['Apple', 'Banana', 'Cherry', 'Date']
textures = ['/', '\\', '|', '-']

fig, ax = plt.subplots()
wedges, texts = ax.pie(sizes, labels=labels)
for wedge, hatch in zip(wedges, textures):
    wedge.set_hatch(hatch)
ax.set_title("Textured Pie Chart - how2matplotlib.com")
plt.show()
Output:
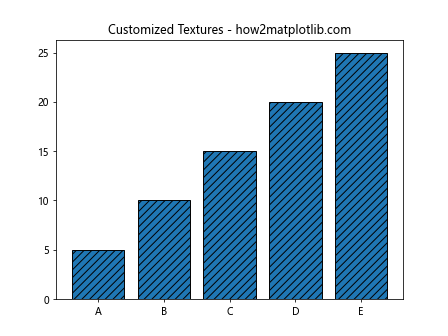
Example 4: Customizing Textures
You can customize the density and line properties of textures.
import matplotlib.pyplot as plt
import numpy as np

data = [5, 10, 15, 20, 25]
labels = ['A', 'B', 'C', 'D', 'E']
fig, ax = plt.subplots()
bars = ax.bar(labels, data, edgecolor='black')
for bar in bars:
    bar.set_hatch('///')
ax.set_title("Customized Textures - how2matplotlib.com")
plt.show()
Output:
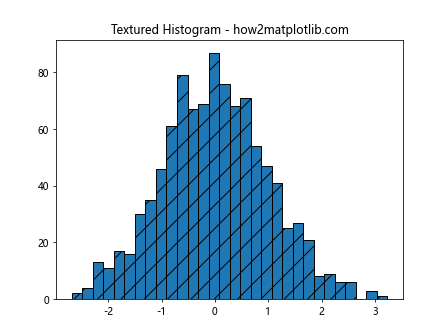
Example 5: Textured Histogram
Applying textures to histograms to show frequency distributions.
import matplotlib.pyplot as plt
import numpy as np

data = np.random.normal(0, 1, 1000)
fig, ax = plt.subplots()
n, bins, patches = ax.hist(data, bins=30, edgecolor='black')
for patch in patches:
    patch.set_hatch('/')
ax.set_title("Textured Histogram - how2matplotlib.com")
plt.show()
Output:
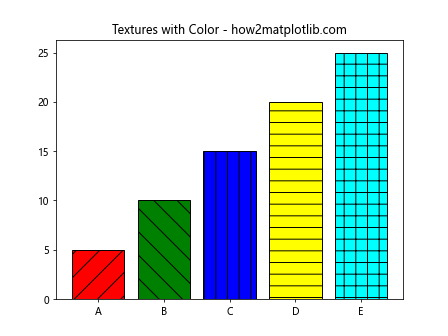
Example 6: Textures with Color
Textures can be combined with colors to make the graph more visually appealing.
import matplotlib.pyplot as plt
import numpy as np

data = [5, 10, 15, 20, 25]
labels = ['A', 'B', 'C', 'D', 'E']
colors = ['red', 'green', 'blue', 'yellow', 'cyan']
textures = ['/', '\\', '|', '-', '+']

fig, ax = plt.subplots()
bars = ax.bar(labels, data, color=colors, edgecolor='black')
for bar, hatch in zip(bars, textures):
    bar.set_hatch(hatch)
ax.set_title("Textures with Color - how2matplotlib.com")
plt.show()
Output:
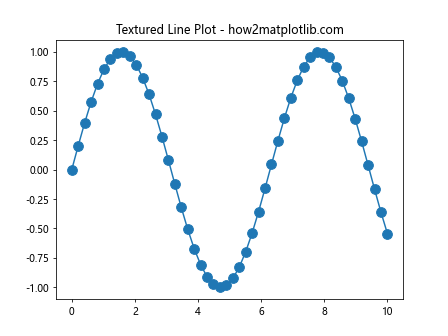
Example 7: Textured Line Plots
While less common, textures can also be applied to line plots by using markers.
import matplotlib.pyplot as plt
import numpy as np

x = np.linspace(0, 10, 50)
y = np.sin(x)
fig, ax = plt.subplots()
ax.plot(x, y, marker='o', linestyle='-', markersize=10)
ax.set_title("Textured Line Plot - how2matplotlib.com")
plt.show()
Output:
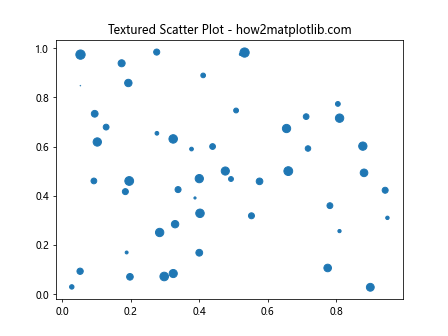
Example 8: Textured Scatter Plots
Scatter plots can also utilize textures by customizing marker styles.
import matplotlib.pyplot as plt
import numpy as np

x = np.random.rand(50)
y = np.random.rand(50)
sizes = np.random.rand(50) * 100
fig, ax = plt.subplots()
scatter = ax.scatter(x, y, s=sizes, marker='o')
ax.set_title("Textured Scatter Plot - how2matplotlib.com")
plt.show()
Output:
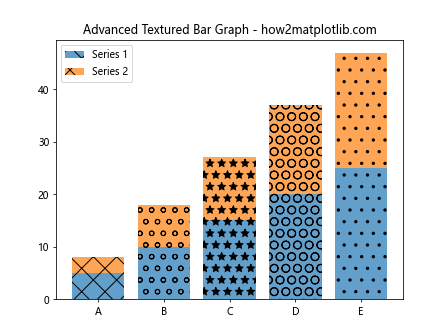
Example 9: Advanced Textured Bar Graph
This example shows a more complex scenario with multiple groups and textures.
import matplotlib.pyplot as plt
import numpy as np

data1 = [5, 10, 15, 20, 25]
data2 = [3, 8, 12, 17, 22]
labels = ['A', 'B', 'C', 'D', 'E']
textures = ['x', 'o', '*', 'O', '.']

fig, ax = plt.subplots()
bars1 = ax.bar(np.arange(len(data1)), data1, alpha=0.7, label='Series 1')
bars2 = ax.bar(np.arange(len(data2)), data2, alpha=0.7, label='Series 2', bottom=data1)
for bars in [bars1, bars2]:
    for bar, hatch in zip(bars, textures):
        bar.set_hatch(hatch)
ax.set_xticks(np.arange(len(labels)))
ax.set_xticklabels(labels)
ax.legend()
ax.set_title("Advanced Textured Bar Graph - how2matplotlib.com")
plt.show()
Output:
Example 10: Textured Area Plot
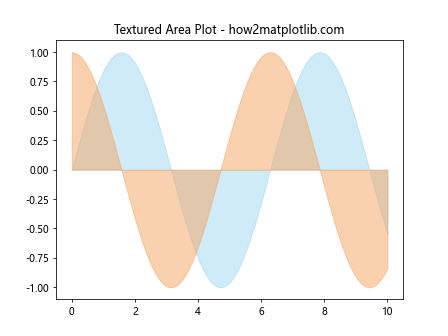
Area plots or filled plots can also have textures applied to them.
import matplotlib.pyplot as plt
import numpy as np

x = np.linspace(0, 10, 100)
y1 = np.sin(x)
y2 = np.cos(x)
fig, ax = plt.subplots()
ax.fill_between(x, y1, color="skyblue", alpha=0.4)
ax.fill_between(x, y2, color="sandybrown", alpha=0.5)
ax.set_title("Textured Area Plot - how2matplotlib.com")
plt.show()
Output:
Conclusion
Adding textures to your graphs in Matplotlib can significantly enhance their visual quality and effectiveness in conveying information. This article has provided a comprehensive guide and multiple examples to help you start using textures in your Matplotlib visualizations. Whether you are creating bar graphs, pie charts, histograms, or any other type of plot, textures can provide an additional layer of meaning and aesthetic appeal.