Add Minor Gridlines to Matplotlib Plot Using Seaborn
In this article, we will explore how to enhance the visual appeal and readability of plots in Matplotlib by adding minor gridlines, with an emphasis on integrating Seaborn for styling. Matplotlib is a powerful plotting library in Python that provides a wide range of plotting functions. Seaborn, built on top of Matplotlib, adds further aesthetic enhancements and simplifies certain data visualization tasks. Adding minor gridlines to your plots can make them more detailed and easier to analyze by providing more reference points for the data displayed.
Introduction to Matplotlib and Seaborn
Matplotlib is a comprehensive library for creating static, animated, and interactive visualizations in Python. Seaborn is a statistical data visualization library that simplifies the creation of many common visualization types. When combined, they offer powerful tools for data exploration and presentation.
Setting Up Your Environment
Before diving into the examples, ensure you have the necessary libraries installed. You can install Matplotlib and Seaborn using pip:
pip install matplotlib seaborn
Basic Plot with Minor Gridlines
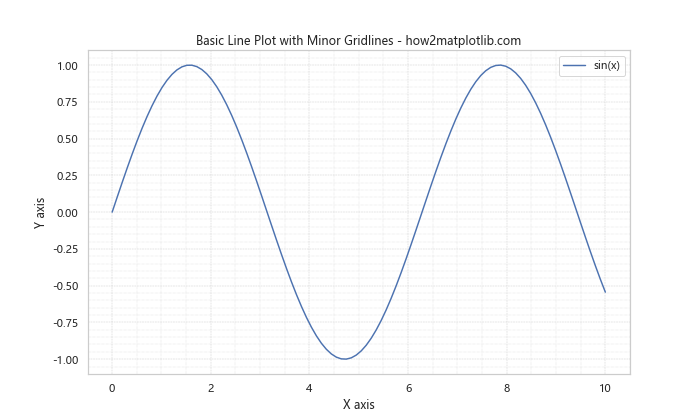
Let’s start with a basic example of a plot with minor gridlines. We will plot a simple line graph and add minor gridlines to it.
Example 1: Basic Line Plot with Minor Gridlines
import matplotlib.pyplot as plt
import seaborn as sns
import numpy as np

# Set the aesthetic style of the plots
sns.set(style="whitegrid")

# Generate some data
x = np.linspace(0, 10, 100)
y = np.sin(x)

# Create the plot
plt.figure(figsize=(10, 6))
plt.plot(x, y, label='sin(x)')
plt.title('Basic Line Plot with Minor Gridlines - how2matplotlib.com')
plt.xlabel('X axis')
plt.ylabel('Y axis')

# Enable both major and minor gridlines
plt.grid(True, which='both', linestyle='--', linewidth=0.5)

# Customize the minor gridlines
plt.minorticks_on()
plt.grid(which='minor', linestyle=':', linewidth='0.5')

plt.legend()
plt.show()
Output:
Enhancing Plots with Minor Gridlines
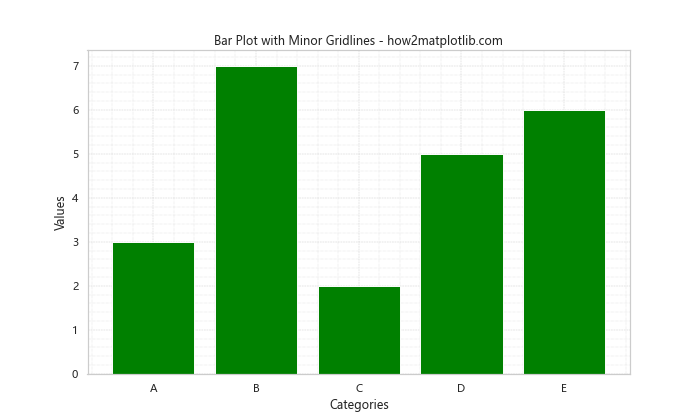
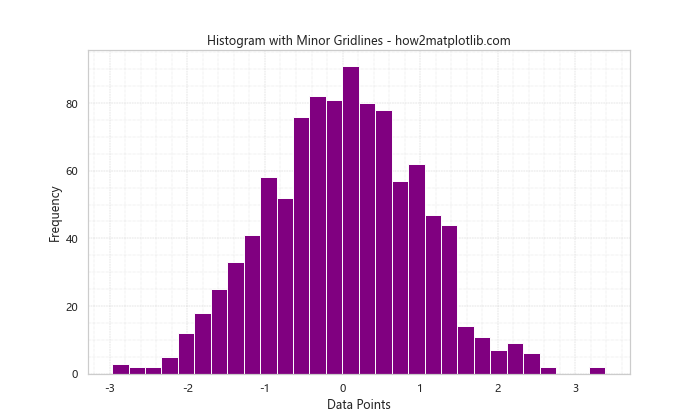
Adding minor gridlines to different types of plots can help in better data visualization. We will look at various plots such as scatter plots, bar plots, and histograms.
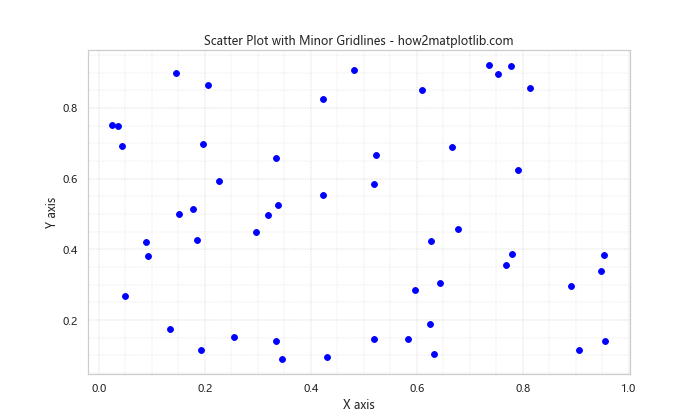
Example 2: Scatter Plot with Minor Gridlines
import matplotlib.pyplot as plt
import seaborn as sns
import numpy as np

# Set the aesthetic style of the plots
sns.set(style="whitegrid")

# Generate some data
x = np.random.rand(50)
y = np.random.rand(50)

# Create the plot
plt.figure(figsize=(10, 6))
plt.scatter(x, y, color='blue')
plt.title('Scatter Plot with Minor Gridlines - how2matplotlib.com')
plt.xlabel('X axis')
plt.ylabel('Y axis')

# Enable both major and minor gridlines
plt.grid(True, which='both', linestyle='--', linewidth=0.5)

# Customize the minor gridlines
plt.minorticks_on()
plt.grid(which='minor', linestyle=':', linewidth='0.5')

plt.show()
Output:
Example 3: Bar Plot with Minor Gridlines
import matplotlib.pyplot as plt
import seaborn as sns
import numpy as np

# Set the aesthetic style of the plots
sns.set(style="whitegrid")

# Generate some data
categories = ['A', 'B', 'C', 'D', 'E']
values = [3, 7, 2, 5, 6]

# Create the plot
plt.figure(figsize=(10, 6))
plt.bar(categories, values, color='green')
plt.title('Bar Plot with Minor Gridlines - how2matplotlib.com')
plt.xlabel('Categories')
plt.ylabel('Values')

# Enable both major and minor gridlines
plt.grid(True, which='both', linestyle='--', linewidth=0.5)

# Customize the minor gridlines
plt.minorticks_on()
plt.grid(which='minor', linestyle=':', linewidth='0.5')

plt.show()
Output:
Example 4: Histogram with Minor Gridlines
import matplotlib.pyplot as plt
import seaborn as sns
import numpy as np

# Set the aesthetic style of the plots
sns.set(style="whitegrid")

# Generate some data
data = np.random.randn(1000)

# Create the plot
plt.figure(figsize=(10, 6))
plt.hist(data, bins=30, color='purple')
plt.title('Histogram with Minor Gridlines - how2matplotlib.com')
plt.xlabel('Data Points')
plt.ylabel('Frequency')

# Enable both major and minor gridlines
plt.grid(True, which='both', linestyle='--', linewidth=0.5)

# Customize the minor gridlines
plt.minorticks_on()
plt.grid(which='minor', linestyle=':', linewidth='0.5')

plt.show()
Output:
Advanced Plot Customizations
Beyond basic plots, Matplotlib and Seaborn allow for advanced customizations. Let’s explore how to apply minor gridlines to more complex visualizations such as heatmaps, pair plots, and time series data.
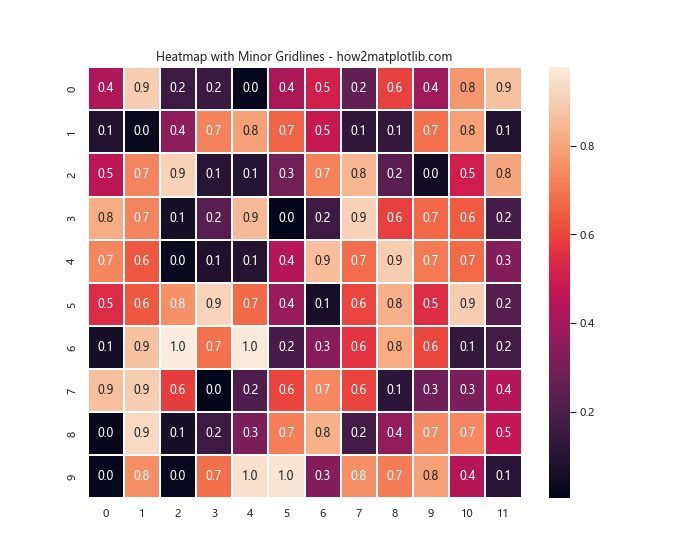
Example 5: Heatmap with Minor Gridlines
import matplotlib.pyplot as plt
import seaborn as sns
import numpy as np

# Generate some data
data = np.random.rand(10, 12)

# Set the aesthetic style of the plots
sns.set(style="whitegrid")

# Create the heatmap
plt.figure(figsize=(10, 8))
sns.heatmap(data, annot=True, fmt=".1f", linewidths=.5)
plt.title('Heatmap with Minor Gridlines - how2matplotlib.com')

# Unfortunately, minor gridlines don't apply well to heatmaps directly through Matplotlib,
# as the concept of minor gridlines is not applicable in the context of a heatmap's typical usage.
plt.show()
Output:
Example 6: Pair Plot with Minor Gridlines
import seaborn as sns
import matplotlib.pyplot as plt

# Load the example iris dataset
iris = sns.load_dataset("iris")

# Set the aesthetic style of the plots
sns.set(style="whitegrid")

# Create a pair plot
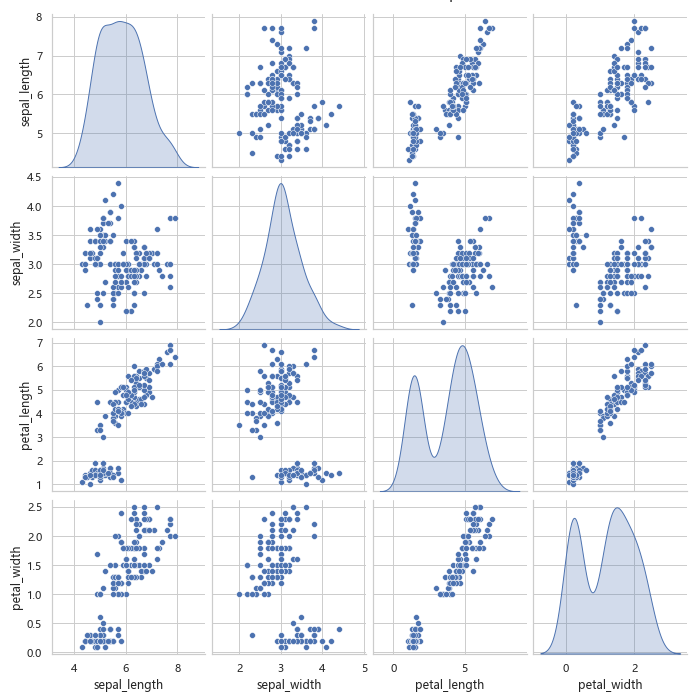
g = sns.pairplot(iris, diag_kind="kde")

# Enhance with a title
g.fig.suptitle('Pair Plot with Minor Gridlines - how2matplotlib.com', y=1.02)

# Here, adding minor gridlines is not directly supported in pairplot through seaborn or matplotlib.
# However, setting the style to 'whitegrid' ensures that major gridlines are displayed.
plt.show()
Output:
Example 7: Time Series Plot with Minor Gridlines
import matplotlib.pyplot as plt
import seaborn as sns
import pandas as pd
import numpy as np

# Generate some time series data
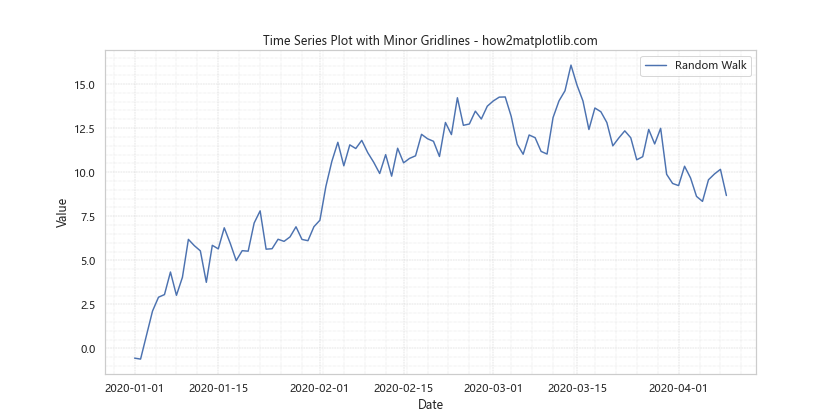
dates = pd.date_range(start='2020-01-01', periods=100)
data = np.random.randn(100).cumsum()

# Set the aesthetic style of the plots
sns.set(style="whitegrid")

# Create the plot
plt.figure(figsize=(12, 6))
plt.plot(dates, data, label='Random Walk')
plt.title('Time Series Plot with Minor Gridlines - how2matplotlib.com')
plt.xlabel('Date')
plt.ylabel('Value')

# Enable both major and minor gridlines
plt.grid(True, which='both', linestyle='--', linewidth=0.5)

# Customize the minor gridlines
plt.minorticks_on()
plt.grid(which='minor', linestyle=':', linewidth='0.5')

plt.legend()
plt.show()
Output:
Conclusion
In this article, we have explored various ways to add minor gridlines to your plots using Matplotlib and Seaborn. While minor gridlines are not applicable in all types of visualizations, they can significantly enhance the readability and precision of many common plot types. By integrating Seaborn’s styling capabilities with Matplotlib’s functional prowess, you can create visually appealing and detailed plots suitable for a variety of data analysis tasks.