How to Create and Customize Horizontal Colorbars in Matplotlib: A Comprehensive Guide
Matplotlib colorbar horizontal is a powerful feature that allows you to add color scales to your plots, providing a visual reference for the data represented by colors. In this comprehensive guide, we’ll explore various aspects of creating and customizing horizontal colorbars in Matplotlib, including their placement, formatting, and integration with different types of plots.
Introduction to Matplotlib Colorbar Horizontal
Matplotlib colorbar horizontal is an essential tool for data visualization, especially when dealing with plots that use color to represent data values. A horizontal colorbar provides a legend-like reference that helps viewers interpret the meaning of colors in your plot. By default, Matplotlib creates vertical colorbars, but horizontal colorbars can be particularly useful in certain layouts or when dealing with wide plots.
Let’s start with a basic example of how to create a horizontal colorbar in Matplotlib:
import matplotlib.pyplot as plt
import numpy as np

# Create sample data
data = np.random.rand(10, 10)

# Create a figure and axis
fig, ax = plt.subplots(figsize=(8, 6))

# Create a color plot
im = ax.imshow(data, cmap='viridis')

# Add a horizontal colorbar
cbar = plt.colorbar(im, orientation='horizontal', label='Values')

# Set title
plt.title('Matplotlib Colorbar Horizontal Example - how2matplotlib.com')

plt.show()
Output:
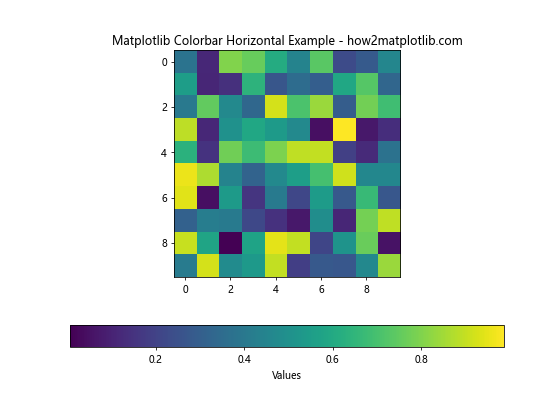
In this example, we create a simple heatmap using imshow() and add a horizontal colorbar to it. The orientation='horizontal' parameter in the colorbar() function is key to creating a horizontal colorbar.
Positioning the Matplotlib Colorbar Horizontal
The position of your matplotlib colorbar horizontal can significantly impact the overall layout and readability of your plot. Matplotlib offers several ways to control the position of your horizontal colorbar.
Using ax.add_axes()
One way to precisely position your matplotlib colorbar horizontal is by using ax.add_axes():
import matplotlib.pyplot as plt
import numpy as np

# Create sample data
data = np.random.rand(10, 10)

# Create a figure and axis
fig, ax = plt.subplots(figsize=(8, 6))

# Create a color plot
im = ax.imshow(data, cmap='plasma')

# Create a new axis for the colorbar
cax = fig.add_axes([0.15, 0.1, 0.7, 0.05])

# Add a horizontal colorbar to the new axis
cbar = fig.colorbar(im, cax=cax, orientation='horizontal', label='Values')

# Set title
plt.title('Matplotlib Colorbar Horizontal Positioning - how2matplotlib.com')

plt.show()
Output:
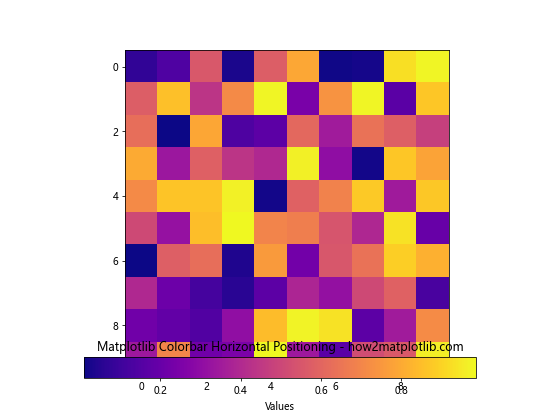
In this example, we use fig.add_axes([left, bottom, width, height]) to create a new axis for the colorbar. This allows precise control over the colorbar’s position and size.
Using make_axes_locatable
Another approach to positioning your matplotlib colorbar horizontal is using make_axes_locatable:
import matplotlib.pyplot as plt
import numpy as np
from mpl_toolkits.axes_grid1 import make_axes_locatable

# Create sample data
data = np.random.rand(10, 10)

# Create a figure and axis
fig, ax = plt.subplots(figsize=(8, 6))

# Create a color plot
im = ax.imshow(data, cmap='coolwarm')

# Create a divider for existing axes instance
divider = make_axes_locatable(ax)

# Append axes to the right of the main axes, 20% width
cax = divider.append_axes("bottom", size="5%", pad=0.1)

# Add a horizontal colorbar to the new axis
cbar = fig.colorbar(im, cax=cax, orientation='horizontal', label='Values')

# Set title
plt.title('Matplotlib Colorbar Horizontal with make_axes_locatable - how2matplotlib.com')

plt.show()
Output:
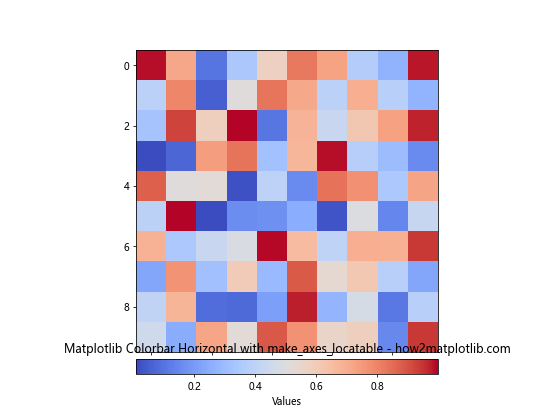
This method is particularly useful when you want to maintain a consistent size relationship between your main plot and the colorbar.
Customizing the Matplotlib Colorbar Horizontal
Customization is key to creating effective visualizations. Let’s explore various ways to customize your matplotlib colorbar horizontal.
Changing Colorbar Ticks and Labels
You can customize the ticks and labels of your matplotlib colorbar horizontal to better represent your data:
import matplotlib.pyplot as plt
import numpy as np

# Create sample data
data = np.random.rand(10, 10)

# Create a figure and axis
fig, ax = plt.subplots(figsize=(8, 6))

# Create a color plot
im = ax.imshow(data, cmap='viridis')

# Add a horizontal colorbar
cbar = plt.colorbar(im, orientation='horizontal', label='Custom Values')

# Set custom ticks
cbar.set_ticks([0, 0.25, 0.5, 0.75, 1])
cbar.set_ticklabels(['Low', 'Medium-Low', 'Medium', 'Medium-High', 'High'])

# Set title
plt.title('Matplotlib Colorbar Horizontal with Custom Ticks - how2matplotlib.com')

plt.show()
Output:
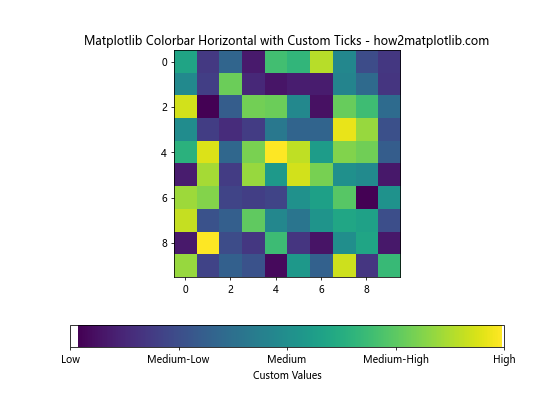
In this example, we use set_ticks() and set_ticklabels() to customize the colorbar ticks and labels.
Changing Colorbar Size
You can adjust the size of your matplotlib colorbar horizontal to fit your plot layout:
import matplotlib.pyplot as plt
import numpy as np

# Create sample data
data = np.random.rand(10, 10)

# Create a figure and axis
fig, ax = plt.subplots(figsize=(8, 6))

# Create a color plot
im = ax.imshow(data, cmap='YlOrRd')

# Add a horizontal colorbar with custom size
cbar = plt.colorbar(im, orientation='horizontal', label='Values', fraction=0.046, pad=0.04)

# Set title
plt.title('Matplotlib Colorbar Horizontal with Custom Size - how2matplotlib.com')

plt.show()
Output:
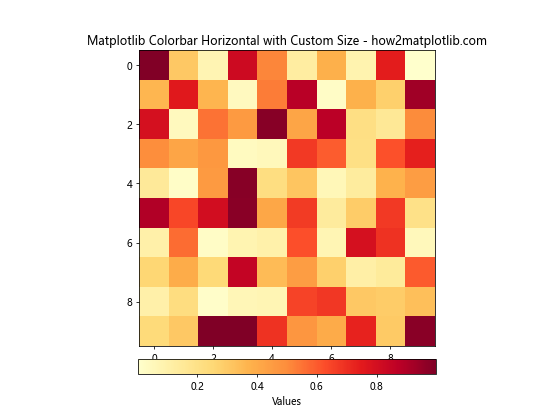
The fraction parameter controls the size of the colorbar relative to the main axes, while pad adjusts the space between the colorbar and the main axes.
Advanced Matplotlib Colorbar Horizontal Techniques
Let’s explore some more advanced techniques for working with matplotlib colorbar horizontal.
Multiple Colorbars
Sometimes, you may need to include multiple colorbars in a single plot:
import matplotlib.pyplot as plt
import numpy as np

# Create sample data
data1 = np.random.rand(10, 10)
data2 = np.random.rand(10, 10)

# Create a figure and axes
fig, (ax1, ax2) = plt.subplots(1, 2, figsize=(12, 5))

# Create color plots
im1 = ax1.imshow(data1, cmap='viridis')
im2 = ax2.imshow(data2, cmap='plasma')

# Add horizontal colorbars
cbar1 = fig.colorbar(im1, ax=ax1, orientation='horizontal', label='Values 1', pad=0.2)
cbar2 = fig.colorbar(im2, ax=ax2, orientation='horizontal', label='Values 2', pad=0.2)

# Set titles
ax1.set_title('Plot 1 - how2matplotlib.com')
ax2.set_title('Plot 2 - how2matplotlib.com')

plt.tight_layout()
plt.show()
Output:
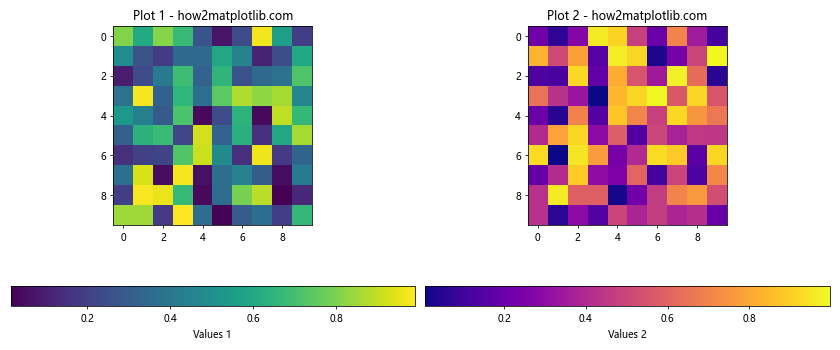
This example demonstrates how to add separate horizontal colorbars to multiple subplots.
Discrete Colorbar
For categorical data, you might want to create a discrete colorbar:
import matplotlib.pyplot as plt
import numpy as np

# Create sample data
data = np.random.randint(0, 5, (10, 10))

# Create a figure and axis
fig, ax = plt.subplots(figsize=(8, 6))

# Create a discrete colormap
cmap = plt.cm.get_cmap('Set3', 5)  # 5 discrete colors

# Create a color plot
im = ax.imshow(data, cmap=cmap)

# Add a horizontal colorbar
cbar = plt.colorbar(im, orientation='horizontal', label='Categories', ticks=np.arange(5) + 0.5)
cbar.set_ticklabels(['Cat A', 'Cat B', 'Cat C', 'Cat D', 'Cat E'])

# Set title
plt.title('Matplotlib Colorbar Horizontal with Discrete Colors - how2matplotlib.com')

plt.show()
Output:
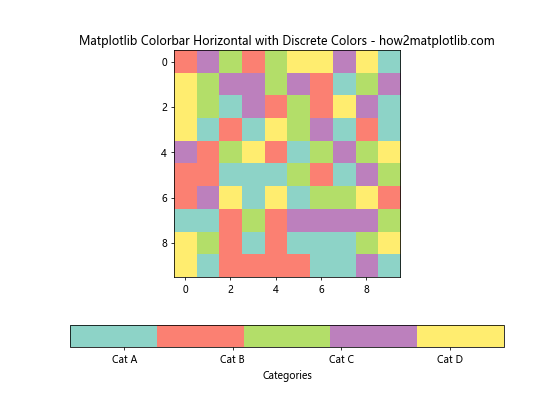
This example shows how to create a discrete colorbar with custom labels for categorical data.
Matplotlib Colorbar Horizontal in Different Plot Types
The matplotlib colorbar horizontal can be used with various types of plots. Let’s explore a few examples.
Contour Plot with Horizontal Colorbar
Contour plots often benefit from a horizontal colorbar:
import matplotlib.pyplot as plt
import numpy as np

# Create sample data
x = np.linspace(-3, 3, 100)
y = np.linspace(-3, 3, 100)
X, Y = np.meshgrid(x, y)
Z = np.sin(X) * np.cos(Y)

# Create a figure and axis
fig, ax = plt.subplots(figsize=(8, 6))

# Create a contour plot
cs = ax.contourf(X, Y, Z, cmap='RdYlBu')

# Add a horizontal colorbar
cbar = fig.colorbar(cs, orientation='horizontal', label='Values', pad=0.1)

# Set title
plt.title('Contour Plot with Matplotlib Colorbar Horizontal - how2matplotlib.com')

plt.show()
Output:
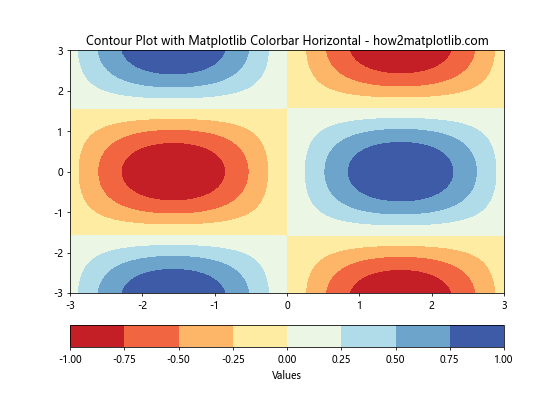
This example demonstrates how to add a horizontal colorbar to a contour plot.
3D Surface Plot with Horizontal Colorbar
3D surface plots can also benefit from a horizontal colorbar:
import matplotlib.pyplot as plt
import numpy as np
from mpl_toolkits.mplot3d import Axes3D

# Create sample data
x = np.linspace(-5, 5, 50)
y = np.linspace(-5, 5, 50)
X, Y = np.meshgrid(x, y)
Z = np.sin(np.sqrt(X**2 + Y**2))

# Create a figure and 3D axis
fig = plt.figure(figsize=(10, 8))
ax = fig.add_subplot(111, projection='3d')

# Create a surface plot
surf = ax.plot_surface(X, Y, Z, cmap='viridis')

# Add a horizontal colorbar
cbar = fig.colorbar(surf, orientation='horizontal', label='Values', pad=0.1, shrink=0.5, aspect=20)

# Set title
ax.set_title('3D Surface Plot with Matplotlib Colorbar Horizontal - how2matplotlib.com')

plt.show()
Output:
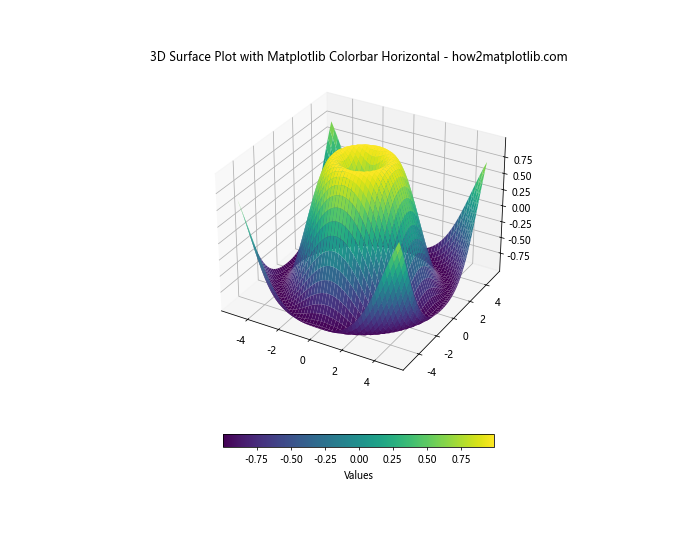
This example shows how to add a horizontal colorbar to a 3D surface plot.
Handling Colorbar Ranges and Normalization
Understanding how to handle colorbar ranges and normalization is crucial for creating effective visualizations with matplotlib colorbar horizontal.
Setting Colorbar Range
You can set a specific range for your colorbar:
import matplotlib.pyplot as plt
import numpy as np

# Create sample data
data = np.random.rand(10, 10) * 100

# Create a figure and axis
fig, ax = plt.subplots(figsize=(8, 6))

# Create a color plot with a specific range
im = ax.imshow(data, cmap='viridis', vmin=0, vmax=100)

# Add a horizontal colorbar
cbar = plt.colorbar(im, orientation='horizontal', label='Values')

# Set title
plt.title('Matplotlib Colorbar Horizontal with Specific Range - how2matplotlib.com')

plt.show()
Output:
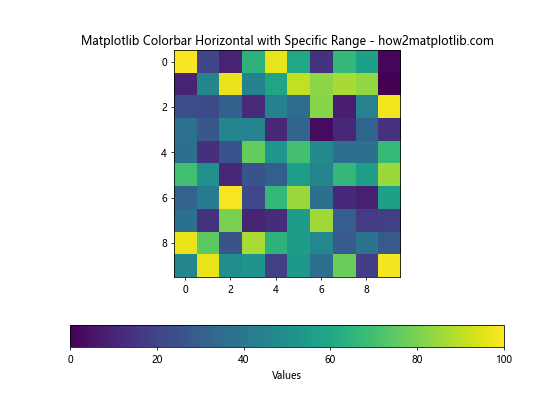
In this example, we use vmin and vmax to set the range of the colorbar.
Logarithmic Colorbar
For data with a large range of values, a logarithmic colorbar can be useful:
import matplotlib.pyplot as plt
import numpy as np
from matplotlib.colors import LogNorm

# Create sample data with a large range
data = np.random.rand(10, 10) * 1000000

# Create a figure and axis
fig, ax = plt.subplots(figsize=(8, 6))

# Create a color plot with logarithmic normalization
im = ax.imshow(data, cmap='viridis', norm=LogNorm(vmin=data.min(), vmax=data.max()))

# Add a horizontal colorbar
cbar = plt.colorbar(im, orientation='horizontal', label='Values (log scale)')

# Set title
plt.title('Matplotlib Colorbar Horizontal with Logarithmic Scale - how2matplotlib.com')

plt.show()
Output:
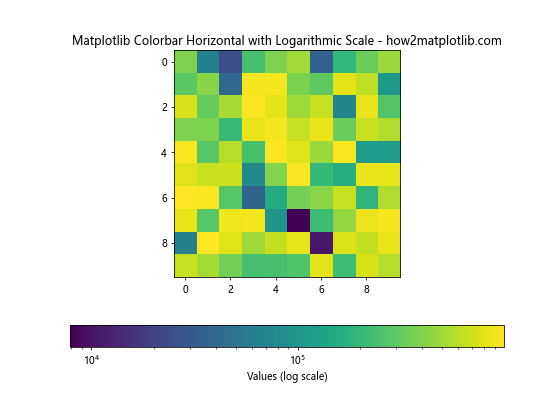
This example demonstrates how to create a logarithmic colorbar using LogNorm.
Matplotlib Colorbar Horizontal in Animations
Animated plots can also benefit from a matplotlib colorbar horizontal. Here’s an example of how to create an animated plot with a horizontal colorbar:
import matplotlib.pyplot as plt
import numpy as np
from matplotlib.animation import FuncAnimation

# Create a figure and axis
fig, ax = plt.subplots(figsize=(8, 6))

# Initialize an empty plot
im = ax.imshow(np.zeros((10, 10)), cmap='viridis', animated=True)

# Add a horizontal colorbar
cbar = fig.colorbar(im, orientation='horizontal', label='Values')

# Update function for the animation
def update(frame):
    data = np.random.rand(10, 10) * frame
    im.set_array(data)
    im.set_clim(0, 50)  # Set color limits
    return [im]

# Create the animation
anim = FuncAnimation(fig, update, frames=np.linspace(1, 50, 100), interval=100, blit=True)

# Set title
plt.title('Animated Plot with Matplotlib Colorbar Horizontal - how2matplotlib.com')

plt.show()
Output:
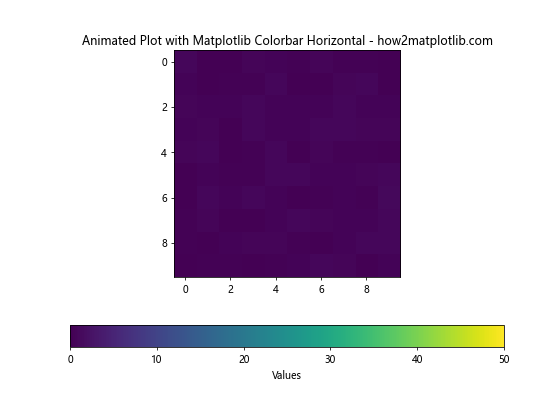
This example creates an animated heatmap with a horizontal colorbar that updates with each frame.
Best Practices for Using Matplotlib Colorbar Horizontal
When working with matplotlib colorbar horizontal, keep these best practices in mind:
- Choose appropriate colormaps: Use perceptually uniform colormaps like ‘viridis’ for continuous data.
- Consider colorblind-friendly options: Use colormaps that are distinguishable by colorblind individuals.
- Adjust colorbar size: Ensure the colorbar is large enough to be readable but doesn’t overpower the main plot.
- Use clear labels: Always label your colorbar to indicate what the colors represent.
- Match colorbar ticks to data: Ensure your colorbar ticks and labels accurately represent your data range.
Here’s an example incorporating these best practices:
import matplotlib.pyplot as plt
import numpy as np

# Create sample data
data = np.random.rand(20, 20)

# Create a figure and axis
fig, ax = plt.subplots(figsize=(10, 8))

# Create a color plot
im = ax.imshow(data, cmap='viridis')

# Add a horizontal colorbar
cbar = fig.colorbar(im, orientation='horizontal', label='Values', pad=0.1, aspect=30)

# Customize colorbar ticks
cbar.set_ticks([0, 0.25, 0.5, 0.75, 1])
cbar.set_ticklabels(['0%', '25%', '50%', '75%', '100%'])

# Set title and labels
plt.title('Best Practices for Matplotlib Colorbar Horizontal - how2matplotlib.com')
ax.set_xlabel('X-axis')
ax.set_ylabel('Y-axis')

plt.tight_layout()
plt.show()
Output:
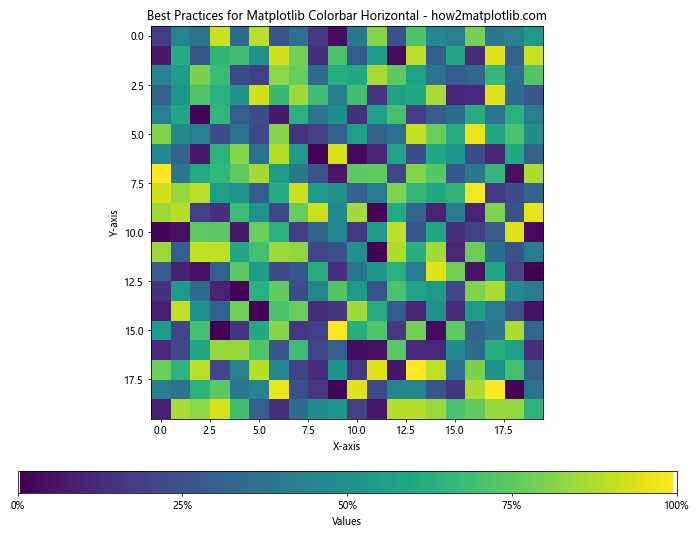
This example demonstrates a well-formatted plot with a horizontal colorbar, incorporating best practices for clarity and readability.
Troubleshooting Common Issues with MatplotlibColorbar Horizontal
When working with matplotlib colorbar horizontal, you may encounter some common issues. Here are some problems and their solutions:
Issue 1: Colorbar Overlapping with Plot
Sometimes, the horizontal colorbar may overlap with your main plot. To fix this:
import matplotlib.pyplot as plt
import numpy as np

# Create sample data
data = np.random.rand(10, 10)

# Create a figure and axis
fig, ax = plt.subplots(figsize=(8, 6))

# Create a color plot
im = ax.imshow(data, cmap='viridis')

# Add a horizontal colorbar with adjusted padding
cbar = fig.colorbar(im, orientation='horizontal', label='Values', pad=0.2)

# Set title
plt.title('Matplotlib Colorbar Horizontal - Adjusted Padding - how2matplotlib.com')

plt.tight_layout()
plt.show()
Output:
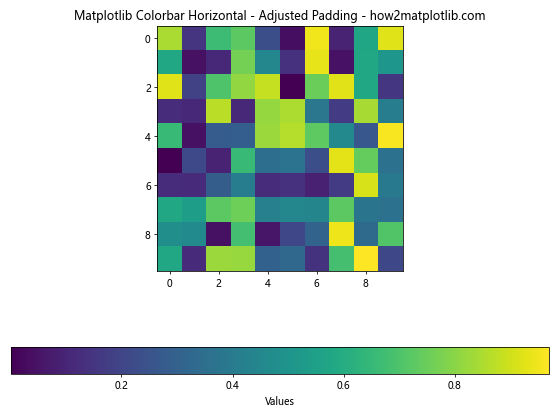
In this example, we use the pad parameter in fig.colorbar() to add more space between the plot and the colorbar.
Issue 2: Colorbar Too Small or Large
If your matplotlib colorbar horizontal is too small or too large:
import matplotlib.pyplot as plt
import numpy as np

# Create sample data
data = np.random.rand(10, 10)

# Create a figure and axis
fig, ax = plt.subplots(figsize=(8, 6))

# Create a color plot
im = ax.imshow(data, cmap='viridis')

# Add a horizontal colorbar with adjusted size
cbar = fig.colorbar(im, orientation='horizontal', label='Values', fraction=0.046, pad=0.04)

# Set title
plt.title('Matplotlib Colorbar Horizontal - Adjusted Size - how2matplotlib.com')

plt.tight_layout()
plt.show()
Output:
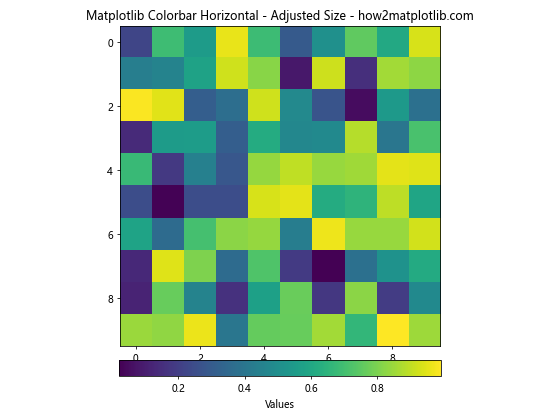
Here, we use the fraction parameter to control the size of the colorbar relative to the main axes.
Issue 3: Colorbar Ticks Not Aligning with Data
If your colorbar ticks don’t align well with your data:
import matplotlib.pyplot as plt
import numpy as np

# Create sample data
data = np.random.rand(10, 10) * 100

# Create a figure and axis
fig, ax = plt.subplots(figsize=(8, 6))

# Create a color plot
im = ax.imshow(data, cmap='viridis')

# Add a horizontal colorbar with custom ticks
cbar = fig.colorbar(im, orientation='horizontal', label='Values')
cbar.set_ticks([0, 25, 50, 75, 100])
cbar.set_ticklabels(['0', '25', '50', '75', '100'])

# Set title
plt.title('Matplotlib Colorbar Horizontal - Custom Ticks - how2matplotlib.com')

plt.tight_layout()
plt.show()
Output:
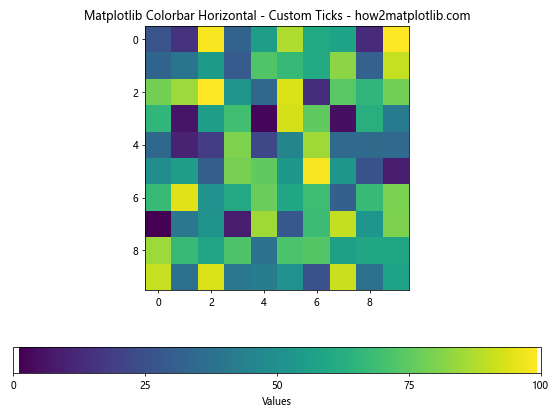
In this example, we manually set the ticks and tick labels to better align with the data range.
Advanced Customization of Matplotlib Colorbar Horizontal
For more advanced users, matplotlib offers extensive customization options for horizontal colorbars.
Custom Colormap
You can create a custom colormap for your matplotlib colorbar horizontal:
import matplotlib.pyplot as plt
import numpy as np
from matplotlib.colors import LinearSegmentedColormap

# Create sample data
data = np.random.rand(10, 10)

# Create custom colormap
colors = ['darkblue', 'blue', 'lightblue', 'lightgreen', 'yellow', 'orange', 'red']
n_bins = 100
cmap = LinearSegmentedColormap.from_list('custom_cmap', colors, N=n_bins)

# Create a figure and axis
fig, ax = plt.subplots(figsize=(8, 6))

# Create a color plot
im = ax.imshow(data, cmap=cmap)

# Add a horizontal colorbar
cbar = fig.colorbar(im, orientation='horizontal', label='Custom Colormap Values')

# Set title
plt.title('Matplotlib Colorbar Horizontal with Custom Colormap - how2matplotlib.com')

plt.show()
Output:
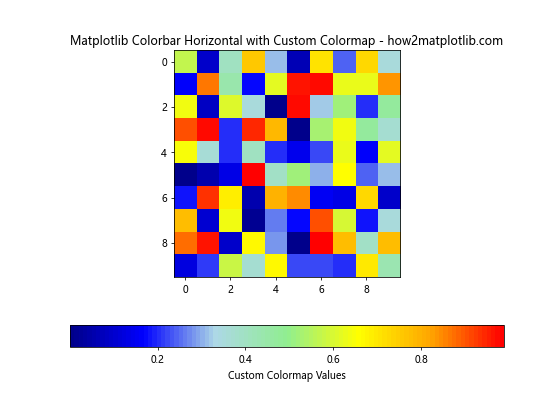
This example demonstrates how to create and use a custom colormap for your horizontal colorbar.
Colorbar with Discrete Boundaries
For data with discrete categories, you can create a colorbar with distinct boundaries:
import matplotlib.pyplot as plt
import numpy as np
from matplotlib.colors import BoundaryNorm
from matplotlib.cm import get_cmap

# Create sample data
data = np.random.randint(0, 5, (10, 10))

# Define the boundaries and colormap
bounds = [-0.5, 0.5, 1.5, 2.5, 3.5, 4.5]
cmap = get_cmap('Set1')
norm = BoundaryNorm(bounds, cmap.N)

# Create a figure and axis
fig, ax = plt.subplots(figsize=(8, 6))

# Create a color plot
im = ax.imshow(data, cmap=cmap, norm=norm)

# Add a horizontal colorbar
cbar = fig.colorbar(im, orientation='horizontal', label='Categories',
                    extend='both', spacing='proportional',
                    ticks=[0, 1, 2, 3, 4])
cbar.set_ticklabels(['Cat A', 'Cat B', 'Cat C', 'Cat D', 'Cat E'])

# Set title
plt.title('Matplotlib Colorbar Horizontal with Discrete Boundaries - how2matplotlib.com')

plt.show()
Output:
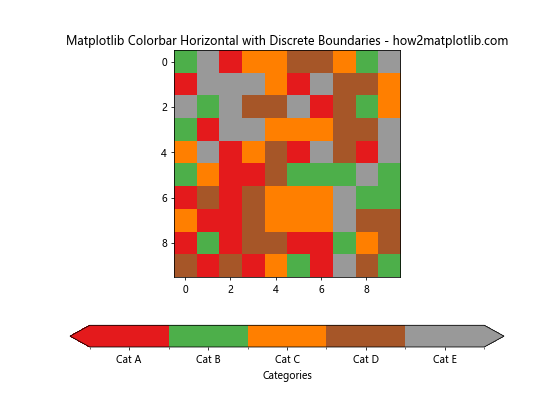
This example shows how to create a colorbar with discrete boundaries, useful for categorical data.
Integrating Matplotlib Colorbar Horizontal with Other Libraries
Matplotlib can be integrated with other libraries to create more complex visualizations.
Seaborn with Matplotlib Colorbar Horizontal
Here’s an example of using a matplotlib colorbar horizontal with a Seaborn heatmap:
import matplotlib.pyplot as plt
import seaborn as sns
import numpy as np

# Create sample data
data = np.random.rand(10, 10)

# Create a figure and axis
fig, ax = plt.subplots(figsize=(10, 8))

# Create a Seaborn heatmap
sns.heatmap(data, ax=ax, cmap='viridis', cbar=False)

# Add a horizontal colorbar
cbar = fig.colorbar(ax.collections[0], orientation='horizontal', label='Values', pad=0.1)

# Set title
plt.title('Seaborn Heatmap with Matplotlib Colorbar Horizontal - how2matplotlib.com')

plt.tight_layout()
plt.show()
Output:
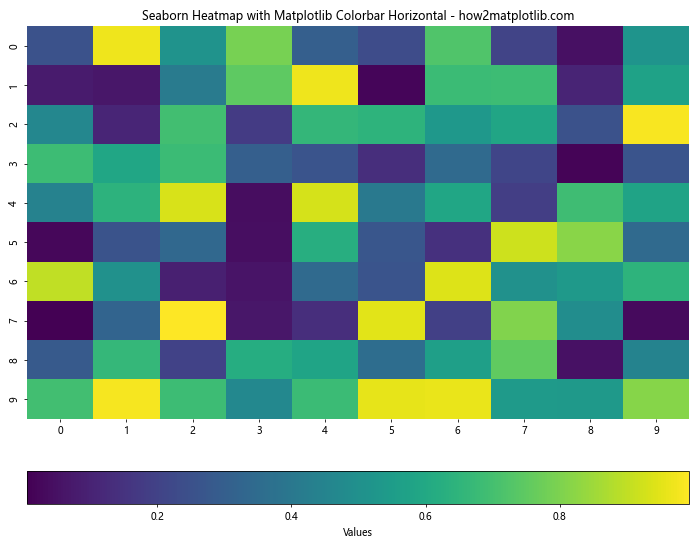
This example demonstrates how to add a matplotlib colorbar horizontal to a Seaborn heatmap.
Matplotlib colorbar horizontal Conclusion
Matplotlib colorbar horizontal is a versatile and powerful tool for enhancing data visualizations. From basic usage to advanced customization, this guide has covered a wide range of techniques for creating and manipulating horizontal colorbars in Matplotlib.
Remember that the key to effective data visualization is clarity and purpose. Use horizontal colorbars when they enhance understanding of your data, and always consider the overall layout and readability of your plots. With practice and experimentation, you’ll be able to create informative and visually appealing plots that effectively communicate your data insights.
Whether you’re working with simple heatmaps, complex 3D plots, or animated visualizations, the matplotlib colorbar horizontal can be a valuable addition to your data visualization toolkit. Keep exploring and experimenting with different options to find the best way to represent your data visually.